VISUALIZATION TOOLS USE IN SECONDARY MATHEMATICS CLASSROOM EDUCATION
Xiaoqian (Sophie) Niu
An undergraduate thesis submitted to the faculty at the University of North Carolina at Chapel Hill in partial fulfillment of the requirements for the degree of Bachelor of Science in Information Science in the School of Information and Library Science.
Chapel Hill 2018
ii 2018
iii ABSTRACT
Xiaoqian (Sophie) Niu: Visualization Tools Use in Secondary Mathematics Classroom Education
(Under the direction of David Gotz)
iv
Thanks to my advisor David Gotz and my research method course instructor Mohammad Jarrahi, I would not be able to do this without your guidance and support.
v
TABLE OF CONTENTS
CHAPTER 1 INTRODUCTION _____________________________________________________ 1 CHAPTER 2 LITERATURE REVIEW _________________________________________________ 4 Section 2.1 Visualization Technology Use in Daily Life _____________________________________ 5 Section 2.2 Visualization Technology in Educational Settings ________________________________ 6 Section 2.3 Visualization Technologies in Secondary Mathematics Education __________________ 7 Section 2.4 Teachers’ Roles in Visualization Technology Integration __________________________ 8 Section 2.5 Theoretical Framework ____________________________________________________ 9 CHAPTER 3 METHODOLOGY____________________________________________________ 12
Section 3.1 Data Collection __________________________________________________________ 12 Section 3.2 Interviewee Recruitment __________________________________________________ 14 CHAPTER 4 ANALYSIS _________________________________________________________ 16
Section 4.1 Visualization Tools Used in Math Classes _____________________________________ 16 Visualization Teaching Tools_______________________________________________________________ 16 Visualization Learning Tools _______________________________________________________________ 20 Section 4.2 Environmental Factors That Influence the Use of Visualization Tools _______________ 23
Characteristics of Mathematics ____________________________________________________________ 23 Characteristics of In-Person Classes _________________________________________________________ 27 Section 4.3 Personal Factors That Impact Designs of Visualization Tools ______________________ 28
1
CHAPTER 1 INTRODUCTION
According to National Center for Education Statistics (2016), there has been more bachelor’s
graduating with mathematics and statistics degrees. There is a tendency to assume that a lot of students enjoyed what they can learn in mathematics courses which lead them to pursue a career
in the field. Stepping in the mathematics classes, people don’t see much excitement about
learning mathematics as anticipated. Walking in the math buildings, one seldom sees excitement and enjoyment shown by others’ facial expressions. And if one says that learning mathematics is fun, he can easily receive a lot of “you are crazy” look from other students. Students have
identified a few reasons for disliking mathematics courses. First of all, the mathematics concepts are abstract and hard to understand. Secondly, there is always a lot of handwriting note-taking in
class, and sometimes the professors don’t have good handwriting or quickly jumping from topic
to topic which makes the learning experience even worse. What’s more, when they sit in a mathematics class, they usually don’t have much engagement with the content and find the
courses boring to listen to. In other word, students who are learning mathematics, have a hard time enjoying the learning process.
Learning in class is affected by the instructor’s teaching tool selection. Here at UNC, most of
the classrooms are equipped with projectors and document cameras, and some even have
2
not using any current digital technologies. On Quora, the popular question-and-answer site,
people asked “Why do most math professors prefer giving lectures using blackboards rather than
whiteboards or projectors? Do you prefer to do math on a whiteboard or a chalkboard? Why? (Quora, 2012; Quora, 2014)” Professors say that teaching with board and chalk is the way that
they learned from their teachers. Comparing to projecting PowerPoint, writing with chalk on the board provides, they can show the process of argument development to students. In fact, Chris Buddle, an assistant professor at McGill University, argued that teaching with blackboard and chalk kept students focused and actively engaged as they would more likely to take notes on the materials that the instructor put on the board than on the projector (Buddle, 2012).
Students are not satisfied with the current mathematics learning experience, and professors
are using the “outdated technology,” blackboard and chalk, to teach. Previous works have shown
that integrating visualization technology can improve students’ learning experience in the classroom, yet not a lot of studies have included teachers’ feedback for the technology
evaluations.
Thus, the research is proposed to further investigate how technologies, especially
visualization tools, should be designed to be integrated into secondary mathematics education in classroom settings. Visualization tools are defined as physical subjects and digital technologies that are designed or could be used for the purpose of presenting information with various degrees of graphic or words use. Some examples of physical visualization tools are blackboards,
3
wants to answer the question, “When we are improving teaching visualization tools that could be used in secondary mathematical classroom education, what are the crucial functional
requirements that the tools should have in the context?” To answer this question, the researcher
has proposed the following research questions to investigate the phenomenon:
RQ1. What are the visualization tools that math instructors and students use in class?
RQ2. What are characteristics of the mathematics classroom education’s content and context
that influences the selection of visualization tools?
RQ3. What are teachers’ and students’ behaviors and preferences that affect visualization
tools’ use?
4
CHAPTER 2 LITERATURE REVIEW
The research’s objective is to investigate how visualization technologies could be integrated
into the secondary mathematics classroom education. In order to better design future teaching or learning technological tools, this research is dedicated to explore the reasons why the current technology, especially blackboard and chalk, is the technology that mathematicians pick, while various educational technologies, ranging from hardware such as smart board, tablets,
touchscreen computers to software such as online graphical calculators, mathematical calculation and visualization programs, handwriting recognition tools, are available to them to facilitate teaching.
Visualization technologies or visualization digital tools are technology or digital tools that enable people to visualize certain concepts with graphs or interactive animations. With limited words, people sometimes make sense of information better with visualization tools.
Visualization can be divided into categories by the number of interactions, the commonly-seen displaying visualization, and interactive visualization. Displaying visualization presents the
data or abstract concepts in a graphic way and rarely involves users’ interaction with the
visualization, while interactive visualization involves users’ interaction in the visualization
5
Section 2.1 Visualization Technology Use in Daily Life
Research has shown that visualization technologies have improved people’s life quality. With
the rapid development of digital technology, the society has started to incorporate visualization
aids into every aspect of people’ life, ranging from facilitating work, enhancing leisure pursuit in music and managing personal life (Huang et al., 2015; Kandel, Paepcke, Hellerstein, & Heer, 2012; Nguyen & Le, 2016; Schedl & Markus, 2017). For example, Kandel et al. (2012)
interviewed business data analysts to see how the visual analytic tools can improve to enhance their working speed through the more meaningful presentation of data through interviews with 35 analysts from different sectors. In addition to aiding workflows, Huang et al. (2015) promote visualization tools into personal information management field as a way to connect data
collected from daily life and make sense of the data. What’s more, researchers have designed
visualization tool, Hyper Word Clouds, to improve the exploratory music search in large music repositories (Nguyen & Le, 2016; Schedl & Markus, 2017).
Seeing the full integration of visualization tools into people’s daily life, researchers have
developed learning technology and educational technology as the aftermath of technology development. Since education is such an essential part of life, educational technology, the study
of “properly creating, using and managing technological processes and resources” (Robinson,
6
Section 2.2 Visualization Technology in Educational Settings
Traditional education setting is in a classroom with a teacher lecturing mostly in the front of
the classroom. With knowledge of people’s learning behaviors, active learning is promoted for
better learning outcome. For better active learning, technology integration into the classrooms would be able to provide the students with more widely available knowledge online and more possibilities of collaborations with others to gain knowledge.
Previous research has shown the impact of integrating interactive visualization for
educational purposes. One example of interactive visualization would be video-gaming. Video-gaming requires a lot of user-interface interactions and video-game players quickly learn and addict to the well-designed interactive games. Seeing the great attachment that players have to the games, researchers have incorporated gaming into learning to enhance the learning quality. A
study has shown that properly designed math games can be beneficial to students’ math learning
(Vandercruysse, Elen, & Oostendorp, 2015). In addition to that, if reflections after the games are provided, students could learn more about the proper reasoning to understand math concepts.
By complementing learning with interactive visualization, such as augmented reality, students are more motivated and engaged in learning (Akçayır & Akçayır, 2017). Education in
scientific subjects, such as physics, astronomy, biology, and anatomy, are especially active in
incorporating modern technologies to facilitate students’ understanding of the subject matter
(Chi, 2005; Ferrer-Torregrosa, Torralba, Jimenez, García, & Barcia, 2015).
7
technologies, which may neglect the other important stakeholder in the learning system: the teachers.
Section 2.3 Visualization Technologies in Secondary Mathematics Education
As a foundational subject in science education, mathematics, however, has been downplayed
in research that developing comprehensive visualization technologies for students’ learning and
teaching. However, pure displaying visualization technologies are more prevalent than
interactive visualizations. Comparatively, more geometrical software is available for use, which
mostly emphasized on the visual display of the geometry rather than engaging students’ learning
through interactions (Bertot, Guilhot, & Pottier, 2004; Mara Cotic, Zuljan, & Simcic, 2005; Zengin, Furkan, & Kutluca, 2012).
In general, more guidelines have provided to K-12 teachers’ math course planning and the
ideal amount of knowledge that students should gain (Michigan State University, 2014). However, there are rarely large associations or government involvement in standardizing
secondary mathematics education or measuring the students’ learning quality in higher education
institutions. From a pragmatic view, higher education institutions should not only provide the adequate information to students upon the field knowledge, but also prepare students to use the technology that will be useful in a workplace within the subject of study since technologies are so integrated into workplaces for efficiency and easiness (David & Abreu, 2014). With the social trends of utilizing information and communication technology to collaborate in work and calls for active learning in educational settings, students are set to use technology in their academic learning.
8
how visualization technology can improve the secondary mathematics experience in classroom settings.
Section 2.4 Teachers’ Roles in Visualization Technology Integration
Since a lot of the visualization technology evaluations and implementations are based on
students’ feedbacks and focused on learning perspective, students are engaged in the
development of learning technology. However, what’s more concerning lies in the neglected
perspective of the frequently leading role in the classroom –– the teacher. Despite the tools designed for mathematics education, rarely do any mathematics teachers use technology teaching aids.
Researchers have investigated on characteristics of teachers that could have caused this lack of technology integration into teaching. Virtual technologies including VR and AR are good ways to increase students’ engagement in class, yet teachers’ beliefs and readiness of technology
greatly impact on technological integration into teaching (Howard, Chan, & Caputi, 2015).
Specifically, study shows that teachers’ episode memory impacts their beliefs, which
subsequently limits technological integration into teaching (Er & Kim, 2017). To better integrate
technology into teaching, teachers’ episode memories need to be reassessed and evoke their
change in beliefs. Also, Martín-Gutiérrez (2017) identifies that the teachers who resistant to integrate visualization technology innovations into teaching may think that adopt new technologies requiring a great amount of time and energy (Martín-Gutiérrez, 2017).
Nevertheless, Technological integration requires teachers to open up flexibility for students
to learn so that students are more confident in their ability. A teacher’s beliefs of their
9
and that he also believes that students could find, or be their source of knowledge (Kim, Kyu,
Lee, Spector, & Demeester, 2013). This change in beliefs has taken place in teachers’ education
since Obiefuna & Offorma (2014) shows that pre-service teachers are more optimistic about mobile use in classrooms. Because of the prevalence of the technology, teachers start to adjust their perception of technology use in class so that the technology, such as mobile phone, could become an access point to great visualization tools instead of a distraction from learning the materials.
Section 2.5 Theoretical Framework
Most of the research done has based their research on either teachers’ or students’
perspectives, which lead to the imbalanced evaluation feedback for technology implementation. As a result, visualization technology could hardly be applied in the general classroom setting. To provide literature that will promote actual use of visualization technology tools in the classroom
settings, this exploration analysis would like to take on Nardi & O’Day's (2000) information
ecology framework to have a holistic view of the interactions between human and technology in the classroom setting.
In the information ecology concept, we need to consider the environmental factors as well as
personal factors as interdependent. Elements in the system will change based on other elements’
10
a more holistic view of the current situation (Johri, Teo, Lo, Dufour, & Schram, 2014). In another word, considering an ecology as a system, then students and teachers are the two critical stakeholders for the product, visualization technology tools that researchers need to gather feedback from. Guiding with the framework, below is a visualization of the classroom ecology that this research will investigate on. The research questions are designed to investigate both environmental factors (RQ2) and personal factors (RQ1) following this theoretical framework.
Figure 1 Researcher Identified Classroom Ecology
In all, there are two gaps in the prior works that this research has designed to fill in. For one, limited research has done on visualization technology in the context of secondary mathematics
education, and the studies mostly analyzed the current tools’ functionalities without further
11
12
CHAPTER 3 METHODOLOGY
As Creswell (2009) suggests, “Qualitative research is exploratory and is useful when the researcher does not know the important variables to examine.” With limited earlier research done
on the technology tools used for secondary mathematical learning and teaching in classroom settings, this research is by nature exploratory research. Thus, this research will incorporate in-depth interviews to gain insights from both teachers and students, and also include four class observations sessions to evaluate the current interactions happening in the classrooms. Section 3.1 Data Collection
As a major qualitative data collection method, interviews allow researchers to gain deep insights from interviewees about the subject matter which quantitative research methods such as questionnaires or experiments can hardly gather. By asking follow-up questions, researchers can direct the interview to collect more information from interviewees about specific topics. Seeking
to understand both teachers' and students’ perspectives on the technology tools used in mathematics classrooms, the researcher interviewed mathematics professors and math major undergraduate students.
Even though the research could expand the sample representativeness by conducting virtual interviews with students and professors across the United States through Skype or Google Hangouts, the researcher would then lose a lot of non-verbal information with the interviewees including their body languages and their emotions, which is important for understanding
13
research was only carried out in universities and colleges located in the North Carolina Research Triangle Park (RTP) area.
The interviews were conducted in common places that interviewees would be in for their
daily life. Specifically, the interviews with mathematics professors took place in the professors’
offices. And the interviews with the students were carried out in reserved library study rooms on campus. By interviewing in a somewhat natural setting for the interviewees, interviewees can be less anxious, which could be caused by being in unfamiliar locations.
However, since interviews are really subjective and interviewees may have bias when
describing their current classroom education, the researcher conducted classroom observations to gain a more objective perspective about the current classroom education. Based on the interviews with teachers, the researcher asked teachers who had either strong teaching philosophy or
innovative teaching tools for class observation. The researcher observed three classes, including Calculus of Functions of a Single Variable 1 class in UNC, Statistical Models class in WFU and an Introduction to Applied Mathematics in NCSU. The calculus class had around 110 students in a large auditorium setting hall. The instructor taught with iPad and Apple Pen. The statistical models class had about 40 students in a five-row lecture room and the instructor taught with projected slides and wrote on the whiteboard with markers on the side. And the applied
mathematics class had around 18 students in a four-row classroom and the instructor taught with blackboard and chalk and then projected and talked through a relevant PowerPoint slide for another course.
14
teacher interview protocol has three sections, investigating the teaching motivation and goal, use of technological teaching tools, and teaching environment. Student interview protocol followed a similar fashion and break down into three sections, math learning background, math learning experiences and future envisioning for math learning aids. Rather than an inclusive of all the questions that the researcher asked and scenarios that researchers took notes on, the protocols and guideline showed the main questions and things that the researcher noted as useful to answer the research questions. In order to better analyze the interviews, the researcher used her phone to voice to record all the interviews.
Section 3.2 Interviewee Recruitment
The researcher first selected universities and colleges nearby to conduct teacher interviews. Then the researcher selected teacher interviewees based on mathematics department faculty websites in each university and college. Due to the limited information provided on the websites, the researcher consulted with her friends who are studying in the institutions and had taken a few math classes for interviewee recommendations as they would know more about the professors in their institution. The researcher sent emails to the selected teacher interviewees and scheduled one-hour interviews with the interviewees.
Since there is no public contact information online about undergraduates, who are math majors in any institutions, the researcher sent out student interviewee recruiting email through the department mailing list. The researcher chose to focus on the math major students as they are the group of students who take most math classes and are important stakeholders in the
15
16
CHAPTER 4 ANALYSIS
The two data sources that the study bases on are the interview recordings and class
observation notes. In the end, the researcher had over nineteen hours of recordings. For the sake of time, she used Temi, an online automatic transcription website to transcribe the voice
recordings in bulk quantity. Then she revised the inaccurate transcription based on the voice recordings. After revision, she generated repeating themes and counted number of teachers who mentioned the themes. In the following section, the researcher will further present her
interpretation of the data by answering the research questions:
RQ1. What are the visualization tools that math instructors and students use in class?
RQ2. What are characteristics of the mathematics classroom education’s content and context
that influences the selection of visualization tools?
RQ3. What are teachers’ and students’ behaviors and preferences that affect visualization
tools’ use?
Section 4.1 Visualization Tools Used in Math Classes
Visualization Teaching Tools
17
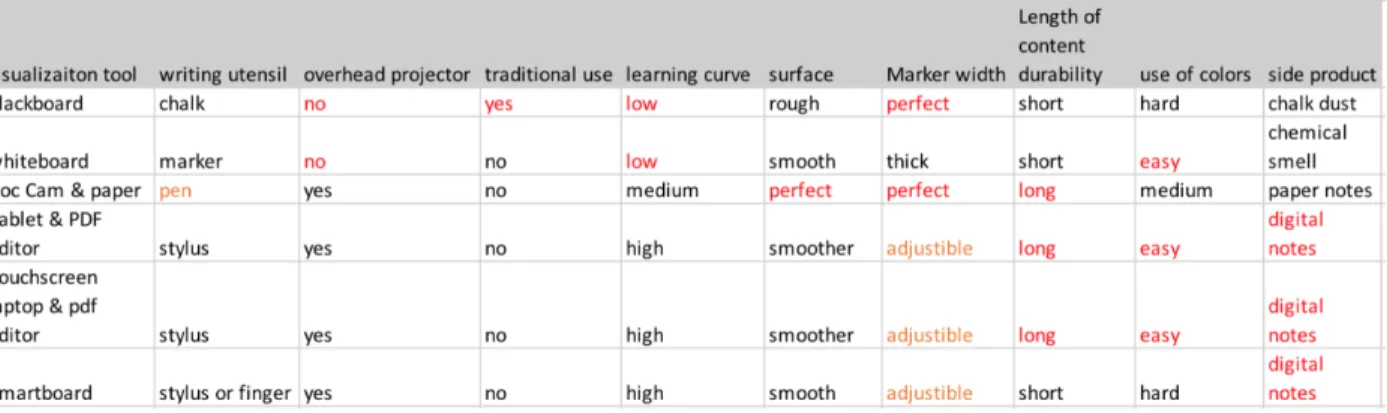
classroom, the teacher often first select blackboard as their teaching visualization tool. Based on the interview recordings, the study compares and contrasts the advantages and disadvantages of blackboard with other alternative tools.
Table 1. Comparisons among visualization teaching tools
Writing on the blackboard with chalk has been the teaching convention in mathematics classroom education for several reasons. First of all, this is how people taught in a classroom setting in the history and the instructors mostly learnt mathematics in a classroom by seeing their teacher writing with chalk on the slate blackboard, blackboards made of thin layer of black or
dark grey slate stone. Hence, when the instructors start to teach, they follow their teachers’
selection. Yet this tendency of following the tradition could be changing. Quite a few of the teacher interviewees said that they started to utilize other visualization tools, especially the digital visualization tools such like transparencies, document cameras since the nineties. And out of the thirteen teacher interviewees, there are two professors who use touchscreen laptops, tablets with stylus to teach and a few who are interested in trying to teach with tablets and stylus. Hence, their students are exposed to multiple visualization tools for teaching and the tradition will be adapted.
18
are really intuitive to use as they are similar to pen and paper that people use to jot down things, except that people may write a bit differently on a vertical blackboard surface with a chalk than writing on the flat paper with a pen. Yet, in order to use other tools that involves projecting screen, the teacher needs to learn how to appropriately project things on the screen. For example, if they want to write on paper with a pen and project it using document camera, they need to know how to adjust the camera lens. If they want to show slides from their own computer, they need to have the compatible adapters that connect the computers. If they want to use tablets and a stylus to write electronically, they need to know how to set up the simultaneous wireless
connection between the tablet and the class computer system before class. In other word, using
blackboard and chalk doesn’t require any learning curves for the teachers to use like other digital
visualization tools do.
Writing on the whiteboards with markers doesn’t require learning curves as well, yet a
teacher interviewee who largely prefer to use blackboard claimed that there are fewer people allergic to the chalk dust than the pungent chemical smell of whiteboard markers. And a teacher interviewee who prefer whiteboard to blackboard, said that “I find that there’s something very
aesthetically unpleasing about tactile writing with chalk on the board, like it just gets in my nails
and I really don’t like it. Especially, the colored chalk is disgusting. It could really get into your
soul.” Even though he doesn’t think the dust does much harm to him, he would rather use
markers that doesn’t create difficulties for him to maintain clean and tidy.
19
blackboard has the ‘inherent slowness’ that paces lectures with an appropriate speed for students’
learning.
What’s more, teachers preferred the chalk mark width and fluency to other handholding
utensils’ mark width. The whiteboard markers usually have really thick writing marks that distort teachers’ handwriting. And stylus usually can adjust the displaying mark width, yet stylus
require fluent and accurate surface recognition for electronics, which isn’t universally good
across touchscreens and tablets.
Nonetheless, teachers also argue that there are downsides for using blackboard. For one, the
writings on the blackboard will only exist for the short period in class, and students won’t be able
to see it after it is erased. If writing on paper and project it on to the overhead screen, teachers are able to later scan the notes and share the notes with students electronically. Or if the teacher writes on the electronics, he or she can immediately share it with students after class. Saving the writings electronically not only helps students to review and study, but it also helps teachers to read over when they teach the same class in the future and reduce the preparation time for the class. Teacher interviewees said that if they had the notes that they created in earlier semesters, they could usually finish preparing the typical one-hour long class in less than forty minutes, some as short as fifteen minutes.
In addition, among the interviewees, nine out of thirteen teachers agreed that because of the
dark surface color, chalks on blackboard don’t show colors as well as markers on the white
20
Though PowerPoint slides are the first visualization teaching tool that interviewees thought of other than blackboards and chalk, they generally disliked slides in math classes for that teachers could pace through the materials too fast. One teacher I interviewed said that she used PowerPoint slides at the beginning of a course, then in the middle of the semester, students complained that she went over the materials too quickly using the slides, and they could not have enough time to make sense of the material in class as they would have without the slides. After hearing the comment, she gave up on using slides and taught by writing notes on the blackboard using chalks and students did not complain about her teaching pace any more.
More importantly, they would not be able to see how the teacher developed the argument or the thought process to tackle a problem, which students would be able to learn how to understand and dissect a similar problem using the new concepts or logic.
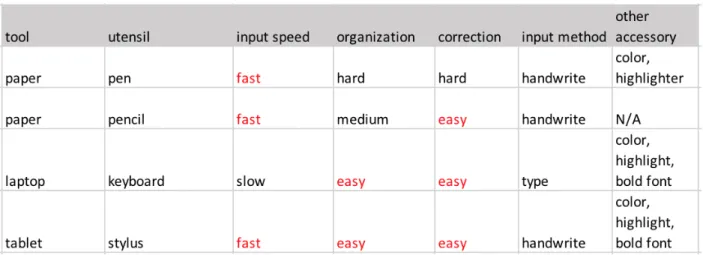
Visualization Learning Tools
While teachers have a lot of visualization tools, such like Wolfram demonstration projects1, Linear Algebra Toolkits2, Geogebra library 3and so on, to use for demonstrating concepts, students use relatively fewer learning tools in math classes – paper and pens. Just like one teacher interviewee said, “Our students are trained to take very good notes in class”, most of the
students would first take notes on things that the teacher writes on the board and then later review the notes when doing homework to further understand the material. In essence, students utilize their notes as a visualization to understand the material. While it is common for college students to take notes with laptops in class, relatively few students would do so in math classes.
1http://demonstrations.wolfram.com/topics.html This is a collection of science, math, technology demonstration
programs that individuals created and uploaded for others to use.
2http://www.math.odu.edu/~bogacki/cgi-bin/lat.cgi This is a collection of online linear algebra calculation toolkits
that students or teachers could use to learn the concepts.
3https://www.geogebra.org/materials/ This is a collection of Geogebra online calculator based programs open for
21
Below the research listed out advantages and disadvantages of visualization learning tools based
on the students and teachers’ interview transcripts.
Table 2. Comparison among visualization learning tools
There are several ways that student interviewees have tried to take notes with computers. For one, students can type notes into computers. One student had tried to use laptops or phones to take notes, but he could not type as fast as he wrote and it was hard to put a plot in a word document, so he just used pen to take notes in a notebook. The other student used laptop to type
up notes on Latex. However, it was really slow as well and she didn’t do that anymore.
Both students mentioned that it was really slow to type notes, and the major reason is that mathematics notes usually involves Greek letters and it is really hard to line up equations from
line to line in a short time. Mathematicians use Latex to type their research paper, but there’s a
really deep learning curve to learn Latex and students may not be able to type notes in the limited time that they have for the class.
When asked for whether one would like to take notes using stylus and tablet, students have different standings. One student said that, “I have not used tablet and stylus to take notes, but I feel like it is quicker to write on the computer and if I do it on paper, it’ll take a little longer to
22
computer, and I feel like, doing that, takes a little longer and I am going to spend more time on
the material.” The students emphasized that she would think through the material when she was
taking notes, and the longer time that she could take to digest the notes, the better she would be
able to learn. While a few other students said that they would “happy to try it out” because
writing with a stylus on a tablet is similar to writing with a pen on paper notebooks.
Besides the speed of jotting down the notes would impact on their learning, students also use colors to organize their notes visually to facilitate their learning. Three of the interviewees mentioned that they would use different colored pens to separate definitions, corollaries, theorems and examples, or to separate different concepts. One student would use a pen to take down words that the teacher wrote, and then use a pencil to draw sketches for concepts and problems because pencil marks can be erased quickly and easily so that when he needs to review the notes, he would have an organized and clean sketch to help him visualize the problem setting or the concept.
Even though students and teachers both mention that they would acquire a textbook for the class, textbooks are not the primary visualization tool in class. Rather, students would use textbooks as a backup learning resource only when they could not understand the notes that they took in class or could not think of a way to solve the homework problem.
23
to help them understand and color-code the materials for the sake of faster speed comparing to type notes with computers.
Section 4.2 Environmental Factors That Influence the Use of Visualization Tools
As visualization tools can be seen as one new species in the classroom ecology, we want to investigate some environmental factors that influences the its interaction with other two key species, teachers and students.
Characteristics of Mathematics
First of all, the study would like to investigate how the subject matter, mathematics, influences on the visualization tools’ design.
I. Misconception About Mathematics
For the general public, there is a misconception that “Math is typically presented as old,
static and done a long time ago.” In order to clarify the misconception, teachers need to introduce
things that are unknown and introduce that there’s still a lot to learn even by the most expert people. teachers could introduce these concepts by sparking students’ interest in mathematics
through attractive visualization tools.
There are a lot of online animated visualizations of specific concepts, such as GIFs of Fourier Series4, different colored-dots falling to different event bars to show different conditional
probabilities5. After seeing these in the interviews, professors were amazed to see the
visualization demonstration of the specific concepts. And they said that they would try to show the visuals to students in class as the visualizations are innovative and fun to play with, teachers could try to bring those visualization into class demonstration to keep students engaged.
4https://math.stackexchange.com/questions/733754/visually-stunning-math-concepts-which-are-easy-to-explain
The researcher showed these GIFs to interviewees and asked for their opinions.
5https://students.brown.edu/seeing-theory/compound-probability/index.html#section3 The researcher showed
24
Yet professors consider that these specific animated visualizations would not be the main part of the learning, as
“we are trying to see the forest of all mathematical ideas, and these visualizations, when
built, are only for students to see the trees of very specific concepts.”
“It is always going to be narrow because I mean, you know, making a visualization tool, you
gotta be very specific about what you're visualizing.”
“They are too specific and could only be seen as a side dish to the course, but the main dish
should still be the teacher talking through concepts, students thinking through and
connecting ideas.”
In other words, innovative visualization tools would be helpful to maintain students’
engaging in the class and would be helpful for students to understand one or two specific theories or concepts, but they are not the level of abstraction that students need to have for all their
mathematical knowledge.
Another way that would boost students’ interest in mathematics is by building up their
confidence in tackling math problems. As three professors mentioned that they would seldom have students to do exercise problems in class, and if they saw one student who got it correctly, they would have the student present his or her work to the class. One professor who uses an iPad
to teach said that, “one nice thing about the iPad is that in my smaller classes like the first-year seminar, I can take the iPad and use as a camera and I can show, either by taking a picture or
showing live of students’ work by showing it in the projector. They can write on the iPad as
well.” In this way, students can engage with the material and feel that they are able to solve the problems, which encourage their studies in the subject. Hence, visualization tools like tablets
with camera functions could assist to increase students’ engagement in the class, which will in
25
II. Procedural Development Presentation in Class
“I like teacher to write on the board because then I can see how the teacher’s thinking process like.”
“What I write on the board is like an example of how they could develop their arguments. I don’t want them only know the answer, but also know how to get to the answer.”
From both students and teachers, they all talked about showing procedural development for either proving a theory or approaching an applied real-life problem. And thus, teachers should be mindful of not giving away too much information at a time. Visualization tools like blackboards and whiteboards will constrain teachers from doing that because they can only write so much at a time, however for visualization tools like PowerPoint slides, the teacher needs to leave space for
steps to be developed at the stage. What’s more, one teacher said that, “Giving away too much
information would just spoil the fun.” As, students learning mathematics are learning the skill to solve new problems using meticulous logical arguments gained from existing concepts. Thus, visualization tools need to provide space for teachers to ad-hoc show their thinking process or logic flow so that students can develop their problem-solving strategies from teachers’
demonstration.
III. Students Learn Better By Struggling in Doing
“over the years I realized that the more a professor does in front of students, the less they learn. they need to do problems themselves, we cannot do things for them. It doesn't matter how nice you demonstrate on the board is. It's just like playing a musical instrument or learning a foreign language. If you don't speak it, you don't learn. It doesn't matter how well you can actually look at a French speaking person speaking the perfect language. You have to practice.”
26
problems to actually learn how to use the theories. But students are not necessarily doing it on their own, as one professor made an analogy to theory of scaffolding in childhood.
“scaffolding in early childhood. It's the same as with undergraduate and frankly is like, you
know, you can't read for them, you can't write for them, but you start off by tracing the letters and having them trace them or you know, you do things like they read one page and I read one
page or you correct them and let them stumble.”
And the way that the professor said how he taught following this theory, is that he tried to do minimal amount of how to do certain things or how to understand certain concepts, and then had the students to do something and then generated questions. In this way, students would learn through some self-exploration, which is necessary when they are solving new problems that they have never seen before.
Another reason why teachers would create more time for students to doing something is class is that, students are not always very good at admitting to themselves or knowing right away that they don't understand something. And by doing a problem, they would be able to see their actually level of understanding. As students also reported that they only knew how well they learned when they did the homework problems. And they learned the most from doing the
problems, as another professor said, “By doing problems or creating proofs, students would be able to see where they stumble and ask the right question to understand the process of tackling
problem.”
27
teacher nor visualization tools should take away the thinking and struggling process from students.
After all, mathematics carries with a misconception, and teachers need to disprove it, which could be done by engaging students to learn better in the class. Students need to learn how to develop the thinking process, thus teachers need to show the procedural of argument developing rather than only providing one answer. By doing the problems and struggling on their own in class, students can explore and discover ways to develop their own arguments, which means that they actually understand how to use the concepts with higher self-confidence.
Characteristics of In-Person Classes
Besides some characteristics of mathematics education that influence the objectives of visualization tools, some characteristics of in-person classes also are environmental factors on the visualization tools, such as class size and in class time length.
For one, the class size influences how teachers interact with students, and visualization tools
could help to facilitate. The larger the class gets, the hard it is for teacher to assess students’
learning progress. And teachers may easily pace too fast and students are lost in the lecture and not able to learn the material. Some introduction classes would have more than 100 students in a class, where teacher can never interact with each individual student. With mass online question
answering systems such as poll everywhere, teachers can see students’ answers to the questions
through the chart distribution or world cloud. In this way, the online system help teacher to
visualize quickly visualize students’ understanding level and decide on the next teaching step. In other words, for larger mathematics classes, teachers could pace the lecture better with some
28
Another constraint for in-person class is that the class time is limited. As there are lots of materials and ways to demonstrate the ideas, teachers need to carefully select the teaching method and use the class time wisely. Particularly, teachers would like to have little to none time transitioning between visualization tools so that the class is more dedicated to learn the actual material rather than to learn how to work with the visualization tools. For example, if a teacher is using blackboard to teach and wants to show a graph in computer, he would either put up the graph at the beginning or the end of the class to avoid wasting time heating up the projectors or connecting different visualization tools to projectors. However, that may not be the best time to show the graphs for student to understand the concepts. Hence, visualization tools should try to incorporate multiple types of visualization, including sketches, graphics, animations in one place to save time for file transferring or alternation among tools so that the class time is better used.
To conclude, facing the time constraint, visualization tools should have a great capacity for various types of visualizations so that teachers can demonstrate the concepts with the most effective visualization for students while not wasting time on setting up the visualization tools.
and for teaching in large classes, additional visualization tools for quick assessment of students’
learning progress would be helpful for teachers to pace their teaching progress. Section 4.3 Personal Factors That Impact Designs of Visualization Tools
In addition to environmental factors such as mathematics education characteristics and classroom characteristics, personal factors such as acceptance to typing or level of interaction would also influence how visualization tools should be designed.
Typing is less achievable than handwriting
While people nowadays type more than write, mathematics teachers still think that
29
the context should be developed with good handwriting recognition technology so that teachers can easily write on the tools.
“Typing not only do I think it brings no value in this context, I think it's counterproductive because a student will look at this [class notes that I wrote] and see handwriting,
handwriting, handwriting. And when students write up the homework, they are going to be handwriting, handwriting, handwriting and they'll see stuff that is achievable and thinking that they could do that. In a sense, I'm giving them a demonstration of what it is I'm
expecting them to do. You look at these beautiful computers generated and see the shading and multiple colors on these figures and it's like, wow, it's like a photograph! I can't do that with my pencil. But I want students to look at that and be like, “Oh the teacher did it by hand, I can do that, too.”
The above example shows that the teacher would like to make the materials appear achievable for students by writing the notes. Even though this could be one reason, the vast majority of mathematics teachers would prefer handwriting because it is easier to do and taking less time to accomplish, especially when there are a lot of special mathematical characters that are not easy to type in the commonly used Word document.
Crucial Human Interaction
“I lecture at you, you take diligent notes, I give you homework problems, you go do problems
without cheating or looking them up and you generate questions and you then come to office hours and ask. I think this is a paradigm a lot of professors will want it to be true, yet it is only true for very, very, very diligent students.
Since professor’s time is a precious resource, professor is thinking that the best use of their
time is to lecture, but I think the best use of their time is making the dialogue with students about what's actually going on and the best way to provoke that is to have it happen in
class.”
30
Teachers are able to assess students’ understanding by asking conceptual questions and
answering questions that students have, so the learning process is tailored to students’ need. It works as teachers will need to answer fewer questions after class, and students don’t need to
spend long time on understanding a concept after class before they could use the concepts to do problems. However, students reported that they would hesitate in asking questions in class and would mostly try to understand the materials by going over the material again after class. To minimize the duration of unnecessary self-learning, visualization tools should break the barriers between people by building in functions to encourage or facilitate students to ask questions in class, especially in larger classes.
As discussed earlier, students are able to learn better by involving into the argument developing process or doing the problems in class. Teacher interviewees who create time for students to do problems in class usually walk around the class to help out individual students or
peak at students’ work over their shoulders to see where they get stuck. And in one class that I observed, the teacher wrote out the steps or side comments on the iPad as she walked around and helped out. And if she were using blackboards or document cameras, she would need to go to the front of the class and do so, which is not so convenient and flexible as portable tablets.
In addition, teachers preferred board writing than document cameras because “it feels static,
less engaging, to sit at a place and write than standing in front of the board and write. Also,
students are less focused when you are sitting down and writing.” As teachers feel that teaching
31 Students don’t learn all material in class
Even though students try to pay attention to the teacher’s teaching, and to understand as
much material as they can in class, it is actually not quite possible for students to learn all
material in the class. Just like the student mentioned earlier on, when it takes longer time to write down the notes, she can spend more time on understanding the concepts. It takes time for the learning to happen, and even if the students can learn the materials right away, studies have
shown the students will forget a lot of the materials if they don’t review it in a timely manner. As
suggested by students, a recording of the class that documented teacher’s explanation along the
notes will be helpful for students to review the materials without selecting valid sources online to understand the materials. In fact, the professor who teaches with a touchscreen and stylus
actually record his screen and voice for every class, and he would upload it online after class so that students can watch part of the recording to understand the materials on their own pace.
In addition, as students admitted that they don’t always have long attention span and would
zoom out for a short period of time during the lectures. Hence, students would like to have longer time to see previous steps that the teacher went over in class. As a result, visualization tools should be able to have enough space for large amount of information to be presented at a
time so that the teacher doesn’t need to erase the previous information in order to find space and write further argument development. Alternatively, visualization tools should have functions to resize, tag previous written information so that it could be retrieved for comparing and
32
CHAPTER 5 CONCLUSION
Section 5.1 Implications and Contributions
In the study, we first compared current visualization tools used by teachers and students in secondary mathematics classroom education, then by analyzing the environmental and personal factors in the classroom ecology, we derived some functional requirements for future
visualization tools:
Easy to set up for use in class
Easy element edits such as moving, copying, highlighting, erasing, resizing and tagging Various color selection for color coding information
Easy transfer among people Portable to use while standing
Generate records of in class activities for future use Integrate different kinds of visualization in one place Open to innovative visualization that can allow exploration Section 5.2 Limitations and Future of Work
33
and students from across the United States to compensate for the possible regional biases in this study.
Another limitation that is influenced by sample selection is that the interviewees mostly from research universities. Comparing to other types of secondary institutions, such as community colleges, liberal arts colleges, research universities are more focused on academia researching
than professional developing. Thus, the study’s result may not be true to other types of secondary
institutions. To better understand the overall secondary mathematics classroom education in the United States, similar study design could be carried out in community colleges and compare and contrast the results with this study to gain a more holistic view across different types of
secondary institutions.
Furthermore, even though the researcher emailed a few graduate students, generally the graduate students did not respond to participate in the study. Graduate students tend to be new to the teaching realm and they may have different preferences on visual tools from professors who have been teaching for over five years. Hence future studies that focus on the graduate students would be valuable for developing the future visualization tools as they will be the main users.
In addition, this study is a cross-sectional study that relied on short interviews which are
largely dependent on the interviewees’ subjective perspectives and limited to the specific time
34
APPENDIX 1: TEACHER INTERVIEW PROTOCOL
Teaching motivation & goal
What’s the ideal proportion for teaching, researching and servicing? Why?
What’s your actual division of each part that is required by the department?
What’s your teaching philosophy?
Have your earlier (teaching) experience influencing your teaching? How? What are the typical courses you teach?
How long have you been teaching? what’s a typical flow of your class?
What do you expect students to do in class?
How do you evaluate students’ performance? why do you choose these methods?
what do you expect students to gain from the class? Use of tech teaching tool (presentation method)
What do you use for preparing the class? how long do you need to prepare for a class? What materials and tools do you use for teaching the class?
Have you tried to use other tools to teach? What worked? What not? What are some implementation needed that you would continue on using those?
How would or should viz help to assist teaching/ improve student (conceptual) learning in class?
35
How do you feel about using tablet, touchscreen laptop, white board, blackboard, smartboard, doc cam, slides to teach?
How do you balance conceptual learning and real-life problem solving? How do you pick textbook for the class that you are going to teach?
Have you used any visualization tools to demonstrate or illustrate concepts? If so, where did you find it?
How do you feel about group work or collaboration among students? What do you think of students’ using tech/computer in class?
Teaching environment
Have you noticed changes in students or use of tech influencing your teaching?
If you are giving an advice to new phd student for teaching, what (type of) technology tools you may suggest? Why?
Has the classroom influence how you teach? If so, how teaching tools help mediate the influences?
What’s an ideal classroom environment for you (class size, equipment)?
What are something that you wish to have in class?
36
APPENDIX 2: STUDENT INTERVIEW PROTOCOL
Math learning background
What are some math classes that you have taken? What made you decide to major in math?
Math learning experiences
Say you want to learn the content to 100%, how much do you learn before class, in class and after class?
What are some materials that you use to study a math class?
Recall your fav/ worst math class that you have had, what makes it enjoyable? Did teacher do anything different in the class?
Do you like group work with other students in math classes? why or why not? How do you take your notes?
What do you usually take notes on?
Do you go to office hours? Why or why not? How frequent?
Do you use resources other than class notes, textbook? If so, what are they?
How do you use your textbook, if you have one? Do you have preference in printed or digital textbook?
What do you value the most in a math class? Future envision for math learning aids
37
If there’s an opportunity to provide you with other learning tools for free, what would you
38
APPENDIX 3: CLASS OBSERVATION GUIDELINES
In class, the researcher noted down:
Number of students’ questions:
Class size
Tools student used
39
REFERENCES
Akçayır, M., & Akçayır, G. (2017). Advantages and challenges associated with augmented
reality for education: A systematic review of the literature. Educational Research Review,
20, 1–11. https://doi.org/10.1016/j.edurev.2016.11.002
Bertot, Y., Guilhot, F., & Pottier, L. (2004). Visualizing Geometrical Statements with GeoView.
Electronic Notes in Theoretical Computer Science, 103, 49–65. https://doi.org/10.1016/j.entcs.2004.09.013
Buddle, C. (2012, April 12). In praise of chalk: the value of teaching without technology. Retrieved December 2017, from Antropod Ecology:
https://arthropodecology.com/2012/04/11/in-praise-of-chalk/
Chi, M. T. H. (2005). Commonsense Conceptions of Emergent Processes: Why Some Misconceptions are Robust. The Journal of the Learning Sciences, 14(2), 161–199. https://doi.org/10.1207/s15327809jls1402
Conati, C., Carenini, G., Hoque, E., Steichen, B., & Toker, D. (2014). Evaluating the Impact of User Characteristics and Different Layouts on an Interactive Visualization for Decision Making. Eurographics Conference on Visualization, 33(3).
https://doi.org/10.1111/cgf.123
Creswell, J. W. (2009). Research Design: Qualitative, Quantitative, and Mixed Methods Approaches.
David, F., & Abreu, R. (2014). Information Technology in education: Recent developments in higher education. Information Systems and Technologies.
https://doi.org/10.1109/CISTI.2014.6876950
DataUSA. (2016). DataUSA Math & Statistics Major. Retrieved December 2017, from DataUSA: https://datausa.io/profile/cip/27/
Er, E., & Kim, C. (2017). Episode-centered guidelines for teacher belief change toward
technology integration. Educational Technology Research and Development, 65(4), 1041–
1065.
40
Ferrer-Torregrosa, J., Torralba, J., Jimenez, M. A., García, S., & Barcia, J. M. (2015). ARBOOK: Development and Assessment of a Tool Based on Augmented Reality for Anatomy. Journal of Science Education and Technology, 24(1), 119–124.
https://doi.org/10.1007/s10956-014-9526-4
Howard, S. K., Chan, A., & Caputi, P. (2015). More than beliefs: Subject areas and teachers’
integration of laptops in secondary teaching. British Journal of Educational Technology,
46(2), 360–369.
https://doi.org/10.1111/bjet.12139
Huang, D., Tory, M., Adriel Aseniero, B., Bartram, L., Bateman, S., Carpendale, S., …
Woodbury, R. (2015). Personal visualization and personal visual analytics. IEEE Transactions on Visualization and Computer Graphics, 21(3), 420–433.
https://doi.org/10.1109/TVCG.2014.2359887
Johri, A., Teo, H. J., Lo, J., Dufour, M., & Schram, A. (2014). Millennial engineers: Digital media and information ecology of engineering students. Computers in Human Behavior, 33, 286–301.
https://doi.org/10.1016/j.chb.2013.01.048
Kandel, S., Paepcke, A., Hellerstein, J. M., & Heer, J. (2012). Enterprise Data Analysis and Visualization : An Interview Study. IEEE Transactions on Visualization and Computer Graphics, 18(12), 2917–2926.
Kim, C., Kyu, M., Lee, C., Spector, J. M., & Demeester, K. (2013). Teacher beliefs and technology integration. Teaching and Teacher Education, 29, 76–85.
https://doi.org/10.1016/j.tate.2012.08.005
Mara Cotic, S. M., Zuljan, M. V., & Simcic, B. (2005). Geometrical Problems and The Use of Geoboard. In M. V. Zuljan & J. Vogrinc (Eds.), Facilitating Effective Student Learning through Teacher Research and Innovation (Vol. 72, pp. 3–22).
https://doi.org/10.1016/B978-0-444-53858-1.00028-4
Martín-Gutiérrez, J. (2017). Virtual Technologies Trends in Education. EURASIA Journal of Mathematics, Science and Technology Education, 13(1), 469–486.
https://doi.org/10.12973/eurasia.2017.00626a
Michigan State University. (2014). Planning to Teach a Problem. Retrieved December 2017, from Connected Mathematics Project:
https://connectedmath.msu.edu/teacher-support/support-for-teaching/planning-to-teach-a-problem/
41
Nardi, B., & O’Day, V. (2000). Information Ecologies. Information Ecologies: Using Technology With Heart (Vol. 16). The MIT Press.
https://doi.org/10.1080/01972240050133706
National Center for Education Statistics. (2016, September). Bachelor's degrees conferred by postsecondary institutions, by field of study: Selected years, 1970-71 through 2014-15. Retrieved December 2017, from Digest of Education Statistics:
https://nces.ed.gov/programs/digest/d16/tables/dt16_322.10.asp?current=yes
Nguyen, D. Q., & Le, D. D. (2016). Hyper Word Clouds: A Visualization Technique for Last.Fm Data and Relationships Examination. Proceedings of the 10th International Conference on Ubiquitous Information Management and Communication, 66:1--66:7.
https://doi.org/10.1145/2857546.2857613
Obiefuna, C. A., & Offorma, G. C. (2014). Pre-service Teachers’ Perception of using Mobile
Devices in Teaching Climate Change in Primary Schools. International Journal on Integrating Technology in Education, 3(2), 39–50.
https://doi.org/10.5121/ijite.2014.3205
Office of Institutional Research & Assessment. (2017, October 19). UNC- Chapel Hill Undergraduate Majors Report. Retrieved December 2017, from Analytic Reports: https://oira.unc.edu/reports/
Quora. (2012, Feburary). Do you prefer to do math on a whiteboard or a chalkboard? Why?
Retrieved December 2017, from Quora: https://www.quora.com/Do-you-prefer-to-do-math-on-a-whiteboard-or-a-chalkboard-Why
Quora. (2014). Why do most math professors prefer giving lectures using blackboards rather than whiteboards or projectors? Retrieved 2017, from Quora:
https://www.quora.com/Why-do-most-math-professors-prefer-giving-lectures-using-blackboards-rather-than-whiteboards-or-projectors
Robinson, R., Molenda, M., & Rezabek, L. (1963). Facilitating Learning. In Association for Educational Communications and Technology.
Schedl, M., & Markus. (2017). Intelligent User Interfaces for Social Music Discovery and
Exploration of Large-scale Music Repositories. Proceedings of the 2017 ACM Workshop on Theory-Informed User Modeling for Tailoring and Personalizing Interfaces -
HUMANIZE ’17, 7–11.
https://doi.org/10.1145/3039677.3039678
Vandercruysse, S., Elen, J., & Oostendorp, H. van. (2015). When a game supports prevocational math education but integrated reflection does not:Learning math with games. Journal of Computer Assisted Learning, 31(5), 462–480.
42
Zengin, Y., Furkan, H., & Kutluca, T. (2012). The effect of dynamic mathematics software geogebra on student achievement in teaching of trigonometry. Procedia - Social and Behavioral Sciences, 31(2011), 183–187.