ECONOMIC IMPACTS OF THE DEEPWATER HORIZON OIL SPILL ON GULF FISHERIES
By
Savannah Swinea
Senior Honors Thesis
Environment, Ecology, and Energy Program University of North Carolina at Chapel Hill
April 26, 2019
Approved:
ABSTRACT
The Deepwater Horizon spill in 2010 dispersed oil in huge quantities within the Gulf of Mexico larger marine ecosystem, and was expected to disturb marine organisms substantially over annual-to-decadal scales. The oil spill was projected to cost Gulf fisheries $2-5 billion dollars in total revenue from 2010 to 2017 (Sumaila et al., 2012). This study uses a retrospective approach and presents the actual deviation in total and per capita revenues from pre-spill
1. INTRODUCTION
1.1 Marine ecosystems and their response to disturbance
Marine ecosystems contribute goods and services that are necessary to the maintenance of humankind. These goods and services include biogeochemical cycling of natural and anthropogenic materials, support of recreation, tourism, and fishing industries, protection from storms, and cultural significance for coastal communities (Mayer et al., 2012). Disturbances can impact the production of ecosystem services by degrading habitat and decreasing biodiversity, which reduces that ecosystem’s resilience to future change. Oil spills act as anthropogenic pulse disturbances that have the capacity to significantly disrupt the ecosystem services that coastal habitats provide (Peterson and Lubchenco, 1997).
1.1 Timeline/description of the Deepwater Horizon oil spill
The Deepwater Horizon drilling rig was located approximately forty miles off the coast of Louisiana in the Gulf of Mexico (GOM). On April 20, 2010, highly pressurized methane gas shot up the rig and ignited. The drilling rig sank into the ocean the next day, and on April 22nd an oil slick began to appear at the ocean surface, indicating a leak at the wellhead. In the 84 days that were required to successfully close the leak, over 200 million gallons of oil were discharged into the Gulf. Shortly after the spill was discovered, the National Oceanographic and
Atmospheric Administration (NOAA) and state agencies in the Gulf of Mexico began to close impacted areas to fishing. At the largest extent, 37% of the area of the Gulf of Mexico was closed to fishing, and the entirety of the Gulf would not be open to fishing again until a year later (Upton, 2011).
The Deepwater Horizon oil spill had the potential to impact marine organisms in multiple habitats as oil was transported to shorelines on the ocean surface, finely dispersed within the water column, and retained as a plume at depth. Because of this projected widespread exposure to oil, the long-term impacts of the novel circumstances this spill created were highly uncertain (Peterson et al., 2012). Historically, the impacts of oil on individual organisms are well
understood to be negative. Degraded forms of oil known as polycyclic aromatic hydrocarbons (PAHs) hurt individual organisms, no matter their taxonomy or the space in the environment they occupy. Chronic exposure to PAHs, even in small doses, can create sublethal effects such as decreased fecundity and genetic deformities (Peterson et al., 2003). Exposure to PAHs in concentrations realistic to what was seen in ocean water in the Gulf of Mexico has been shown to negatively impact the cardiac function of pelagic fish (Incardona et al., 2014). In other studies, Gulf killifish experienced immune and endocrine disruption, damage to gill tissues, and
expressed genes that contribute to embryo abnormality (Whitehead et al., 2012). When fish are impacted by oil spills, it often follows that fisheries may also be affected, and these effects can make themselves known as gains or losses in productivity in revenue in these fisheries.
1.3 Economic responses to environmental disasters
replacement of destroyed capital or lost durable goods is reported as economic growth (Skidmore and Toya, 2002). The “build back better” hypothesis is characterized by short-term economic losses and long-term economic growth because destruction makes way for innovation, or lost capital and goods are replaced with more advanced technology that may not have been implemented unless the disaster occurred (Cuaresma et al., 2008). The “recovery to trend” hypothesis involves economic losses shortly after a disaster, but gross domestic product returns to pre-disaster levels through an influx of capital and people to the disaster zone, and potentially through application of international aid (Strobl, 2011). In the “no recovery” hypothesis, short- and long-term economic losses stem from investment in capital and durable goods destroyed in the disaster that would have been used for other productive investments (Field et al., 2012). These hypotheses all represent potential pathways that fisheries in the Gulf of Mexico could have followed in response to the Deepwater Horizon oil spill.
Sumaila and colleagues asserted in a study published in 2012 that based on preliminary projections, losses in total revenues to the fishery sectors in the Gulf of Mexico from 2010 to 2017 would amount to $2-5 billion, with losses of $0.5-2.7 billion in the commercial fishing industry, $1.4-2.4 billion in the recreational fishing industry, and $94-157 million in the
mariculture industry. These estimates are based on landings lost in waters closed to fishing and longer-term impacts on market recovery times in these fisheries. In this study, a retrospective approach is used to determine how revenue in fisheries in the Gulf of Mexico actually deviated from pre-oil spill trajectories, and juxtapose these finding with the preliminary estimates made by Sumaila and colleagues in 2012. Qualitative comparisons are also made in the trends observed in these fishing sectors to the hypotheses of economic response to environmental disasters compiled in Hsiang and Jina, 2014.
2. METHODS
The Gulf of Mexico is the most productive water body in the United States, and fishing exploits a small but integral part of that productivity (Yoskowitz, 2009). Harvest of finfish and shellfish in the GOM makes up 16% of the total revenue generated from landings of fish in the United States (Posadas, 2018). The Gulf of Mexico fishing industry is comprised of the
commercial, recreational, and mariculture fishing industries, and the commercial fishing industry is the most productive fishing industry with the recreational and mariculture industries
contributing to productivity in the Gulf to a lesser extent.
industry. Per capita revenues in these fishing industries were not able to be compared to Sumaila and colleagues’ projections because Sumaila and colleagues did not predict per capita losses in each of the industries, but per capita revenues were utilized in this study as a supplemental form of analysis to begin to examine potential mechanisms to explain the trends observed besides the impacts of the oil spill.
2.1 Commercial fishing
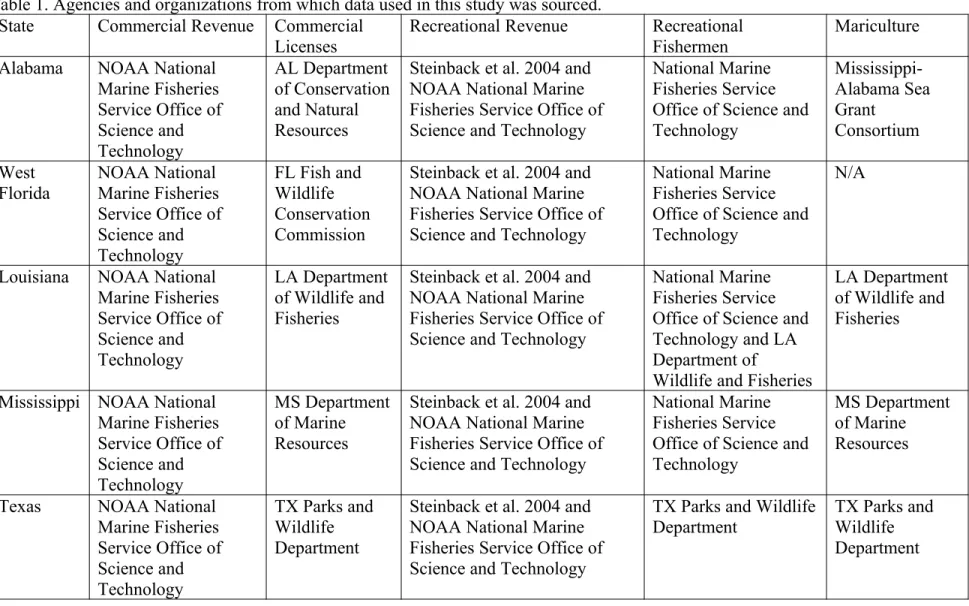
Commercial fishing refers to the practice of catching fish and selling them for profit and livelihood. Total commercial revenue is represented as the total dockside value of commercially caught fish annually, and per capita revenue is calculated using this total revenue and the number of commercial licenses issued annually. Commercial landings revenue data for each of the Gulf states from 2000 to 2016 was sourced from the online query tool for annual commercial landings available through NOAA’s National Marine Fisheries Service (NMFS)
(https://www.st.nmfs .noaa.gov/commercial-fisheries/commercial-landings/annual-landings/ index ) . Data concerning commercial licenses issued over time was sourced from individual
states’ Departments of Conservation and Natural Resources or Divisions of Marine Fisheries (Table 1).
2.2 Recreational fishing
Recreational fishing encompasses the practice of fishing for leisure, and does not
guided, or chartered fishing boats and guides. Total impact expenditures in 1999 for each of the states in the Gulf of Mexico were taken from Steinback et al. 2004, and total impact expenditures from 2006 to 2012 were sourced from the Recreational Expenditures query available through NOAA Fisheries (https://www.st.nmfs.noaa.gov/economics/fisheries/recreational/angler-expenditures-economic-impacts/index ) (Table 1). Because this dataset did not contain total
impact expenditures for the full timeframe of interest, missing data points were estimated by incorporating the number of fish caught recreationally each year. Using total impact
expenditures and the number of fish caught, the value of each fish caught recreationally was calculated for 1999 and from 2006 to 2012. A trendline was fit to these data to estimate the value of each fish caught recreationally from 2000 to 2014. These values were then multiplied by the number of fish caught recreationally to achieve actual and predicted total impact
Table 1. Agencies and organizations from which data used in this study was sourced. State Commercial Revenue Commercial
Licenses
Recreational Revenue Recreational Fishermen
Mariculture Alabama NOAA National
Marine Fisheries Service Office of Science and Technology AL Department of Conservation and Natural Resources
Steinback et al. 2004 and NOAA National Marine Fisheries Service Office of Science and Technology
National Marine Fisheries Service Office of Science and Technology Mississippi-Alabama Sea Grant Consortium West
Florida NOAA National Marine Fisheries Service Office of Science and Technology
FL Fish and Wildlife Conservation Commission
Steinback et al. 2004 and NOAA National Marine Fisheries Service Office of Science and Technology
National Marine Fisheries Service Office of Science and Technology
N/A
Louisiana NOAA National Marine Fisheries Service Office of Science and Technology
LA Department of Wildlife and Fisheries
Steinback et al. 2004 and NOAA National Marine Fisheries Service Office of Science and Technology
National Marine Fisheries Service Office of Science and Technology and LA Department of
Wildlife and Fisheries
LA Department of Wildlife and Fisheries
Mississippi NOAA National Marine Fisheries Service Office of Science and Technology
MS Department of Marine Resources
Steinback et al. 2004 and NOAA National Marine Fisheries Service Office of Science and Technology
National Marine Fisheries Service Office of Science and Technology
MS Department of Marine Resources
Texas NOAA National Marine Fisheries Service Office of Science and Technology
TX Parks and Wildlife Department
Steinback et al. 2004 and NOAA National Marine Fisheries Service Office of Science and Technology
TX Parks and Wildlife Department
2.3 Mariculture
Mariculture, or marine aquaculture, refers to the cultivation and farming of fish in the ocean for food and other products. Shellfish- particularly eastern oysters, Crassostrea virginica- makes up the largest portion of the Gulf of Mexico mariculture industry. Mariculture data was obtained for Alabama, Louisiana, Mississippi, and Texas through their individual Departments of Conservation and Natural Resources or Divisions of Marine Fisheries (Table 1). At the time of this study, Alabama was only able to report mariculture oyster production for 2016 and 2017 and West Florida did not have any mariculture oyster production data available, and thus Alabama and West Florida were not included in the mariculture analysis in this study. Oyster mariculture production was reported for Louisiana as the number of mariculture leases issued and acreage available through each of those leases, for Mississippi as the sacks of oysters harvested, and for Texas as the dockside value of oysters harvested.
2.4 Analysis of deviations from pre-spill trajectories
methodology, but there were slight differences in the analysis of each distinct sector. Commercial revenue in 2000 and 2001 was substantially higher than in subsequent years. When a trajectory was fit to the pre-spill data starting in 2000, the trajectory line appeared to be skewed in such a way that the deviation in total and per capita commercial revenue was being
overestimated. Therefore, trajectories were fit to pre-spill data starting in both 2000 and 2002 to achieve a conservative and more extreme estimate. The trajectory for recreational revenue did not appear to be affected by early data points in the same way as commercial revenue, and therefore only one trajectory beginning in 2000 was utilized. This trajectory analysis was only applied to the sacks of oysters harvested from mariculture in Mississippi, and was not applied to the oyster production data reported for Louisiana or Texas.
2.5 Statistical analysis
To determine which patterns of deviations of post-spill revenue data points from the pre-spill trajectories were statistically significant, a non-parametric test of two paired samples was used to estimate the likelihood of data points falling above or below the trajectory line, and was able to assign significance if enough data points were observed to be located in the same position relative to the trajectory line (Hampton, 1994). The equation used in this test is as follows:
p(x)= k ! x !(k−x)! p
x
qk−x
3. RESULTS
3.1 Commercial fishing
meaning that total commercial revenue was higher than would have been expected by the pre spill trajectory. The deviation in per capita commercial revenue from the pre-spill trajectory was also positive, and amounted to $5,233-12,971 per commercial license holder (Fig. 3). Every year from 2010 to 2016, each commercial license holder brought in $872-2,161 more than would have been expected from the pre-spill trajectory.
Each state in the Gulf of Mexico was analyzed individually to determine if commercial fishing may have been impacted differentially following the spill. When analyzed by state, total and per capita commercial revenues follow similar trends to those exhibited in the Gulf-wide analysis; total and per capita commercial revenue by state generally fall above what was projected by the pre-spill trajectories (Tables 2 and 3). All statistically significant deviation values were positive using the non-parametric test for two paired samples.
3.2 Recreational fishing
Total recreational revenue in the Gulf of Mexico was $14.3 million less than would have been expected by the pre-spill trajectory from 2010 to 2014 (Fig. 4). The deviation in per capita recreational revenue from the pre-spill trajectory was -$1.75, or each recreational fisherman was contributing $1.75 less to the recreational fishing industry – based on the number of fish they landed - in the four-year period following the spill (Fig. 5). Every year from 2010 to 2013, each recreational fishing participant spent $0.44 less in the recreational fishing industry than would have been expected by the pre-spill trajectory due to the change in their catch of recreationally targeted fishes.
is consistent with the result of the Gulf-wide analysis (Tables 2 and 3). All statistically significant deviation values were negative using the non-parametric test for two paired samples. 3.3 Mariculture
Trends in the number of leases issued for mariculture and the total acreage used for mariculture in Louisiana were not noticeably different in comparing pre- and post-spill values. Similarly, the dockside value of oysters harvested in Texas was not significantly different before and after the oil spill occurred. However, the deviation in the number of sacks of oysters
harvested in Mississippi was almost 800,000 sacks less than what was expected by the pre-spill trajectory, with 1 sack equaling 1.5 bushels. In other words, oyster production every year was over 100,000 sacks less than expected (Fig. 6).
Figure 3. Per capita commercial revenue in the Gulf of Mexico. Blue data points denote pre-spill per capita commercial revenue, and orange data points denote post-pre-spill per capita
commercial revenue. Post-spill trajectories, both conservative (gray) and more extreme (blue) are displayed.
Figure 5. Per capita recreational revenue generated from total impact expenditures in the Gulf of Mexico. Blue data points denote pre-spill per capita recreational revenue, and orange data points denote post-spill per capita recreational revenue. The pre-spill trajectory (blue) is displayed.
Figure 6. The number of sacks harvested in the mariculture industry in Mississippi. Blue data points denote the pre-spill sacks of oysters harvested, and orange data points denote post-spill sacks of oysters harvested. The pre-spill trajectory (blue) is displayed.
State Deviation in Commercial Revenue from 2000 and 2002 Projections (Millions of Dollars)
Deviation in Recreational Revenue from 2000 Projection (Millions of Dollars)
Alabama 13-102 -0.25
West Florida 406-409 -9.05
Louisiana 486-1,007 -7.55
Mississippi 65-114 -2.26
Texas 324-701 0.43
Total for Gulf 1,293-2,334 -18.68
Table 3. Deviation in per capita commercial and recreational revenues from the pre-spill trajectories on a state-by-state basis. Values in bold are statistically significant using a non-parametric test of two paired samples.
State Deviation in Commercial
Revenue Per Capita from 2000 and 2002 Projections (Dollars)
Deviation in Recreational Revenue Per Capita from 200 Projection (Dollars)
Alabama -14,209-12,377 -0.30
West Florida 13,480-16,646 -3.33
Louisiana 1,571-7,101 0.15
Mississippi N/A -13.28
Texas 62,700 7.50
Average for Gulf 9,025-24,095 -2.88
4. DISCUSSION
The mechanism behind this maintenance or increase in commercial revenue from what was projected has not yet been determined. A potential explanation for this observed trend besides impacts from the oil spill is that a species or group of species may have been harvested to a greater extent than before or harvest of that species may not have been occurring before the spill. This would create the appearance of revenue exceeding pre-spill expectations, but could be attributed solely to the fishing industry beginning to catch a previously untapped resource. The commercial revenues generated by the top five most profitable species in the Gulf were
evidence that suggests that members of coastal communities in these Gulf states may have received access to settlement money. Some commercial fishermen were paid as cleanup workers, and there was evidence of purchase of vehicles sharply increasing shortly after these payouts occurred. However, there is no comprehensive source that indicated how the settlement money may have been distributed, or to whom it was allocated (Barker 2011). Lastly, potential social consequences to fishermen of the spill have not yet been explored, and these could represent costs associated with the oil spill that were not considered in this study because they are not reported in terms of monetary value in the industry.
received any compensation concerning the damages from the Deepwater Horizon oil spill from those companies responsible. Researchers have estimated that recreational fishermen deserve compensation on the order of half a billion dollars from the spill; this lack of compensation could have contributed to the decrease in revenue from what was projected in this industry (Alvarez et al. 2014).
Because mariculture data was not available for all of the Gulf states and in the states for which the data was available oyster production was reported in different metrics, a Gulf-wide analysis of the trajectory of revenue from mariculture was not possible. In addition, an accurate comparison to Sumaila and colleagues’ projection cannot be made given the limited analysis of the mariculture industry as a whole that was possible in this study. The extent to which the mariculture industry may have been impacted is more uncertain than what was observed in the commercial and recreational fishing industries because of the limitations on data availability. Therefore, it is unclear which hypothesis concerning economic responses to natural disasters best characterizes the mariculture industry in the Gulf of Mexico.
A limitation of this study was that economic multipliers were not considered in the analysis, and therefore a full analysis of how the fishing economy was affected outside of fishery revenue was not accomplished. Even within the Gulf fishing sectors, the numbers of employees in fisheries (including the number of commercial fishermen and the number of recreational fishing guides and other employees involved in that fishing sector) and income allocated to those employees have not yet been examined in relation to the oil spill. In addition, this means that not all of the predictions made by Sumaila and colleagues were able to be compared to real trends. It is certainly possible that the fishing industry outside of the fisheries themselves may have
although these types of conjectures are outside the scope of this study, they are worth investigating as well. Potential avenues of exploration include how the seafood industry was impacted and how the public’s perception of seafood and fishing safety was altered post-spill with an incorporation of these findings into the retrospective analysis of economic impacts of the Deepwater Horizon oil spill.
CONCLUSION
It is very difficult to infer based on the data presented in this study if there was a negative effect of the Deepwater Horizon oil spill on Gulf fisheries. Further exploration and analysis of factors connected to fishery success or failure would be necessary to make stronger conclusions about the impacts of the spill on the different fishing sectors. Although there is a substantial body of research that indicates that when exposed to oil, individual marine organisms suffer, the results of studies concerning the effects of oil on populations or communities of organisms do not reflect the ubiquitous harm that is observed in individuals. The possible explanations behind this discrepancy in Gulf fishes after the Deepwater Horizon oil spill include releases in fishing pressure during fishery closures, positive responses of prey resources (like microorganisms) to the oil, negative responses of fish predators to oil, increases in reproductive capacity of the remaining adult fish populations to compensate for potential losses, and the migratory abilities of fish when presented with unfavorable conditions (Fodrie et al., 2014). All of these mechanisms are supported by bodies of scientific literature, and thus it is possible that it is not one mechanism but multiple that create the impression that fish populations are not affected by oil spills as would be expected from individual impacts.
natural disasters like oil spills. It can be problematic to assume that fishery success or decline has any implications for the health or degradation of fish populations in the environment. Changes in catch, and therefore revenue, can sometimes be attributed to changes in effort as opposed to changes in the biomass of fish (Mutsert et al., 2008).
REFERENCES
Alvarez, S., S. Larkin, J.C. Whitehead, and T. Haab. 2014. A revealed preference approach to valuing non-market recreational fishing losses from the Deepwater Horizon oil spill. Journal of Environmental Management 145: 199-209.
Barker, B. 2011. ‘Spillionares’ are the new rich after BP oil spill payouts. The Washington Post. <https://www.washingtonpost.com/national/spillionaires-are-the-new-rich-after-bp-oil-spill-payouts/2011/04/11/AFjaqsWD_story.html?utm_term=.4bcc832ddc89>.
Buck, B. 2014. Gulf anglers could be entitled to $585 million after the Deepwater Horizon oil spill, UF/IFAS study says. University of Florida.
<http://news.ufl.edu/archive/2014/09/gulf-anglers-could-be-entitled-to-585-million-after-the-deepwater-horizon-oil-spill-ufifas-study-says-.html>.
Buckley, R. 1991. National audit of environmental impact predictions. Pages 93-119 in R. Buckley, editor. Perspectives in Environmental Management. Springer-Verlag, Berlin, Germany.
Cuaresma, J.C., J. Hlouskova, and M. Obsersteiner. 2008. Natural disasters as creative destruction? Evidence from developing countries. Economic Inquiry 46(2): 214-226. Field, C.B., V. Barros, T.F. Stocker, Q. Dahe, D.J. Dokken, K.L. Ebi, M.D. Mastrandrea, K.J.
Mach, G. Plattner, S.K. Allen, M. Tignor, and P.M. Midgley, editors. 2012. Managing the risks of extreme events and disasters to advance climate change adaptation: special report of the Intergovernmental Panel on Climate Change. Cambridge University Press, New York, New York, USA.
Fodrie, F.J., K.W. Able, F. Galvez, K.L. Heck Jr., O.P. Jensen, P.C. Lopez-Duarte, C.W. Martin, R.E. Turner, and A. Whitehead. 2014. Integrating organismal and population responses of estuarine fishes in Macondo spill research. BioScience 64:778-788.
Hampton, R.E. (1994). Introductory biological statistics. Dubuque, Iowa: Wm. C. Brown Publishers.
Incardona, J.P., L.D. Gardner, T.L Linbo, T.L. Brown, A.L. Esbaugh, E.M. Mager, J.D. Stieglitz, B.L. French, J.S. Labenia, C.A. Laetz, M. Tagal, C.A. Sloan, A. Elizur, D.D. Benetti, M. Grosell, B.A. Block, and N.L. Scholz. 2014. Deepwater Horizon crude oil impacts the developing hearts of large predatory pelagic fish. Proceedings of the National Academy of Sciences 111(15): 1510-1518.
McCrea-Strub, A., K. Kleisner, U.R. Sumaila, W. Swartz, R. Watson, D. Zeller, and D. Pauly. 2011. Potential impact of the Deepwater Horizon oil spill on commercial fisheries in the Gulf of Mexico. Fisheries 36(7): 332-336.
Mutsert, K., J.H. Cowan, Jr., T.E. Essington, and R. Hilborn. 2008. Landings can be misleading in assessments of fisheries and fisheries ecosystems. Proceedings of the National
Academy of Sciences 105(7): 2740-2744.
National Marine Fisheries Service. 2014. Angler Expenditures and Economic Impact
Assessments. <https://www.st.nmfs.noaa.gov/economics/fisheries/recreational/angler-expenditures-economic-impacts/index>. Downloaded on 1 November 2018.
National Marine Fisheries Service. 2016. Annual Commercial Landings Statistics. < https://www.st.nmfs.noaa.gov/commercial-fisheries/commercial-landings/annual-landings/index>. Downloaded on 7 October 2018.
National Marine Fisheries Service. 2017. Fisheries of the United States, 2016. U.S. Department of Commerce, NOAA Current Fishery Statistics. No. 16. Silver Spring, M.D., U.S.A.
National Marine Fisheries Service. 2015. Fisheries Economics of the United States 2013. U.S. Department of Commerce, NOAA Current Fishery Statistics. Memo. NMFS-F/SPO-159. Silver Spring, M.D., U.S.A.
National Marine Fisheries Service. 2018. Recreational Fisheries Statistics Queries. <
https://www.st.nmfs.noaa.gov/st1/recreational/queries/>. Downloaded on 10 October 2018.
Peterson, C.H. and J. Lubchenco. 1997. Marine ecosystem services. Pages 177-194 in G.C. Daily, editor. Nature’s services: societal dependence on natural ecosystems. Island Press, Washington, DC, USA.
Peterson, C.H., S.D. Rice, J.W. Short, D. Esler, J.L. Bodkin, B.E. Ballachey, and D.B Irons. 2003. Long-term ecosystem response to the Exxon Valdez oil spill. Science 302: 2082-2086.
Peterson, C.H., S.S. Anderson, G.N. Cherr, R.F. Ambrose, S. Anghera, S. Bay, M. Blum, R. Condon, T.A. Dean, M. Graham, M. Guzy, S. Hampton, S. Joye, J. Lambrinos, B. Mate, D. Meffert, S.P. Powers, P. Somasundaran, R.B. Spies, C.M. Taylor, R. Tjeerdema, and E.E. Adams. 2012. A tale of two spills: novel science and policy implications of an emerging new oil spill model. BioScience 62:461-469.
http://masgc.org/news/article/know-more-Skidmore, M. and H. Toya. 2002. Do disasters promote long-run growth? Economic Inquiry 40(4): 664-687.
Steinback. S., B. Centner, and J. Castle. 2004. The economic importance of marine angler expenditures in the United States. NOAA Prof. Paper NMFS. No. 2. Seattle, W.A., U.S.A.
Strobl, E. 2011. The economic growth impact of hurricanes: evidence from U.S. coastal counties. The Review of Economics and Statistics 93(2): 575-589.
Sumaila, U.R., A.M. Cisneros-Montemayor, A. Dyck, L. Huang, W. Cheung, J. Jacquet, K. Kleisner, V. Lam, A. McCrea-Strub, W. Swartz, R. Watson, D. Zeller, and D. Pauly. 2012. Impact of the Deepwater Horizon well blowout on the economics of US Gulf fisheries. Canadian Journal of Fisheries and Aquatic Sciences 69:499-510.
Whitehead A, B. Dubansky, C. Bodinier, T.I. Garcia, S. Miles, C. Pilley, V. Raghunathan, J.L. Roach, N. Walker, R.B. Walter, C.D. Rice, F. Galvez. 2012. Genomic and physiological footprint of the Deepwater Horizon oil spill on resident marsh fishes. Proceedings of the National Academy of Sciences 109(50): 20298–20302.