Forging
Ahead
and
Lagging
Behind:
An
Analysis of
Convergence
and
Economic
Development
in
North
Carolina
Abstract
This
paper
analyzes trends ineconomic
development in North Carolina to determinewhether
there has been evidence
of per
capitaincome
convergence in the state during theperiod 1970-2000.The
analyses reveal that (a) there hasbeen
a processof convergence
ofper
capita income in the state in thepast three decades,and
(b) income convergence inNC
occurredduringa
period
of economic
expansion
and
divergence during
economic
decline.However,
acomparative analysis
of
metroand
non-metro counties as well asamong
traditional geographic areas indicates that therewas
a general trendof
divergence in metro areasand
convergence innon-metro areas. This trend suggests that there arepockets ofaffluence
and
pockets of poverty existingside by side in the state. The regression analyses reveal that while the initial levelofper
capita income,
human
resource developmentand
population growthhad
a significant impact onincome
growth, the impactof
urbanizationand
investment in infrastructurewas
weak.The
analysis on
economic
structureshows
thatemployment
in manufacturinghad
a major impact butemployment
in agricultureand
services did not.Mulatu
Wubneh
Introduction
Has
there been a narrowing of disparity inincome betweenresidentsof metro and non-metro counties as well as
among
thetraditionalgeographic regions-
Mountain, Piedmont andCoastal areas-
ofthe state in the last few decades? In otherwords, areregional economies inNorthCarolina
(
NC
)convergingor diverging?These
are questions thathave
receivedsurprisingly little attention from academics and policy makers in the state. Duringthe last thirty
years,NorthCarolinapolicymakershaveinitiated
a
number
ofprograms to redress imbalance ofgrowth in thestate, includingthe Rural Initiative
Program, the
Community
Partnership Program, and the BalancedGrowth
Policy.To
date, no evaluation has been conducted to determine the impact of these programs have had in reducing regionalincome
disparitiesinthestate.The
concept of convergence, that is, the tendency for income differences to narrow overtime, is important because it can inform policy
makers ofthe need for development policies to
promote
equityand
growth. If regions areconverging
over time,economic
disparitiesbetweenregions
may
diminishnaturally.On
the other hand, anabsence
ofconvergence,
or convergence at a very slow pace, suggests the needforproactivepoliciestopromote growthand reduceincomeinequalities.Mulatu
Wubneh
is Chairand
Professorof
theDepartment
ofPlanning, College of Technologyand
Computer
Science
at EastCarolina
The
Piedmontarea traditionallyhasenjoyeda higher per capitaincome
(PINC)
than theMountain
or Coastal regions.The
substantialinvestment in infrastructure and education has
spawned
a thrivingeconomy
inthePiedmontarea,whilethe coastalandmountainareashavelagged behind. In the last three decades, the state has
tried to stimulate growth in the lagging western
andeasternregionsbyinvestingininfrastructure, education and health care, but it has achieved
limitedsuccessinreducing long-standingregional disparities in the state. For instance, in 1970, average real per capita income in the Piedmont area
was
about 1 11 percent ofthe state average,while in the coastal areas it
was
87 percent.By
2000, the
PINC
for the coastal area further declined to85 percent ofthestate average, while the average for thePiedmont
arearemained
relativelystable.
Intermsofpopulation growth,NorthCarolina ranks6"' inthe nation.
The
statepopulationgrew
by21.4percentbetween 1
990
and2000.A
lookat the population growth between the metro and
non-metro
countiesshows
thatmany
of thecountiesthat lost population in the lastcensus or those that lagged in population growth arc non-metro counties. According to the
2000
Census,18ofthe29counties (69 percent)thatexperienced
agrowth rate
below
halfthestateaverage of21.4percentbetween 1
990
and2000
arc inthe coastalareas (secFigure 1).
North Carolina has
made
a major stride inreducingthepovertyrateinthestate.
The
povertyrate has dropped fromanaverage of20.3 percent in 1970to 12.3 percent in2000.
The
povertyrateissignificantlyhigherinthenon-metroareasthan inthemetroareas.
The
easternregionofthestatefeatures the highest rates of poverty (Figure 2).
The
data for2000
show
that fouroutoffiveofthe counties that havea poverty rate above the stateaverage are non-metro.
A
full 57 percent of these counties arc located in the Coastal area.Highpovertyratesinthenon-metroareasand theincreasingdevelopment gap betweenthemetro
and
non-metro
countiesmay
have
serious
•:;-!
~
=
Lu£H3Sfe
PopulationChange Pet1990-2000 ~J-3.0-0.0%
~J0.1 - 11.7%
3 11.8-21.4%
2
21.5-33.1%1H
33.2-50%
repercussions
upon
the social,economic and
political fabric
of
the state.A
number
ofcommunity
leaders, particularly thosefrom
countiesthat lostpopulationinthelastcensus, are
wondering
whethereconomic development
inNorth Carolinaisconvergingor diverging. Hence, the questions regarding
economic
development trendsinthestateaswellasamong
thetraditionalgeographicareas arc quite appropriate.
The
objective of this study is to analyze economic developmentinthestateandtodetermine ifthere has been evidence ofpercapita income convergence during the period 1970-2000.The
study also seeks to identify factors that account
for differences in income change by examining trends in
population
growth,
urbanization, infrastructure investment,human
resourcedevelopment
andemployment
structure.The
analysisemploystheeconomicconvergencemodel
(Box
1).Regional Disparity in
North
CarolinaRegional
economic convergence
analysisamong
NorthCarolina countieswillbeconductedat threelevels. First,regional
income
difference overtheperiod 1970
to2000
willbeexamined
bycomparingincometrendsbetween metro and non-metrocounties. Thisanalysisshould provideinsight intothelong-term trend in
income
growthamong
the counties resulting
from
a processof
urbanization. Urbanization,
which
is agood
measure ofthe relativeconcentrationofeconomic
activities, is often associated with large growth
potential.
The
classification between metro andnon-metro
counties isbased
on
population.According tothe Census Bureau, in 1999 North Carolina had 35 counties classified as metro counties(AppendixA).
The
second approach will analyzeincome
growth
among
the threemajor geographicregions ofthe state. Geographically, NorthCarolina canYear2000PovertyPet
| 17
- 1
0%
J 10.1 -12.3% j 12.4-15% J 15.1
-20%
~]20.1 -
24%
Poverty Pet Mountain Piedmont Coastal
7-10% 2 13 1
10.1 -12.3% 7 10 3
124%-15% 5 7 10 151 -20% 9 4 15
201 •24% 1 1 12
Total 24 35 41
Box 1: RegionalEconomic Convergence Model-
The
Debateand MeasuresThe question of whethereconomies exhibit convergence, that is, atendency ofincome differences to narrowovertime,hasbeenafocusof
many
studies for severaldecades.Theproblemhasbeenexaminedattheglobal andnational levelsandvariousexplanationsha\ebeenofferedonwhich factorscauseconvergenceor
divergence inincome
among
regions.No
consensusseemstohaveemergedontheexplanations. Despitethedivergence in views, thetheory on regional economic convergence can be broadly divided into two major streams ofthought.
The first relates to advocates ofthe convergence theory. Based on traditional neoclassical theory of economicgrowth, advocatesoftheconvergencetheory arguethatbecauseoffactormobilityand problemsof
diminishingreturnsto capital,regionaldifferencesinincomewilldecline overtime. Thetendencyfor disparities todeclineover timeisassociated withfactorcostsbeinglower andprofitopportunitiesbeing higherinpoorer regions thaninricherones.
A
relatedargumentisthatpoorer regionshavelowratiosofcapitalto labor,henceahighermarginalproductofcapital. This implies thatcapitalwould flow from richerto poorerareas. The expected outcomeisthatpoorer regionswill growfasterthanricherregions, resulting intheequalizationot
income betweenricherandpoorerregions. Trade andfreeflowoffactors will alsofacilitatetheequalizationot
factor prices betweenthepoorerandricherregions
Thesecond,whichadvocatestheviews ofthe divergencetheory, maintainsthatbecause of problemsot
cumulative causation,economic developmentoccurring in aleading region goesthrough a processof
self-sustainingand self-reinforcingwhich leadstodivergenceingrowth
among
regions. Theleadingregionthattakesadvantage of agglomerationeconomies and technology andinnovationbenefitswillgrowfasterthanthe
laggingregions. Advocates ofthedivergence theoryalsoarguethatfactormobility, for instance labor mobility,
may
beimpeded byhighcostofliving,infrastructureproblems, or inadequateinstitutionalstructureand poor managerialskills.Another important factor associated with regional convergence is related to the economic structure ot regions, specificallytothe characteristicsofindustriesintheregion. Forinstance,arelativelyhigher shareot
agriculture
may
beproblematicforaregionalgrowthpotentialsinceprospectsforgrowthinagriculturedemandhave beenlimitedinthelastfewdecades.
On
theotherhand,arelativelyhigher shareofservicesinemploymentcanbeinterpreted asanindicationofamore dynamicanddiversifiedregionaleconomy. Therefore,onecould
hypothesize that the relationship between per capita income growth and employment share in agriculture
wouldbe negativewhereastherelationshipbetweenpercapitaincome andtheshareofemploymentinservices
wouldbepositive. Ifthehypothesizedrelationships arevalid, thenthegrowthreducingeffectsofagriculture are strongerthan itsgrowth inducingeffect. In thecaseofservices, the opposite is true,except when the
service sectorisdominated bycomparativelylow-skill,low value-addedactivitiessuchas hotels,tourism,and
retail. If the service sector is dominated by low value-added activities, its growth potential is low. and
therefore,
we
would expectanegativerelationshipwith income. Withrespectto manufacturing,a relativelyhigher shareofemployment inmanufacturing islikely to have alargergrowthpotential as largenumberof
employees
may
beengagedInterest in convergenceanalysis hasled to the development ofseveralwaysof measuring convergence
often categorizedasstaticanddynamic measures. Thestaticmeasuresprovideasnapshotofinequalitiesat a
pointintime.
One
majorexampleofthismethodistheGini-coefficientindex[1].The second sets are the dynamic measures, which are used to examine long-term growth/change in
income.
Two
ofthemajordynamic measuresare:a.Sigma(6)Convergence -Thismeasuretracks theintertemporalchangeinthelevelofincome
among
regions. Both the standard deviation and the coefficientofvariation (CV) are usedin the 6-Convergence
Basically,if
theCV
(standard deviation dividedbythemean)foragroup ofeconomiesissmallerattheendota period than at the beginning, thentheeconomies have converged.
b. Beta(a)Convergence-Thismeasurefocusesonthechangeinthemobility orpositionofindividua economieswithinadistributionanditisusedtoanswerthequestionof whetherpoorereconomiesarecatchins.
uptoricher countries. Another
way
oflookingat this measure istocompare the growthrates ofthe lowestincome economies andthe growth rates ofthe highest income economies. This methodisoften derivedby
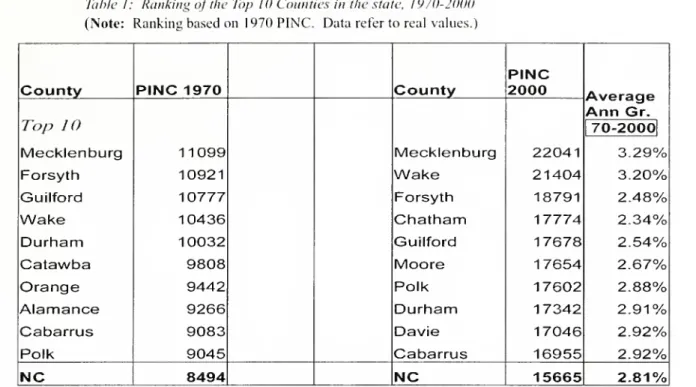
Table I: Ranking ofthe Top 10Counties inthestate, 1970-2000
(Note: Rankingbasedon 1970 PINC. Datareferto real values.)
PINC
County
PINC
1970
County
2000
Average
Ann
Gr.Top
10
Mecklenburg
11099
Mecklenburg
22041
70-2000|
3.29%
Forsyth
10921
Wake
21404
3.20%
Guilford
10777
Forsyth
18791
2.48%
Wake
10436
Chatham
17774
2.34%
Durham
10032
Guilford17678
2.54%
Catawba
9808
Moore
17654
2.67%
Orange
9442
Polk
17602
2.88%
Alamance
9266
Durham
17342
2.91%
Cabarrus
9083
Davie
17046
2.92%
Polk
9045
Cabarrus
16955
2.92%
NC
8494
NC
15665
2.81%
bedividedinto three majorregions
-
Mountains, Piedmont andCoastal. Theseareas are identified based onelevation,andgeographershave usedthe regionstoanalyzethephysicalandsocioeconomic characteristics ofthe State (see Lonsdale, 1967).Appendix
B
depicts thegeographicclassificationofthe state. Thesethreeareashavedeveloped at
different rates with thePiedmont area leadingin
economic
andpopulationgrowthincontrasttothe Mountains orCoastal Regions (see figure l).The
third level ofanalysis will look at the growthinincomeamong
themetroand non-metro counties withinthe three geographic areas. This analysis is conducted to further investigate ifurbanization or the lack of it had any impact in influencingthegrowthinincome
among
thethree geographic areas.The
analysiswillbebasedonregionalrealper capitaincome
(PINC) growthfortheperiod 1970
to2000. Regional percapita levels are the most
commonly
used
indicators foranalyzing
differences in economic development.
The
per capitaincome
measures were derived from the NorthCarolinaStateData Center- Log
IntoNorth Carolina(LINC).The
figureswereconvertedintoreal values by using the
consumer
price index(CPI). [2]
The
succeeding analysiswill present trends inincome
growth based on the differentlevels.
Trends in
Per
CapitaIncome
North Carolina counties have experienced steady growth in
PINC
since the 1970s. Whilethestatehas
grown
atanaverageof 2.81 percentper
annum,
growthratesweremuch
lowerinsome
regions, particularlyinthecoastalareas.
What
isof interest to our study is whether the growth experience has been shared equally across the
state totheextentthatthefastestgrowthhas taken
place in thecounties/regionsthatwererelatively
pooratthe startofthe studyperiod.
As
a prelude to the formal investigation of the convergence hypothesis, this section willexamine
the change in percapita income in thestateovertheperiod
1970-2000.
Table1 reportstherankingofthetop 10countiesinthestatebased on per capita real income between 1970-2000. Average annual growth rates arc also
shown
foreachcountyforthe
same
period.The
tableclearly demonstratesthatthetop 10 countieshavegrown
abovethe state annual percapitaincome growth rate
of
2.81 percentand
countiessuch
asthroughout the study period.
However,
some
counties, particularly those in the Piedmont area
have
shown
a tremendousgrowth. Forinstance.Wake
andChatam
countiesmoved
from 4lhand
28'h
rankin 1970to2
nd
and4"'respectivelyin2000.
Conversely,
Warren
andHoke,which
ranked90"'and 88,h
in 1970 dropped
down
to 99"' and 100,hrespectively in 2000.
The
growth
rate also indicates that themany
ofthe counties in lower rankinggrew
ata ratemuch
lowerthan the stateaverage of2.81 percent during the
same
period. For example,Warren
and Hoke's annual growth ratewas
2.75and
1.69 percent respectively. Overall,withslightexceptions, therewas
no major shift intherelativepositionsofthetop 1 counties.Metro Vs.
Non-metro
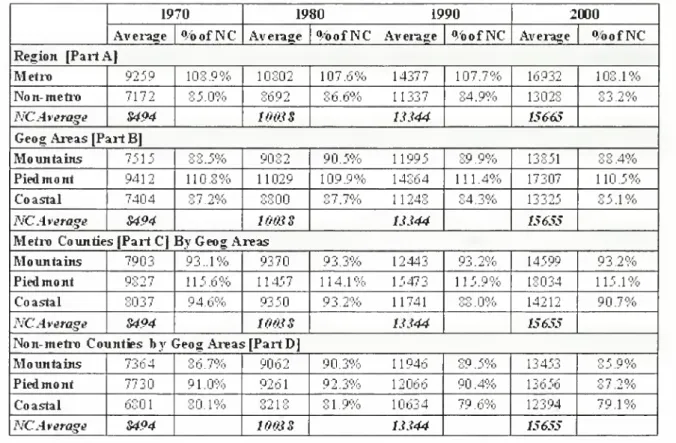
AreasTable 2, PartA,
shows
the difference in realpercapita
income
between metro and non-metro countiesfortheperiod 1970-
2000.Two
importantfacts can be discerned
from
the table. First,averagerealpercapita
income
innon-metroareashas slightlydeclinedfromabout 85 percentofthe
state average in 1970to 83 percentin 2000.
The
shareof
income
formetro counties hasessentially remained thesame
during this period. Second, the gap in per capita income between metro and non-metrocountieshascontinuedtoincrease from $2,087 in 1970 to $3,904 in 2000. Third, the coefficientofvariationshowsan increasingtrendin metro areas and a slight decrease in the non-metro arcas[3]. This trend suggests that there has been a steady state of income levels in the non-metroareasanda trendtowarddivergencein
the metro areas.
Geographic
AreasIncome
differenceinNorthCarolinacanalso be discernedby
examining trends inincome
growth
among
the three geographic regions:Mountain,
Piedmont
and Coastal Areas.As
illustrated in Table 2, Part B, the Piedmont area,
whichhashada historyofhigherpercapitaincome
in thestate, has continuedto lead throughoutthe
studyperiod. Itisinteresting tonotethat thistrend has remainedthe
same
inthelastthreedecades-Table2: AveragePer Capita RealIncomeDispersionbyRegion. 1970-2(100
1970 1980 1990 ->
000 Average
°oofNC
Av
erage°oofNC
Average°oofNC
AverageOoofNC
Region [PartA)
Met
ix) 9259 108.9% 10302 107.6% 14377 107.7% 16932 103.1% Noit-metro 7172 85.0% 8692 86.6% 11337 34.9% 13028 83.2%NC
Average S494lows
13344 15665Geog
Areas[PartB]Mountains 7515 88.5% 9032 90.5% 11995 89.9% 13851 88.4% Piedmont 9412 110.8% 11029 109.9%. 14864 111.4% 17307 110.5% Coastal 7404 87.2% 3300 9"7TO,;L
11243 34.3% 13325 85.1%
NC
Average S494 1003S 13344 15655Metro Counties [Part C]
By Geog
A
itasMountains 7902: 93..1% 9370 93.3% 12443 93.2% 14599 93.2% Piedmont 9327 115.6% 11457 114.1% 15473 115
9%
18034 115.1% Coastal 3037 94.6% 9350 93.2% 11741 880%
14212 90.7%NC
Average S494 10(0 s 13344 15655Non-metro Counties
by
1"tP0£Areas;[PartD]Mountains 7364 86.7% 9062 90.3% 11946 89.5% 13453 85.9% Piedmont 7730 91.0% 9261 92.3% 12066 90.4%
U656
61J.70 Coastal r,:.:i.n 801%
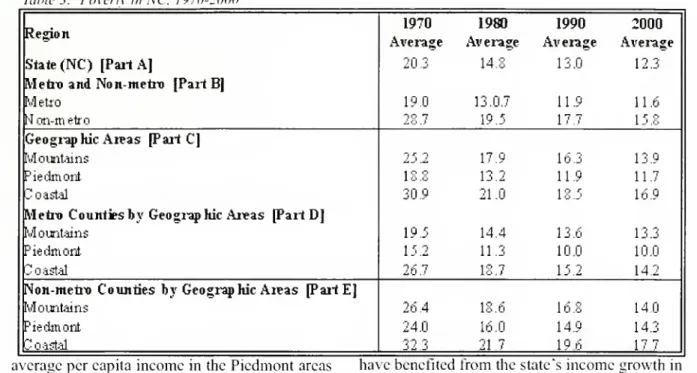
8213 31.9% 10634 79.6% 12394 79.1%Table3: Povertyin NC. 1970-2000
Region
1970 1980 1990 2000 Average
Av
erageAv
erage AverageState
(NC)
[PartA] 20.3 14.8 13.0 12.3Metro and Non-metro [Part B]
Metro 19.0 13.0.7 11.9 11.6
Non-metro 28 7 19.5 17.7 15.8
GeographieAreas [Part C]
Mountains 2j.2 17 9
163
13.9Piedmont 18.8 13.2 11.9 11.7
Coastal 30,9 21.0 18.5 16.9
Metro Countiesby Geographic Areas [PartD]
Mountains 195 14.4 13.6 13.3
Piedmont 15.2 11.3 10.0 10.0
Coastal 26.7 18.7 15.2 14.2
Non-metro Counties by GeographieAreas [PartE]
Mountains 26 4 18.6 16.8 14.0
Piedmont 24 16.0 14.9 14.3
Coastal 32 3 21.7
196
177average pereapita incomein the Piedmontareas
in 1970
was
110.8 percent ofthe state average; thesame
trend prevails in 2000. However, the gap in income between the Piedmont and other geographic areas has continued to widen. For instance, the gap between the Piedmont and the Coastal areas in 1970was
$2,008; in 2000, thisgap has almost doubled to $3,982. Similarly, in
1970. 9ofthetop 10 countiesinthe statewerein
Piedmontarea.
A
similarsituationexistedin2000.The
coefficientofvariation forpercapitaincome
bygeographic regions showsan increasingtrend
in the Piedmont area, a decline in the mountain areasand a relatively stable trend in theCoastal areas [4]. See alsoFigure3.
Metro
Counties byGeographie
AreasThe
relative share ofincome
forMetro
counties [Table2, PartC]
shows
thatthose in the Mountains andthePiedmontareashaveessentially maintainedtheirsharewhereasthemetrocountiesin the Coastal areas have experienced a decline.
The
coefficient ofvariation for the metro areas confirms thispattern.Non-metro
Counties byGeographic
AreasThe
nextlevelofanalysisfocusesonthetrendinrealpercapitaincome growth
among
non-metro counties in the state. This analysis helps todetermine iftherural counties in North Carolina
have benefited fromthe state's
income
growthinthe last three decades. It also helps to examine
(a) ifthere are significant differences in income growth
among
the ruralcommunities in thethree geographicareasofthestate,and(b)ifthe State's rural initiativeprogram
hasmade
a significant difference in improving the relative share oftheruralcommunities.
As
illustrated in Table 2, PartD
the relativeshareofincome
among
thenon-metrocountiesinthe three
geographic
regions has declined throughout the study period.Even
the rural communitiesin the Piedmont areahave notbeen spared this relative decline (the decline in the Piedmont areawas from
91 percent ofthe stateaveragein1970to87percentin2000).
By
contrastthe metro counties in the
Piedmont
area havemanaged
to maintaintheirrelative share.An
analysisofthepovertyrateby metroversusnon-metro
areas as well asamong
the threegeographic areas also
shows
a similartrend.As
illustrated in Table 3. North Carolina counties in
general have
done
very well in reducing their poverty level; the Mountains and Coastal areashave cut their poverty rate almost in halfin the
last three decades.
The Piedmont
area,which
hashadarelativelylowpovertyrate,stillmaintains
Figure3: PerCapitaIncomeDispersion
TO
>
41 DC
O
a.
16000
14000
12000
10000
3000
6000
4000
2000
Per
Capit
Income
Dispersion
Metro Vs
Non-metro
Counties
Metro
Mon-
metro
1970 19t
Year
1990 200016000
14000
12000
1
>
1
0000
~
8000
cr
2
6000
4000
2000
Per
CapitaIncome
byGeog
Region. 1970-2000'Mountains Piedmont
Coastal
1970
1980
Year 1990
2000
Box
2: a-convergenceMeasure
The literatureoneconomicconvergenceis largelybasedontheneoclassical growththeory,whichuses
concepts such as 6-convergence and a-convergence to evaluate the growth performance ofvarious economies. According to the convergence theory, for 6-convergence to occur, the dispersion in per capitaincomemustdeclineovertime,thatis,overa given period,say timettot , 6
<
6t
musthold true.
The a-convergence predicts that due to the neoclassical assumption of diminishing returns, poorer economieswill grow fasterthan richer economies, and in due course all economies will converge to thesamesteadystate. Thistypeofeconomic growth leadingtoconvergenceiscalled theunconditional a-convergence. To test for unconditional a-convergence, the
commonly
applied equation, which approximates the transitional growth process in the neoclassicalmodel,takesthe followingform.Yi
w
=
bloa(Y
C v 1.1)+
e'
it
(1)
where Yi = the average growth rate of per capita income over the period t to t+, log (Y. is the logarithm ofthe initial level of percapita income, b indicates the rateof a-convergence. ande. isthe
error term. Convergence in an
economy
implies that the derivative ofgrowth of per capita incomeoverinitial levelofincomeisnegative.
d(YW
d(Y
)<
(2)A
positivesign ofthecoefficientestimate forlog(Y ^ indicates divergence.The second type of convergence is called the conditional a-convergence. which argues that
onlyoncethedeterminantsof an
economy
"ssteady-stategrowthlevelarecontrolledwilltheeconomy
convergeto its individual steadystate.
To
test forconditional a-convergence, avectorofX
|
variables
thatcontrol for cross-economies variation in steadystate values areaddedto equation (1).
Yi
a-b,loa(Y
)+ b,X
+e
1 s
v
to7 2 it it (3)
A
negative coefficient estimateoflog(Y )is again interpretedasevidence of convergence.The literatureon convergence theoryuses a
number
ofcontrol variablestoexplain thegrowthprocessamong
various economies and to evaluate ifthere has been conditional convergence. The control variables have beenidentified aspolicyor"core"andeconomicvariables.The
core variables serve as proxy forthefundamental determinants ofthesteadystatein theneoclassicalmodel andthe economicstructure variables are included to further isolate those factors that influence the
movement
towardsthesteadystate.
Some
examplesofthecore variablesare infrastructureinvestmentandhuman
resources, and oftheeconomic structureare those representingemployment indifferent sectors ofthe economy.Theestimationprocedure usedthepooledtime-seriesmethod,also
known
as thepanel analysismethod. The panel method isused because ofits abilityto account for the effects of time and space. Fortheestimation,
we
selectedthe ordinaryleast square(OLS)
method. The estimation basedon the generalleast square(GLS) method gaveessentially the
same
results.2000.
The Mountain
andthecoastalareashavearateof14percentand 17percentrespectively (see
alsoFigure2).
III.
Methodology
Interest inregional income inequalityhasled
tothedevelopment ofseveral
ways
of measuring incomedispersion overtime.Box
2illustratesthe regressionapproach,themost widelyusedmethod
basedon the
works
of Barro and Sala-I-Maratin (1995).VI. Variables
and Data
The
dataused in thisstudyare for theperiod1970-2000, grouped intothreeten-yearintervals as 1970-80, 1980-90,
and
1990-2000. This grouping gives the advantage ofsmoothing the periodic fluctuationandmaking
thedatalessproneto serialcorrelation,
which
isa majorproblem inusingannualdata. DataarcderivedfromtheNorth Carolina State Data Center
- LINC.
The
dependent variable is average annual growth ofper capita income(AGPINC)
inNC
countiesforthethreeperiodspooledtogether.
The
valueofthe independent variablesrepresentsthe
initial levelof averagepercapita
income
foreach decade. This approach helps to eliminate the simultaneitybiasproblem,which
isamajorissueinconvergenceanalysis.
The
corevariables include:Initial level
ofper
capitaincome
(LPINC).This variable serves as a proxy for the
steady-state level ofphysical capital, initial resource
endowments
and technology (Barro 1991). Ifthere is
income
convergence,we
expect the coefficient ofLPINC
to be negative throughout the study period.A
log form ofthe variable isusedin the analysis.
Totalpopulation
growth
(POPCH).
This variablecaptures thechangeinincome
asaresultofchangeincapital-laborratio. Intheneoclassical growthmodel,growthinpopulationwillcausethe levelof
income
(Y)
todeclinethroughaloweringofthe capital-labor ratio, as capital must spread overa greaterpopulation. Therefore,
we
expect thecoefficientofpopulationgrowthtobenegative.Urbanization
(URBAN).
The
shareof
urbanization (urban as a proportion of total population) serves as a proxy for agglomeration economies, which intensifies growth creating a positive impact on the growth of
income
(Y). Therefore,we
expect a positive relationship between share ofurbanization and growth of per capita income.High
schooland
collegegraduates
(age25+)
as a percentage of population(EDPOP).
Thisvariableisusedas aproxyfor
human
capital.The
literature oneconomic
convergence arguesthat increase in the level of
human
capital will increase the steady-statelevelof percapitaincome by improvingtheabilityof workers toadopt new-technologyandideas,thus raising the productivity oflabor(BarroandSala-i-Martin 1995,Coulombc
and
Trcmblay
2000). Based on thisassumption,we
expectthe coefficientofEDPOP
tobepositive.Per
capita expenditure on infrastructure(PCEXINF).
This variable includes per capitaexpenditure
on
utilities, road and other capitalfacilitiesspentbylocalgovernment. Expenditures ininfrastructurearcexpectedtoenhancethe level andqualityofinfrastructureandthereby increase thesteady-state level ofincome (Y). Therefore, it is expected that the coefficient of
PCEXINF
would
bepositive.Total
paved
mileage
of
primary
and
secondaryroads
(PVDHIGH).
The
developmentof
highways
is important inenhancing
theinfrastructure capacity of counties
and
their potential to increase productivity. Increase inproductivity will leadtoanincreaseinincomeina region. Therefore,
we
expect a positive relationship betweenPVDHIGH
and growth inincome.
The
additional control variables are relatedtothe
employment
structureoftheeconomy
in theregion:
Percent
of
employment
infarming
(EMPFRM).
Employment
infarming
as a proportion oftotalemployment.
This variable controls forthelevelof dependence oftheregionaleconomy
inagriculture.A
relativelylowershare ofemployment
inagriculture indicates theshiftinthe structureofthe local
economy
asemployment
moves
from agriculture to higher productivitysectorssuchasmanufacturing. Hence,
we
expect a negative signforthecoefficient ofEMPFRM.
Percent
of employment
inmanufacturing
(EMPMANF).
Employment
in manufacturingasa proportion of total
employment.
A
higheremployment
inmanufacturing hasthe potentialforlabor to be
engaged
in high-value activities. Therefore,we
expect a positive relationship betweenEMPMANF
and the growth ofincome.Percent
of
employment
in services(EMPSERV).
Employment
in service as a proportion oftotalemployment.
This variable serves as an indicator of amore
dynamic
and diversified economy. Therefore,we
expect the coefficientofEMPSERV
to be positive.Geography
(GEOG).
GEOG
representsa setof regional variables to
account
for spatial differenceamong
thethreetraditionalgeographicalareas.
The
values are indicted as 1 ifwithin thegeographicregion, ifotherwise. Thisvariableis
includedtoexamineifregional variation
makes
a differencein thegrowth ofPINC.
Trends
inInfrastructure
Investment,
Human
Resources
Development
and
Economic
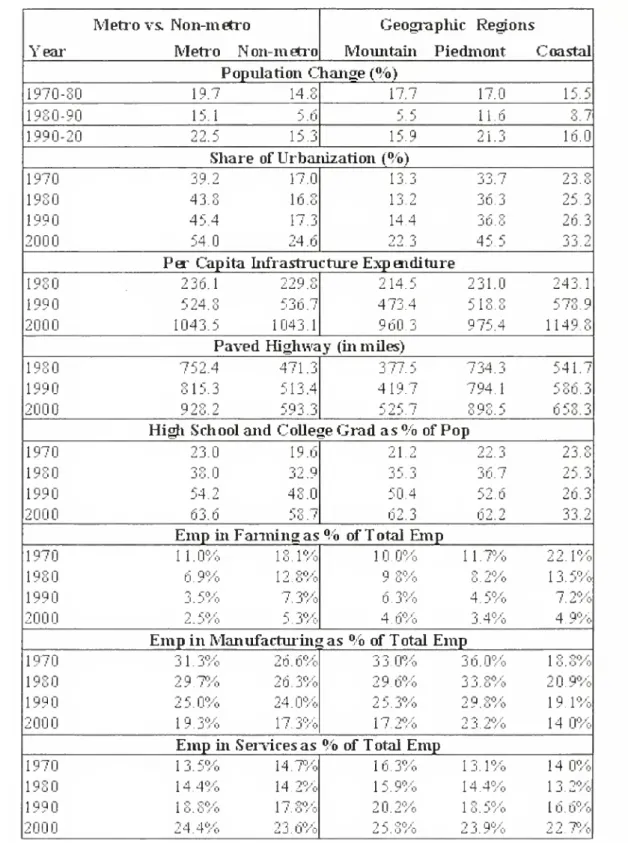
StructureThisanalysisisbasedonTable4whichdepicts growthtends
among
the differentregionsused inthe study.
Metro Vs.
Non-Metro
AreasMetroareas have experienceda significantly highergrowth rate in population in the last three decadesthannon-metroareas. Inthelast census, metro counties increased at an average of 22 percent
compared
to 15 percent for non-metro counties.Urbanization is increasing at a higherrate in metro areas.
The
percent of urban population increased from 39percentin 1970to54percentin 2000.The
corresponding figures for non-metro counties arc 17and 25 percent respectively.Percapitalocal expenditureon infrastructure
isataboutthe
same
level inbothmetro and non-metro areas.Thereisalmost twiceas
much
pavedhighway
in metroareas asin non-metroareas.About
64percentofthepopulation (25+age) inmetroareasishigh schoolandcollege graduates.The
corresponding figure for non-metroareas is 59 percent. Figure 5 depicts the geographic distributionofeducationallevel in the state.Employment
in farming and manufacturinghasexperiencedadecline inthelastthreedecades inbothmetro and non-metroareas.
On
theother hand,theservice sectorhascontinuedtoincreasein bothareas.
Geographic Regions/
A
reusPopulation increaseinthePiedmontarea
was
significantly higher than that in the
Mountain
or Coastalareas.The
shareof urbanizationinthePiedmontareain
2000
was
45 percent ofthe total population whereas that ofthe Mountain and Coastal areas sharewas
22 and33 percentrespectively.The
trend in local per capita infrastructure expenditureshows
an increasing trend in allregions.
The
difference in local infrastructure expenditureamong
the three regions is notsignificant.
Intermsofpavedhighways,thePiedmontarea has about 25 percent
more
pavedhighway
than theMountainorCoastalareas. Figure 4illustrates that in terms ofaccessibility, 83 percent ofthe countiesinthePiedmontareahave over50percentoftheir population within 10 miles ofa 4-lane
highway.
The
corresponding figures for the Mountain andcoastalareas are58and 59percent respectively.Over
60 percent ofthe population (25+ age group) inthe Mountain and Piedmontareas have above high school education.By
contrast only oneoutofevery threepersons intheCoastal area has anabove
hinh school education. For aTable4: Trendin Population Growth. Infrastructure.
And
Human
DevelopmentYear
Metro
vs.Non-metro
Metro
Non-metro
Geographic
Regions
Mountain
Piedmont
Coastal
Population
C
lange
(%)
1970-80 19 ,'
;
14.8 17.7 17.0 15.5
1980-90 15.1 5.6 5.5 11.6 8.7
1990-20 22.5 15.3 15.9
213
16.0Share
ofUrbanization
(°o)1970
1980
1990
2000
39.2 17.0 43.8 16.8 45.4 17.3 54 24.613.3 33 7 13.2 36.3 14 4 36.3 22 3 45 5
23.8 25.3 26.3 33 2
CM
Q:
Per
Capita
InfrastructureExpenditure
IS
5
to6
19801990
.: i 236.1 229.8 524.8 536.7 1043.5 1043.1 214.5 231.04734
518.8 960.3 975.4 243.1 578.9 1149.82
5
Paved
Highway
(inmiles)CO
1930
1990
2000
752.4 471.3 815.3 513.4
928
2 593.3377.5 734.3
419.7
794.1541.7
536.3 658.3
o
High
School
and
College
Grad
as
*!o ofPop
~3 CD 5^
1970
1980
1990
2000
23.0 19.6 38.0 32.9 54.2 48.0 63.6 58.735.3 36 7
50.4 52.6 62.3 62.2 23 ;:: 25.3 26.3 33.2
|
Emp
inFarming
as
%
ofTotalEmp
O
o
1970
1980
1990
2000
11.0%
18.1%
6.9%
12,8%
3.5%
7.3%
2.5%.5.3%
10.0%
11.7%
9
8%
8.2%
6.3%
4.5%
4 6%.
3.4%
22
1%
13.5%
7.2%
4.9%
Emp
inManufacturing
as
%
ofTotalEmp
1970
1980
1990
2000
31.3%
266%
29.7%
26 -i%25.0%
24.0%
19.3%
17.3%
33
0%
360%
29.6%
33.3%.2 5 3%.
29.8%
17
2%
23.2%
18.8%
20.9%
19,1%
14.0%
Emp
in Servicesas
%
ofTotalEmp
1970
1980
1990
2000
13.5%
14.7%
14.4%
142%
18.8%
178%
24.4%
236%
16.3%
13.1%
15.9%
14.4%
20.2%
18.5%
25
3%
23.9%
14.0%
13.2%
16.6%
22.7%
Mountain
Piedmo
ntlCoastal
/ith
HS
and College EducationPetV Percentage Mountain Piedmont C*asta
l__
46-51 51 -57
57 -62
62 -69
69-86
46-51%
51 -57%
57-62% 62-69%
69-86%
1
7
7 5 4
3
9 10 5
8
10
13 8 7 3
^
I
"
Figure 4: Education
distribution
of
thepopulation
by
levelof
education, see figure5.
(
Employment
in fanning hascontinuedtodecline in all areas, and in
2000
employment
accountedfor lessthan5percentofthe
employment
in allregions.
(
Employment
inmanufacturing
has continuedtodeclineinallareaswhileemployment
in services has continuedto increase.
Results
6- convergence
The
6-convergencewas examined
byderiving cross-sectional standard deviations ofthe log of per capita income for the state and the different geographic regions.As
illustrated inTable5,the6-convergence
for the stateover
the threedecades
shows
that there hasbeen
a sliiihtTable5: 6—convergence
State
1970
1980
1990
2000
Trend
NC
|State|o-NC
0.0191
0.0174
0.0177
0.0170
Com
enienceMetro
Vs.Non-metro
a-Metro
0.01510.0142
0.0164
0.0159 Divergence
a—
Non-metro
0.0155
0.0149
0.0145 0.0141Convergence
Geo«
Regions
a—
Mountain
0.0187
0.0158
0.01750.0142
Com
ergencea—
Piedmont
0.0174
0.0166
0.01X30.0188
1)i\ei'Liencea—
Coastal0.0144
0.0144
0.01 160.0138
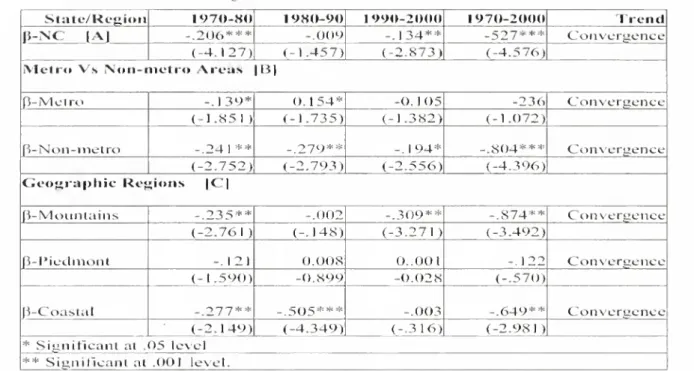
Di\ergenceTable 6: Unconditiimal d-Convergence Across North Carolina Counties
State/Region
1970-80
1980-90
1990-2000
1970-2000
Trend
P-NC
JA1-.206***
-.009-.134**
_5->7***
Convergence
(-4.127) (-1-457) (-2.873) (-4.576)
Metro Vs
Non-metro Areas
Bl
P-
Metro
-.139*0.154*
-0.105
-236
Convergence
(-1.851) (-1-735) (-1.382) (-1.072)
(3-Non-metro
-.241**
-.279**
-.194*-.804***
Convergence
(-2.752) (-2.793) (-2.556) (-4.396)
Geographic
Regions
[C]P-Mountains
-.235**
-.002-.309**
-.874**
Convergence
(-2.761) (-.148) (-3.271 ) (-3.492)
P-Piedmont
-.1210.008
0..001 - 1''2Convergence
(-1.590)
-0.899
-0.028
(-.570)p-Coastal
277**
5QS***
-.003-.649**
Convergence
(-2. It") (-4.349) (-.316) (-2.981) * Significant at .05 level
**
Significant at .001 level.decreaseofthevaluebetween 1970 and 1980,then
aslightincreasebetween 1980 and 1990 andagain
adeclinebetween 1990 and2000. Althoughthere
are cyclical changes during each decade, the general trend
shows
that there hasbeen 6—
convergencein incomeinNorthCarolinabetween
1970 and 2000. These findings arcimportant for
two
reasons. First,the analysis suggeststhattheeconomics
ofthepoorer counties arccatchingup withthe richeronesintermsofgrowthinpercapita income. Second, as illustrated by the6-
anda-convergence measures,
convergence
seems
tohaveoccurred during
good
timesanddivergence hasoccurred duringbadtimes.The
period 1980-90was
characterized by majoreconomic
crisesthat affected
many
states in the country.On
the other hand, the period 1970-80was
a period ofeconomic
growth and 1990-2000
was
aperiodofeconomic
expansion as the nationaleconomy
spiraled upwards, thanks to the bullish stock market associatedwiththe
dot-com
economy.The
6-convcrgcncc analysis between metro and non-metroareasandamong
geographicregionsshows mixed
results: therewas
a general trendtoward
divergence
inmetro
countiesand
geographically,inthePiedmont andCoastalareas.
The
findings ofthe 6-convergcncc indicate the presence ofunconditional a-convcrgcnce inthe state, and
among
the different regions ofthestate.
The
implicationsofthesefindings arc further exploredin thenextsection.The
estimatesbased ontheregression equations illustratethespeedofconvergence
as well as the robustness of theestimates.
^-convergence
Table 6 presents regression estimates ofthe unconditional (3-convcrgcnce as proposed
by
the neoclassical growth model.As
illustrated in thetable,thecoefficientsofaforthestatearenegative
and statistically significant except for 1980-90.
Thesefindingsarc consistentwiththeneoclassical growth theory. Therefore,
we
canconclude that,on
the average, there is clearevidence
of convergenceinthestate,thatis,counties withlow percapita initial income arc growing fasterthan those withinitial highper capitaincome.The
[3estimates forthevarious regionsshow
evidence of convergence and divergence.The
estimatesforthemetroand non-metroareas [Part B]
show
atrend toward convergence.The
resultofconvergence
by
geographicareashows
mixed
results. In the
Piedmont
area, the rateof
Table 7 : Conditional a-Convergence with Core and EconomicStructure Variables
Core
Variables
Econ
Structure Variables
Regional
Dummy
Constant
10.4015
10.3117
10.3117
LPINC
-2.3957*** -2.3936*** -.2.408*** (-15.45) (-15.48) (-15.37)POPCHG
-0.3844*
-.4248*-0.4466**
(-3.06) (-3.35) (-3.52)
Tl
c
URBAN
-0.0005
-.0007
.0007
7\a
(-.75) (2.05) (1-07)
o
>
zz
m
EDPOP
0.0119***
.0128*** .0124***>
(4.53) (4.82) (4.53)
z
D
>
PCEXINF
-0.0002
-0.0002
-.00008
Q
(-0.94) (0.91) (-0.37)
o
CDm
zz
PVDHIGH
0.00005
0.00008
0.00006
2
(1.20) (1.67) (1.31)
c
en
EMPFRM
0.1024
0.1239
2
m
(1.21) (1.46)
EMPMANF
0.0299*
0.0275*
(1.79) (1.66)
EMPSERV
-0.0053
-0.0006
(-0.35) (-0.04)
GEOG1
0.0481
_ (1.32)
GEOG2
0.0955**
(3.05)
p2
Adjusted0.7496
0.7540
0.7598
df 6,
293
9,290
11.288
F-Value
150.16
102.65
86.98
Note:
The
independent
variable isaverac
jegrowth
ofper
capita income(AGPINC).
***Statistically significant at .001 level."Statistically significant at .05 level. *Statistically significant at .10 level.
convergence
shows
a consistentdeclineovertime.On
the other hand, the rates in the case of theMountain
show
adeclinein 1980-90 andthenanincrease in 1990-2000. InthecaseoftheCoastal areas there
was
an increase in 1980-90 and then a decrease in 1990-2000. In general, the a estimatesshow
a decline and the conclusion isthattheNorthCarolina countieshaveexperienced
an
income
growth leading toward a similar (notidentical)steadystate.
The
extenttowhichpolicyvariables and a
change
in the structure of the regionaleconomy
haveplayedaroleinaccelerating convergencecanbefurtherexamined byincluding the coreand
other control variables (mainlyeconomic
structure variables) in the regression equation as presented below.Table 7 depicts estimates ofthe conditional a-convcrgenccwith coreand
economic
structure variables. It reveals that the coefficientsof:LPINC
arenegative
and
statistically significant for all themodels
confirming the findingsbased on 6-convergencc.POPCHG
are negativeand
significant aspostulated inthe hypothesis.
Urbanization
(URBAN)
isnegative,oppositetothe hypothesized relationship,andstatistically
insignificant, except for
Model
2.The
result suggests that urbanization hadno
significant impact on growth ofPINC.
Education
(EDPOP)
has a positiveand
statistically significant relationship for all the
models ashypothesized.
Infrastructure expenditure
(PCEXINF)
and mileage of pavedhighway
(PVDHIGH)
are not significant suggesting that local governments' expenditure on infrastructure did nothave
significant impacton growth in
PINC.
In terms of the
economic
structureand
regional variation variables:
The
coefficients ofemployment
in fanning(EMPFRM)
are positive but they are notstatisticallysignificant. Thisfindingsuggeststhat
agriculture had a
low
growth potential for the region since agriculturaldemand
in the last few decades had beenon the decline.The
coefficientsof
employment
inmanufacturing
(EMPMANF)
are positiveand
statistically significant, which suggests that the
manufacturingsectorplays amajorroleinincome convergence inNorth Carolina.
The
coefficients forEMPSERV
are negativeandtheyarcnotstatisticallysignificant.
The
resultmay
be an indication of theemployment
characteristics ofthe service sector.
The
service sectorinNorth Carolinaisdominated by low value-addedandlowskillactivitiessuchashotels,tourism andrestaurants.The
geography
variable representing thePiedmontarea
(GEOG2)
isstatisticallysignificant.The
variables forother geographic areas are notstatisticallysignificant.
VII.
Summary
and
ConclusionThis study has attemptedtoshed light on the questionofincome convergenceinNorthCarolina.
A
majorconclusion ofthepaperis that therehas beenconvergence ofpercapitaincome
acrossthestateduringtheperiod 1970-2000.
The
evidencefrom the data set
shows
that both in terms ofa-convergence
and
6-convcrgcncc,
income
inequality
among
North
Carolina regions is narrowing. This resultcanalsobe interpreted as an indicator ofthe high growth potential ofthe poorercounties. However, an analysis oftrends between metro and non-metro areas as well asamong
traditional geographicareas indicatesthatthere
was
a general trend of divergence in the metro areas and convergence in the non-metro areas;and
among
the traditional geographic regions, theMountain
areas have experienced convergence, whereas the Piedmont and Coastal areas have experienced divergence.The
results of both the conditionaland
unconditionalconvergenceanalysesindicate that
the initial level of
PINC.
population growth andhuman
capitaldevelopment
(education) had asignificant impact
on
PINC
growth
inNorth
Carolina. However,theimpactofurbanizationand
infrastructureinvestment
was
minimal. Geographicvariation had an effect on the growth of
PINC.
Withrespecttotheimpactofstructuralchange
of the
economy
on
income
convergence, theempirical estimates suggest that the growth-inducing effects ofagriculture are stronger than
its growth-reducing effects as illustrated by the positivevalues. However, noneofthecoefficients
of
employment
in agriculture is significant.Therefore, agriculture in North Carolina had no
effectinreducing incomedifferencein theState.
In thecase of manufacturing andservices, a
relativelyhighshareof
employment
inbothsectorsis considered to be an indicator of a
more
diversifiedanddynamic
economy.The
empirical analysesshow
thatemployment
inmanufacturing hada significant impact on income convergence and its growth-inducing effects are strong.The
statistical insignificance ofservices
shows
thatemployment
inserviceshad noimpactonincome
convergence. Thisresultalsosuggeststhata large
number
ofemployees
inmanufacturing
areengaged in high-value activities whereas those
employed
inserviceactivitiesareengagedin low-skillactivitiessuchas hotelsrestaurantsandretailtrade.
The
negative relationshipbetween
employment
in servicesand growthinPINC
alsosignals that the growth inducing effects ofthe service sectoris weak.
The
poorperformanceofthe service sectorinreducing income divergence
can also be
explained by
thelow-paying
characteristics ofservice jobs. This finding is
consistentwiththeargumentthat
many
familiesin NorthCarolinaemployed
intheservice sector are working, butremainpoor.Policy implications
First, initial levelofincomeinNorthCarolina hada significantimpactininfluencingsubsequent
income
growth
rates. Consistent with theneoclassical growth model. North Carolina has experienced
income
convergenceinthe lastthree decades.The
convergenceprocess has narrowedincome
differencesamong many
counties.Nevertheless, the analysis by metro versus non-metro areas as well as
among
the traditional geographic areasshow
that NorthCarolina is farfromachievingthegoalof reducing long-standing regional disparities inthestate.
Second, thetrendovertheperiod 1970-2000 suggests that convergence occurred during the period of
economic
expansion and divergence occurred during the period of decline. North Carolina experiencedconvergence
during the period 1970-80and
1990-2000, both periods characterized byeconomic
expansion.On
the otherhand,theperiod 1980-90was
characterized byeconomiccrisesanddivergence occurred duringthisperiod.
Third. local
government
expenditure ininfrastructure, considered to be an important variable in increasingthegrowth performance of regions,hadverylittleimpactinreducingincome inequality in the state.
The
value for percapita expenditure in infrastructure is not statisticallysignificantthroughoutthestudyperiod. Thisresult
should be viewed with caution for
two
reasons.First,thedataoninfrastructureexpenditurereflect
only expenditure by local governments: data on Federalaswellasstateinfrastructureexpenditures were not available.
A
data set that reflects totalinfrastructure expenditure oflocal, state as well asFederal
Government
may
givea differentresult.Additionally, there are problems ofsimultaneity
inusinginfrastructureexpenditureinaregression model.
Do
economiesgrow
because they spendmoney
on infrastructure ordo
they invest ininfrastructure becausethey experience
economic
growth? This issue ofchicken and egg has not beensuccessfully dealtwith inthe literature.
Fourth, theresultsontherelationshipbetween population growth and
PINC
are consistent with theargumentpresentedbytheneoclassical theory,that is, growth in population will cause the level of
PINC
to decline since totalincome
has to be spread over a larger population.The
results of the urbanizationvariable are counterintuitive.Fifth,
although
there hasbeen
PINC
convergence in the state, the regional analyses
show
thatthePiedmont andCoastalareasof North Carolinaareexperiencing divergenceasopposedto the
Mountain
areas. This trend suggests that that there arepockets of affluenceandpocketsofpoverty
existing sideby
side in the state,particularly in the Piedmont and Coastal areas.
The
povertyareas, insteadof beingintegratedintothe regional
economy
stubbornlyexistas islands ofpovertywithpoorendowment
ofinfrastructureand
human
capital. Indeed, an analysis oftheincomedifference
among
thethreeregionsshows
that the
income
range (differencebetween
thelowest and highest income
among
the counties) in2000variesfrom$12,317inPiedmontto$7,597in the
Mountain
areas to $4,880 in the coastalareas.
The
trajectoryshows
that thisgapis likelyto continue widening in the next decade. This finding
underscores
the notion thatNorth
Carolina's traditional approach of developing broad statewide policies are not effective in
eliminating pockets ofpoverty in the state. It is
imperative that the state develops policies that
target poverty areas to improve their
economic
conditions
and
toenhance
theircomparative
advantage to attractinvestment.
References
Amos, O. 1989.
"An
Inquiry into the Causes of Increasing Regional income Inequality in the UnitedStates." The Review ofRegionalStudies. 19(2). 1-13.
. 1991. "Divergence of Per Capita RealGross
StateProductbySector- 1963to 1985." The Review of
RegionalStudies.21,221-234.
Archibugi. D. and Michie.J. 1995. "Technology
and Innovation:
An
introduction." CamhridgcJjournalofEconomics. 19. 1-14.Barro. R. 1991. "Economic Growth in a Cross SectionofCounties." Quarterly.JournalofEconomics.
106.May: 407-443.
. 1991. "Divergenceof Per Capita RealGross
StateProductby Sector- 1963to 1985. TheReviewof
RegionalStudies. 21: 221-234.
Notes
1. TheGiniIndexiswidelyusedinmeasuring incomeinequality.SeeKakwani(1980).
2. The CPIusedfordeflating are asfollows: 1970=38.8; 1980=82.4; 1990=130.7:
2000=172.2. Baseyear: 1982-84=100.0. See www.minneapolisfed.org/Researchydata/US
3. Inmetroareas,the
CV
increasedfrom.14in1970to.16in2000. Conversely,inthe
non-metroareas,itdropped from.14in 1970to.1
3
in2000.
4. Changeinthe coefficientofvariation(CV)by
region.
5. Theinitial equation usedby Barroand
Sala-I-Martin(1991)takes thefollowing form:
Region 1970 1980 1990 2000
Mountain 0.1726 0.1459 0.16491 0.1346
Piedmont 0.1555 0.1517 0.1741! 01856
Coastal 0.1245 0.1258 0.1067! 0.1238
andX.Sala-i-Martin. 1992. "Convergence." Journal ofPoliticalEconomy. 100,April: 223-251.
. 1995. Economic Growth.
New
York:McGraw-Hill.
Baumol, W.J.. 1986. "Productivity Growth. Convergence, and Welfare: What the Long-run Data Show?"American Economic Review.76: 1072-1085.
Benhabib.J.andW.Easterly. 1994. "TheRole of
Human
Capitalin EconomicDevelopment: Evidencefrom Aggregate Cross-Country Data. Journal of MonetaryEconomics. 34,October. 143-173.
Bernat.AndrewG.Jr. 2001. "ConvergenceinState
Per Capita Personal Income. 1950-99." Survey of CurrentBusiness. PP.36-48.
Blanchard,O.J. 1991. "Discussionon convergence Across States and Regions." Brookings Papers on EconomicActivity: 1. 107-182.
Caselli, F.. G. Esquivel and F. Lefort. 1996.
"ReopeningtheConvergence Debate:
A
New
LookatCross-CountryGrowthEmpirics."JournalofEconomic Growth. 1,September, 363-389.
Coulombe,SergeandTremblay.J.F.2000.
"Human
CapitalandRegionalconvergenceinCanada." Journal ofEconomicStudies.1999.
"New
Evidence ofConvergenceAcross CanadianProvinces: the roleofUrbanization." RegionalStudies. 34,8. pp.713-725.
Delgard,CarlJ.andJacobVastrup. 2001.
"On
theMeasurementof Convergence." EconomicLetters.70: 283-287.
Hofer. Helmut and Andrews W. Gotten 1997. "Regional Per CapitaIncomeConvergenceinAustria.
"
RegionalStudies31:1.pp. 1-12.
Kakwani.N.C. (1980). InequalityandPoverty -Methods ofEstimation andPolicy Applications. The WorldBank.
New
York: OxfordUniversityPress.Krugman.PaulR.andVenables,AnthonyJ. 1995.
"Globalization and the Inequality of Nations." QuarterlyJournal ofEconomics. Nov.,pp. 857-880.
Levine. R. and D. Renelt. 1992.
"A
SensitivityAnalysis ofCross-Country Regressions." American EconomicReview. 82,September, 942-963.
Lonsdale, Richard, E. 1967. Atlas of North Carolina. ChapelHill:TheUniversityofNorthCarolina
Press.
Mankiw. G.. D. Romer and D. Weil. 1992.
"A
Contribution to the Empirics ofEconomic Growth." QuarterlyJournal ofEconomics. 107,May.407-437.Martin.Reiner. 1999. The RegionalDimensionin
European
Public Policy:Convergence
orDivergence? NY: St.Martin. Pp.55-58.
Mcombie.J.S.L.1988. "ASynopticViewof Regional GrowthandUnemployment: theNeoclassical Theory." UrbanStudies.25: 267-281.
Nordahus, W. and M. Baily, 1991. [General discussion on Barrow and Martin] "Convergence Across States and Regions." Brookings Papers on EconomicActivity. 1. 107-182.
Quah,D.T 1996. "RegionalConvergenceClusters
AcrossEurope." EuropeanEconomicReview.Vol. 40.
pp.95-158.
Sala-i-Martin,X. 1996. "TheClassicalApproach to ConvergenceAnalysis. Economic Journal. 106.
July. 1019-1036.
Smith,D.M. 1975. "NeoclassicalGrowthModels and RegionalGrowthintheU.S." Journal ofRegional
Science. 15: 165-181.
Terrasi, M.1999. "Convergence and Divergence
Across Italian Regions." The Annals of Regional Science.33:491-510.
Acknowledgements
Theauthorwouldlike tothank
Tom
RichteroftheNC
DepartmentofCommerce.DivisionofCommunity Assistance,Wes
Hankins andMac
Simpson ofEast Carolina Universityforreviewing anearlier draftofthepaper and Al Burne ofEast Carolina University for
drawingthemaps.
Appendix
A: North Carolina MetropolitanCountiesCounty
Metropolitan
Area
Alamance
Greensboro-W
inston-Salem-High Point.NC
MSA
Alexander Hickorv-Morganton-Lenoir,
NC
MSA
Brunswick Wilmington.NC
MSA
Buncombe
Asheville.NCMSA
Burke Hickory-Morganton-Lenoir,
NC
MSA
( aharrus Charlotte-Gastonia-Rock Hill.
NC-SC
MSA
Caldwell Hickory-Morganton-Lenoir.NC"
MSA
Catawba
Hickory-Morganton-Lenoir,NC
MSA
Chatham
Raleigh-Durham-Chapel Hill.NC
MSA
Cumberland
Fayetteville,NC
MSA
Currituck Norfolk-Virginia
Beach-Newport
News. V'A-NC
MSA
Davidson Greensboro-Winston-Salem-High Point.
NC
MSA
Davie (jreensboro-W inston-Salem-HighPoint.NC
MSA
Durham
Raleigh-Durham-Chapel Hill,NC
MSA
Edgecombe
Rocky
Mount,NC
MSA
Forsyth Greensboro-Winston-Salem-HighPoint.
NC
MSA
Franklin Raleigh-Durham-Chapel Hill,NC
MSA
Gaston Charlotte-Gastonia-Rock Hill.
NC-SC
MSA
Guilford Greensboro-Winston-Salem-High Point.
NC
MSA
Johnston Raleigh-Durham-Chapel Hill.NC
MSA
Lincoln Charlotte-Gastonia-Rock Hill.
NC-SC
MSA
Madison Asheville.
NC
MSA
Mecklenburg Charlotte-Gastonia-Rock Hill.
NC-SC
MSA
Nash
Rocky
Mount,NC
MSA
New
Hanover
Wilmington.NC
MSA
Onslow Jacksonville.
NC
MSA
Orange
Raleigh-Durham-Chapel Hill.NC
MSA
Pitt Greenville.
NC
MSA
Randolph Greensboro-Winston-Salem-High Point.
NC
MSA
Rowan
Charlotte-Gastonia-Rock Hill.NC-SC
MSA
Stokes Greensboro-Winston-Salem-High Point.
NC
MSA
Union Charlotte-Gastonia-Rock Hill.NC-SC
MSA
Wake
Raleigh-Durham-Chapel Hill.NC
MSA
Wayne
Goldsboro.NC
MSA
Yadkin Greensboro-Winston-Salem-HighPoint.
NC
MSA
Source:
US
Census Bureau. Metropolitan Counties by State, 1999.Appendix
B:NC
Countiesby GeographicArea
n
Mountains
Piedmont
Coastal
Alleghany
Alamance
BeaufortAshe
Alexander
BertieAvery
Anson
Bladen
Buncombe
Cabarrus
Brunswick
Burke
Caswell
Camden
Caldwell
Cataw
ba CarteretCherokee
Chatham
Chowan
o
73
a
Clay
Clc\elandColumbus
Graham
Davidson
Craven
z
o
Max
wood
Davie
Cumberland
>
X
Ilenderson
Durham
Currituck>
Jackson
I ors\tliDare
>
z
McDowell
FranklinDuplin
<;Macon
Gaston
Hd$2eeombc
o
Madison
GranvilleGates
z
a
Mitchell Guilford
Greene
w
m
Polk Iredell Halifax
z
o
Rutherford
lee
1larnetts
Sum
Lincoln Ileitfordc
CD
z
Swain
Mecklenburg
Iloke1rans\ Ivania
Montuomcp.
1h
dem
I
Watauga
Moore
Johnston
Wilkes
Orange
Jones
Yancey
Person
LenoirRandolph
Martin
Richmond
Nash
Rockingham
New
Ilano\erRow
anNorthampton
Stanlv (tnslow
Stokes
Pamlico
Union
Pasquotank
Vance
Pender
\\ake
Perquimans
Warren
PittYadkin
Robeson
Sampson
Scotland
Tyrrell
Washington
Wayne
\\ ilson
N
24
35
41Appendix
C:Definitionand sourcesofvariables used. Datafor 1970, 1980, 1990 and
2000
are from
LINC
(www.linc.state.nc.us) unless otherwise indicated.LPINC
AGPINC
POVERTY
POPCHG
URBAN
EDPOP
PCEXINF
PVDHIGH
EMPFRM
EMPMANF
EMPSERV
Log
ofpercapitaincome
Average annual growth ofpercapita income Percentageofpopulationinpoverty
Population growth between censuses
Urban
population as apercentageoftotal populationHigh
schoolandcollegegraduates(25+age)aspercentageoftotalpopulation Percapita infrastructure expenditureby localgovernments.The
variablewas
derived
by
dividingtotal expenditureon roads, utilitiesandother servicesby
totalpopulation
Total mileage of primary and secondary roads
Employment
infarmingasaproportionoftotalemployment
Employment
inmanufacturingas aproportionoftotalemployment
Employment
inservices as aproportionoftotalemployment
Appendix
D: PerCapita Income, 1970-2000 (nominalvalues)County METRO GEOG PINC7
O
PINC80 PINC90 PINC2
O
Alamance 1 - 3577 8792 17574 25S32
A1exanclex 1 2 3034 7262 15GBB 23733
Alleghany 2 1 2475 6529 13923 25413
Anson 2 2 239-1 6339 14214 21883
Aahe 2 1 2192 5 78 8 13333 22681
Avery 2 1 2179 5889 13710 24162
Be-nufTort 2 ' 2771 7503
14941 2253O
Bertie 2 J 2213 6088 12695 214 36
I?1.t\do n 2 3 24 55 6208 12511 21494
Brunswick .1 3 28S1 €783 14091 21707
Buncombe 1 1 3236 846e 17971 272 21
Burke 1 1 3216 7630 1S760 217..
.-Cab<srrus 1 2 3511 8495 18027 28961
Cnldwei
J
1 1 3145 74SO 1S 1 7 3 24707
Camder. 2 3 2335 7771 13808 227 55
Cart«r«t 2 3 2332 7857 15214 2G090 Caowel
1
2 2 2538 5967 12613 19494
C^acawba 1 2 3787 8637 18781 27937
Clia:.ham 1 2 3133 8339 18534 30380 Cherok< 2 I 22 4 2 5825 12176 18323
Chowan 2 -' 253G 68B4 14797 23532
Clay 2' a 2258 57B6 12 927 21292
iveland 2 -: 300S 7900 15721 22259
Columbue 2 3 2505 6379 13228 21643
Craven ~
3 3149 82 73 1SP88 2S3 42
Cumberland 1 3 3iyy 7912 15141 24899
Curri tuck L 3 3054 7828 15628 24515
Dare 2 3 ^27* 7174 16270 - ..;
Davidson 1 - 3321 8113 16536 25327
Davie 1 .? 3176 3616 19346 29156
Dup1in 2 3 26SO 5577 14331 20560
Durhain 1 2 --.g . S>6G3 202^2 29739
Edgecombe t 3 2767 7 8-1 13530 20S27
Forsyth X 2 4211 ! 22218 32291
Franklin 1 2 2GS4 6449 14291 23276
CiiBtor; 1 2 323C 824O 1G 6 2 a 25006
• 2
'. 2594 6754 1356G 1926O
Graham 2 1 2160 6363 L046 4 13732
Granv ille 2 -- 25 4C 6 -J 14O51 21S50
Greene 2 J 312C 6449 150S5 2Q894
Guilford 1 2 4170 10121 21302 3O 372
Halifax 2 • 2407 64 28 13003
19674
Hornett 2 3 26C5 6270 13404 19781
Haywood 2 1 2917 7G22 15229 22571