Test-based Accountability and Alternative Education: Evidence of Gaming?
By Kenya I. Lee
Honors Thesis Department of Public Policy
The University of North Carolina at Chapel Hill
April 6th, 2018
Approved:
__________________________________ Dr. Steven W. Hemelt, Chair
Dr. Lora A. Cohen-Vogel, Second Reader
Abstract
Standardized testing has become a prominent tool used to hold public schools
accountable for student achievement. No Child Left Behind (2002) scaled-up test-based
accountability nationwide with its core requirements challenging schools to meet reading and
math proficiency targets or face punitive and corrective actions. Studies have examined the
perverse effects of accountability, finding that accountability pressure has incentivized schools to
game the accountability system in an effort to increase school performance.
Amongst the expansive gaming literature, no studies to date have considered alternative
school transferals as a potential avenue for gaming. Over the past two decades, alternative school
enrollment has grown disproportionately compared to enrollment growths in regular schools and
reports on enrollments indicate that the current demand for these schools exceeds the supply.
This study asked whether alternative school enrollment growths are another possible unintended
consequence of test-based accountability as “at risk” students may be transferred out of
traditional public schools into alternative schools in an effort to meet testing targets. I use
Comparative Interrupted Time Series modeling to assess the impact of NCLB on alternative
school enrollment using varying degrees of accountability in states pre-NCLB to sort states into
treatment and comparison groups. I find that the most significant impact of NCLB on enrollment
is seen in the years following enactment with accountability pressure attributed to a 6 to 8
percent growth per year in enrollment. However, this finding is sensitive to the inclusion of
out-of-school suspensions as a control. Additional analyses reveal that out of school suspensions may
be an intermediate pathway through which students are sent into alternatives. With these findings
I suggest that policymakers should look to revising accountability systems to hold regular public
Acknowledgements
I would like to thank a number of people without whose support this project would not
have been possible. First, I would like to thank my thesis advisor Dr. Steven Hemelt for his
unwavering support during the thesis project. His encouragement and mentorship has had a
transformative impact on my identity as a scholar, and I hope one day to mentor students with
the same deft and compassion. Next, I would like to thank my second reader and McNair mentor
Dr. Lora Cohen-Vogel who has been a constant support over the past few years. It has been a joy
being your mentee and learning from you. Thank you both for challenging me to produce my
best work.
I would like to thank Michael Little for providing invaluable feedback on the multiple
drafts that this thesis underwent. I would also like to thank James Sadler for his quick wit and
statistical consulting. I appreciate you both for taking time to work with me amidst your
obligations and pursuits of doctoral studies.
I would like to give lots of gratitude to the Ronald E. McNair Scholars program staff and
2018 cohort who have provided critical supports and encouragements in my pursuit of research
and graduate studies. I would like to thank my family—biological and those formed through
friendships for loving me to the edge of the universe and back. I cannot end without
acknowledging God, my ancestors, and my grandmothers’ prayers which have surrounded me
throughout this process. Last, I would like to dedicate this thesis to the late Annie M. Farrar, my
first educator, who believed in me first.
This project was made possible with grants from the Tom and Elizabeth Long Excellence
Table of Contents
Chapter 1: Introduction ……… 5
Brief Background on Alternative Education ………....7
Alternative Education and Red Flags for Gaming ………... 9
Policy Significance of Prospective Results ………. 12
Roadmap ……….. 13
Chapter 2: Literature Review ………... 14
NCLB Effects on Reading and Math Achievement ………. 14
Perverse Incentives and Unintended Consequences of Accountability ………... 17
Gaming, Accountability, and the Transferal of Students to Alternative Schools …… 22
Chapter 3: Methodology ……… 24
Selection of Treatment and Comparison Groups ………. 25
Outcome Variable ……… 26
Control Variables ………. 28
Model ………... 31
Internal Validity ………... 33
Chapter 4: Results ………... 35
General Findings ……….. 35
NCLB Adoption and Effects During NCLB Era ………. 35
Estimated Effects of NCLB [Table 2] ………. 37
Pathway Mechanism: Suspensions, Accountability Pressure and Enrollments …... 38
Chapter 5: Conclusion ………... 40
The Impact of NCLB on Alternative School Enrollment ……… 40
Study Limitations ………. 42
Suggestions for Future Research ……….. 42
Chapter 1: Introduction
No Child Left Behind (NCLB) passing with bipartisan support in 2001, emphasized
standardized testing performance as a mechanism for holding public schools accountable for
student achievement. This nationwide push for school accountability was brought forward by a
desire to measure performance in the public sector and supported by student achievement gains
in states that adopted accountability systems prior to the law’s passage. NCLB required annual
testing in reading and mathematics for all students enrolled in public schools in grades 3 to 8 and
at least once during high school. With NCLB’s aim to improve the achievement of all students
and reduce the educational achievement gap, schools were required to report disaggregated test
results for racial and ethnic minorities, English learners, and students with special needs. In
addition to reporting test score data, schools were called to meet reading and mathematics
performance targets for the school as a whole and for each student subgroup. Schools that failed
to meet annual testing targets, or adequate yearly progress, were identified for improvement and
faced various corrective actions. These corrective actions ranged from offering parents other
school choices to school turnover, or state takeover for schools that failed to meet performance
targets for five consecutive years (NCLB, 2002). NCLB was replaced by the Every Student
Succeeds Act (ESSA) in 2015. Under ESSA, states are granted more flexibility in how they hold
schools accountable for student achievement although testing requirements remain and test
scores must be included in states’ accountability systems.
This expansion of test-based accountability along with its consequences for
underperformance places considerable weight on schools to focus on student test performance. A
desirable consequence of these accountability systems and one presumably sought after by
groups needing specialized attention. This has been supported by studies which show that some
schools and districts have responded to accountability by increasing instructional supports and
professional development for teachers in low performing schools, paying greater attention to
student engagement, and increasing per pupil expenditures (Dee & Jacob, 2010; Hannaway &
Stanislawski, 2005).
But, studies have also shown that test-based accountability pressure has shaped school
behavior in arguably perverse ways. In order to meet standardized test score targets and
performance standards, schools and districts have been found to manipulate or “game” student
performance through various approaches. Studies have shown schools gaming accountability
systems by increasing special education placements for low-performers, discharging students
without diplomas, disproportionately suspending low performing students during the
standardized testing periods, and cheating- changing student responses on scantrons before
computerized scoring (Figlio & Getzler, 2002; Heilig & Darling-Hammong, 2008; Figlio, 2006;
Sadler & Cohen-Vogel, 2017).
Though research has broadly documented the impacts of test-based accountability on the
behavior of schools and district personnel, no studies in peer-reviewed literature to date have
looked at student transferals to alternative schools as a potential avenue for gaming. The
enrollment of students in alternative schools, or schools which educate students who have been
identified as academically and/or behaviorally at risk has exceeded the growth rate of student
enrollment in regular public schools, growing in enrollment by 271% from 1990 to 2014
compared to regular public school enrollment which grew only 21% over the same timespan
(NCES, 2016). Additionally, the latest national survey of alternative schools reports that
space limitations which indicates that the demand for alternative schools exceeds the current
supply. Studies examining potential drivers of this growth are limited. Particularly, no studies
have explored whether the test-based accountability brought forward under No Child Left
Behind is causally related to growths in the number of students enrolled in alternative schools,
presenting a critical gap in both the literature on alternative schooling and that on the impacts of
accountability on school behavior.
Brief Background on Alternative Education in the United States
Understanding the present-day context of alternative schooling as a potential avenue for
gaming calls for an examination of the evolution of alternative schooling from an educational
choice model to schools that enroll students who have been deemed at-risk of educational failure.
Alternative education in the United States emerged in the 1960’s as an educational choice model
and a schooling alternative for students of color attending under-resourced traditional public
schools. Alongside these schools, other alternative schools emerged with the ideas that the
education received in traditional public schools was inadequate for student development and
stifled creativity and learning. These schools took many forms including freedom schools,
multicultural schools, open schools, and magnet schools. Apart from magnet schools, the
popularity of these schools decreased and the 1980’s saw a rise in the number of structured,
remedial alternative schools which emphasized teaching the basics to disruptive and failing
students (Lange & Sletten, 2002; Atkins & Bartuska, 2010). Alternative education today has not
strayed far from this model with many states creating alternative schools and programs for
students deemed academically and behaviorally at-risk.
As the prevalence of alternative schools grew, three classifications of these schools
those needing a more challenging curriculum. Students opt-in to Type I schools and the most
popularized form of Type I schools are magnet, charter and experienced focused schools. Type II
schools focus on academic remediation and discipline where students do not typically choose to
attend, but are instead referred from a base school. At these schools a limited curriculum is
offered with a focus on teaching the basics. Type III schools target specific student populations
and offer counseling, access to social services, and academic or social remediation. Like Type I
schools some Type III programs let students opt in (i.e. schools catering to students who had
previously dropped out and decided to return to school). This alternative school typing guide
exists as an overview of alternative education classifications, but schools classified as alternative
do not always fall neatly into these categories and it is often difficult to distinguish Type II and
Type III schools as some Type II schools offer counseling and social service access to students.
The definition of alternative education used by the U.S. Department of Education encompasses
programs classified as Type II or III as schools:
“designed to address the needs of students that typically cannot be met in regular schools.
The students who attend alternative schools and programs are typically at risk of educational
failure (as indicated by poor grades, truancy, disruptive behavior, pregnancy, or similar factors
associated with temporary or permanent withdrawal from school) (NCES, 2010, pg.1)”
State definitions of alternative schools mirror with the national definition, using wide
criterion to define what constitutes an alternative school and who these schools serve. A
comparative study of alternative education programs by Carnine and Barret (2004) found that
states were similar in their usage of “turnaround language,” noting that alternative education
guidelines in the twelve states case-studied emphasize redirecting “at-risk” students’ lives. This
recommended to enroll in these programs. They argue that vague definitions of alternative
education increase the probability of inequity in alternative education enrollments as it is
difficult to distinguish programs seeking to improve the educational outcomes for enrolled
students and those seeking to separate undesired, “at-risk” students from regular classrooms
(Gregg, 1998).
Alternative Education and Red Flags for “Gaming”
There are a number of characteristics of alternative education that point to its
susceptibility to gaming. These signs include lack of evidence-base on the efficacy of these
programs, overrepresentation of educationally disadvantaged groups, and the discretionary
nature of student transfers. These characteristics and practices may increase the chances that
alternative schools are being used as a release valve for underperforming students as they can
indicate negligence in regards to the integrity of these programs.
The rampant growth of alternative education programs is of concern because there is no
strong evidence-base on the efficacy of these programs. Alternative education programs vary
widely in their practices and studies on individual programs are only generalizable to the schools
studied. Evidence from studies of individual schools suggest that alternative education can have
small, positive effects on student’s attitudes toward schooling, but no significant impact on
standardized test performance or grade point average (Atkins & Bartuska, 2010). In an
evaluation of alternative education programs in the Wake County Public School System
(WCPSS), a large district in North Carolina, Landberg and Story (2013) found that WCPSS was
allotting more seats for these programs without formal evaluation of the effects of alternative
school enrollment on student achievement. In reviewing data, they found that only 27.2% of
graduation rate for students enrolled in these programs was 60.2%. This expansion of alternative
education without formal evaluations of student outcomes and effectiveness may also be the case
in other states and school districts. Alternative schooling programs in California enrolled 10% of
public high school students, and alternative schools in California similar to WCPSS, report
relatively high dropout rates (Hill, 2007). Evaluations of alternative schooling that look at
student achievement as an outcome find that student performance outcomes vary by site (Lange
& Sletten, 2002; Lehr, Tan & Ysseldyke, 2009) and currently there is little research on what
makes successful programs stand apart from others.
Alongside lack of empirical evidence on the effectiveness of these programs are concerns
about the enrollment demographics in alternative education programs, specifically the
overrepresentation of students of color, low-income, and special education students. In a study of
race and alternative schooling, Verdugo and Glenn (2006) found that the percentage of minority
students in a school district is associated with the presence of alternative schools. They found
that 47% of districts where racial minorities are less than one-third of the school district
population had the presence of an alternative school whereas 76% of districts where racial
minorities are greater than one-third of the district population had an alternative school. Looking
at poverty concentration in a school district as a predictor of alternative school presence they
found that high-poverty districts are more likely to have an alternative school than low-poverty
districts. These findings match national data on alternative schools where districts more likely to
have alternative education programs have a larger population of students of color and higher
poverty concentrations than other districts. These districts are also more likely to have students
One of the most notable characteristics of alternative schooling that point to its
susceptibility to gaming is that the transferal of students to alternative schools is left largely to
the discretion of teachers and administrators in a base school. A large body of research on the
unintended consequences of accountability has focused on instances where schools have reacted
to test-based accountability pressures by manipulating the testing pool, excluding students from
testing who are deemed less likely to meet proficiency standards (Jacob, 2005; Figlio & Getzler,
2002; Figlio, 2006; Leilig & Darling-Hammond, 2008). Students who attend alternative schools
are transferred out of a regular school or a base school primarily by recommendation from school
staff. These students are more likely to be identified as needing academic intervention, and the
standardized testing scores reported by alternative schools fall below those of regular public
schools (NCES, 2010). When students are transferred into an alternative school, their base school
is no longer responsible for their test score achievement. In effect, creating a release valve for
schools under testing pressure to exclude the test scores of high-risk students.
The latest national study of alternative schools and programs reveal that student
placement in alternative school settings is to a moderate or large extent based on
recommendations from school staff. 75% of schools surveyed reported that input from school
personnel plays a large role in student transfers. Examining the reasons students are transferred
into alternative schools, Booker and Mitchell (2011) studied alternative school transferals in
three large school districts in the Southwest. They found that 80% of students sent to an
alternative school during the study period were placed due to administrative discretion meaning
that the reasons students were being sent to the school was not based on administrative
precedence or standards. These discretionary transfers create the possibility that administrators
underachievement, a red flag for gaming the accountability system through manipulating the
testing pool by transferring underperforming students out.
Policy Significance of Prospective Results
This possibility that alternative school transfers could be an unintended consequence of
test-based accountability standards guides the relevancy of this study where I will examine
whether or not the onset of NCLB test-based accountability affects enrollment in alternative
schools. By examining the onset of national test-based accountability standards as a potential
driver of the growth in alternative school usage, study findings will aid policymakers in making
informed decisions about alternative schooling, a subset of education policy that has largely been
forgotten in discussions of educational achievement and accountability.
The results of this study will directly impact discussions on the effects of accountability
at the national, state, and local level. Should study findings suggest a causal relationship between
the onset of test-based accountability and the number of students enrolled in alternative schools,
policymakers may want to reconsider the effects of accountability on how school districts utilize
and administer this school type. These findings may encourage district administrators and
policymakers to reexamine protocol and policy on the transferal of students to alternative
education setting which may address gaming behavior in schools by holding regular schools
more accountable for student transfers to alternatives.
Study findings showing an opposite or insignificant relationship will also have important
implications. Findings showing that the onset of test-based accountability has not been a driver
of alternative school enrollment may be interpreted as positive. This suggests that schools may
promote an alternate course of action in regards to policies on alternative schooling. Directing
attention toward alternative school transfers as an education practice vulnerable to malpractice
may encourage support for future studies on the outcomes of students enrolled in these programs
and which may address the urgent need for the development of a best-practices model for
alternative education.
Roadmap
This study will focus on the following research question: what is the relationship between
the onset of No Child Left Behind and the enrollment of students in alternative schools? Chapter
2 will discuss extant research on the effects of test-based accountability on student achievement
and school behavior, building the theoretical foundation for examining alternative education as a
potential gaming mechanism. Chapter 3 will outline the study design, explaining in-depth the
data sources and methods employed in this study. Chapter 4 will report results, describing major
findings from the statistical model. Chapter 5 will tie together the summary of findings, discuss
the limitations of the study, implications for educational policy, and suggestions for further
Chapter 2: Literature Review
In this literature review I will explore three main bodies of research. First, I will
synthesize the current knowledge on the effects of test-based accountability on reading and math
achievement which offers insight into modeling the effects of NCLB on other policy relevant
outcomes. Second, I will discuss Campbell’s law of social decision making as a framework for
understanding gaming behavior and will synthesize findings from studies showing gaming as an
unintended consequence of accountability standards. I will end by discussing the extant literature
on gaming and student transferal to alternative schools, discussing ways that the empirical design
employed in this study will fill gaps in the existing research.
NCLB: Effects on Reading and Math Achievement
Studies examining the impact of No Child Left Behind on reading and math achievement
provide key information on the national impacts of this policy on the desired outcome and
statistical designs for examining the effects of accountability policies. Test-based accountability
policies approached nationwide policy in stages. Before NCLB expanded test-based
accountability nationwide, states set their own accountability standards with 45 states publishing
school report cards, and 27 rating or identifying low-performing schools. One of the major
studies on the impact of test-based accountability examines the effect of state-based
accountability on student outcomes. Exploiting the varying degrees of accountability pressure in
states before NCLB’s passage, Carnoy and Loeb (2002) constructed a “strength of
accountability” scale defining states as “0” if they do not test students statewide or have
statewide test performance standards and “5” if the state sanctioned and rewarded schools or
districts based on test scores. Using federal test score data from the National Association of
the strength of accountability scale by two steps predicted an improvement math performance for
all students and showed significant improvements for Black and Hispanic students. This
examination of the impacts of accountability before NCLB served as a launching point for
subsequent studies examining the impact of accountability after NCLB adoption.
One of these studies which examined the national effects of NCLB on student
achievement was performed by Dee and Jacobs (2011) whose study design utilized the varying
degrees of accountability in states pre-NCLB to estimate the treatment effect of NCLB’s
enactment. Using a strength of accountability scale, they sorted states into respective treatment
and comparison groups and compared NAEP scores. States were sorted into a treatment group if
they had weak accountability systems before NCLB and into the comparison group if the states
had stronger, more robust accountability systems. They argue that states with weak
accountability systems will be treated more by the enactment of NCLB than states that had
stronger systems before NCLB. Additionally states with strong accountability systems allow
their model to net out other influences that affect student achievement. They found that NCLB
generated large and statistically significant increases on 4th grade math achievement and
moderate improvements in math achievement for 8th grade students. Results showed no reliable
evidence for gains in reading. Further, states that had weak systems of accountability scored
higher on the NAEP exam compared to states that already had accountability system. These
findings on the positive effects of NCLB on math scores are corroborated in a similar study by
Wong, Cook, and Steiner (2011) who compared NAEP scores for public schools before and after
NCLB using private schools as a comparison group. Like Dee and Jacob (2011) they found that
Other studies have examined the impact of specific components of NCLB accountability.
Most relevant to this project are studies examining the role of accountability pressure on student
outcomes. One of the core components of the NCLB system of accountability, adequate yearly
progress, measured whether schools were meeting performance targets for the entire school and
student subgroups. If a subgroup (i.e. English Language Learners) did not meet progress in a
school, adequate yearly progress was not met and schools were identified for improvement and
as needing corrective action. Under this logic of accountability, this identification as a
low-performing school along with the threats of corrective action should incentivize school
improvement overall, and increase attention toward subgroups who are not meeting achievement
goals. Hemelt (2011) examines this phenomena by questioning the effects of the stigma of being
identified a failing school on year-to-year student performance in Maryland public schools.
Hemelt’s findings suggest that identification as a failing school appeared to negatively affect
student performance school-wide in math and reading the following year relative to if there were
no sanctions in place. However, study findings showed short-run improvements in reading and
math performance in schools that failed to meet AYP due to a specific subgroup. Math
performance for these subgroups improved, suggesting that there is a difference in the effects of
school-wide failure in schools where majority of students fail to make progress compared to
when schools fail to make progress due to a specific subgroup.
Taken together, these studies suggest positive impacts of test-based accountability on
student performance nationally, however these improvements are not distributed evenly. Study
findings suggest significant positive effects of accountability on student math performance with
little effect on student reading performance. Scholars suggests that this phenomenon may be
amongst students (Figlio & Ladd, 2015). Standardized tests, which are structured around
curriculum may only capture subjects tested, and math instruction is typically more standardized
than reading. Additional criticisms of this type of accountability are the usage of standardized
testing performance to sanction schools which lack resources and leadership to respond
productively, and the “gaming” of the testing system which has occurred as schools under
pressure attempt to meet the mandated testing targets (Figlio & Ladd, 2015).
Perverse Incentives and Unintended Consequences of Accountability
Beside the literature on impacts of accountability on student achievement are numerous
studies that examine the role testing performance pressure has played in influencing school
behavior. School and districts under pressure for students to meet testing goals have incentive to
“game” the testing system. In order to meet standardized test score targets, schools and school
districts have been found to manipulate student performance and testing scores through various
approaches. This “gaming” can be seen in various forms from changing the school lunch menu to
increase the caloric intake of students on test day (Figlio & Winicki, 2002) to influencing the
number of students diagnosed with ADHD to secure special testing accommodations (Bokhari &
Schneider, 2011). Test-based accountability has also been shown to influence school personnel
practices with Cohen-Vogel (2011) finding that to increase school test performance, principals
use student achievement data to hire, develop, and fire teachers. Schools under testing pressure
have also been found to cheat, with teachers discovered to have changed answers on student
score cards in many states (Jacob & Levitt, 2003). Studies examining teacher cheating practices
find evidence that schools under pressure to meet performance targets are more likely to cheat
Behind the various studies that examine gaming behavior as a result of test-based
accountability is the question: What aspects of policies encourage people to respond in ways that
are undesirable? In 1979, social scientist Donald T. Campbell put forward the following social
law:
“The more any quantitative an indicator is used for social decision-making, the more
subject it will be to corruption pressures and the more apt it will be to distort and corrupt
the social process it is intended to monitor (pg.85).”
Campbell (1979) gives many examples where this law can be applied, focusing on the
ways quantitative indicators can be vulnerable to corruption when used as a metric for success or
rewards. He first gives the example of employment offices that when evaluated on the number of
cases handled, became less effective in servicing clients in an effort to service more clients to
increase evaluation scores. He also gives the example of police corruption where departments
who were evaluated and rewarded on the number of cases solved, coerced defendants to plead
guilty to crimes that they may not have committed in an effort to gain points toward the solved
crime rate. Campbell also applies his law to education, and discusses the corruptibility of
achievement testing using the Texarkana performance contracting experiment as an example. In
this experiment contractors were paid on the basis of achievement test score gains of pupils. The
experiment found that to get the pay-off, contractors were teaching the test answers to students to
ensure increasing achievement test scores and a large payoff. In regards to the corruptibility of
using achievement tests to reward and sanction schools, Campbell offers the following analysis:
“From my own point of view, achievement tests may well be valuable indicators of
general school achievement under conditions of normal teaching aimed at general
their value as indicators of educational status and distort the educational process in
undesirable ways (pg.85).”
Campbell’s law, which came years before the first forms of test-based accountability,
aids in explaining gaming behavior in response to accountability and unintended consequences
of policies like NCLB which reward and sanction schools heavily based on the results of
quantitative test score indicators. Though gaming comes in many forms, particularly relevant to
this project are instances where schools and districts under pressure to meet testing targets
“game” the system by manipulating the testing pool, using various means to control which
students sit for the exam and in which subgroup their scores and counted. This form of gaming
has been studied across states and school districts with many studies finding that the onset of
accountability standards and its associated pressures were causally associated with gaming
through manipulating the testing pool.
Within the gaming literature, schools have been found to bolster student performance by
re-classifying students into the special education subgroup. Jacob (2004) found that after
test-based accountability policies were implemented in Chicago Public Schools, the number of
students classified in special education increased by eight percentage points. Figlio and Getzler
(2002) explored this phenomenon in greater detail, examining six, large, school districts in
Florida after the adoption of Florida’s Comprehensive Assessment Test (FCAT) and grading
system which rated schools with grade letters using FCAT scores as a major component of
determining school ratings. Under the FCAT accountability system, the scores of students who
fell into certain special education categories were not counted for the school’s score. Figlio and
Getzler tracked a cohort of students from 1991 to the 1999 adoption of the FCAT system. They
rate of disability classification in the six districts studied. Examining performance data from
schools, they found that schools threatened by low-performance were more aggressive in their
re-classification of students. Additional analysis of demographic and test score data of students
reveal that low-performing students were more likely to be reclassified even when taking
socioeconomic status into consideration.
Schools have also been found to manipulate the testing pool by retaining students in
untested grades. Leilig and Darling-Hammond (2008) studied a large, urban, district in Texas
called Brazos City School District (BCSD) for the purposes of the study. Texas, which adopted
an accountability system for public schools in 1993, was believed to be a model for policy
makers in support of NCLB. Under this accountability system, Texas used student test results to
rate and fund schools and as a deciding factor in determining school closure. To study the
impacts of accountability on BCSD, Leilig and Darling-Hammond tracked a cohort of 9th grade
students over a 6 year period. Using this longitudinal data, they found evidence that BCSD was
retaining low-performing students in 9th grade to prevent them from taking the high-stakes exam
given to 10th grade students. After retaking 9th grade coursework along with their 10th grade
courses, these students would advance to 11th grade without taking the high-stakes exam. Their
findings suggest a linear relationship between retaining students in untested grades and increased
performance on the high-stakes exams. These findings were supported by interviews with school
personnel where qualitative findings suggest that high-stakes testing culture in Texas has caused
principals to put “mechanisms in place” to deal with students performing below proficiency
(Leilig & Darling-Hammond, 2008).
Another mechanism for manipulating the testing pool to exclude student test scores
Figlio (2006) asked whether schools have used student discipline to bolster test performance. To
test this question, Figlio collected data on in school and out of school suspensions before and
after the adoption of Florida’s high-stakes accountability system. When comparing test scores of
students punished for the same incident, Figlio found that low-performing students were
suspended more frequently than their high-performing counterparts. Although low-performing
students are generally more likely to be punished, when compared to high-performers, Figlio
found that this gap in punishment severity grew significantly during the testing window.
Additionally, this disparity in suspensions was only observed for students in tested grades where
performance mattered most. He concludes that schools on the margins of being labeled a low
performing school may react by using student discipline to manipulate the aggregate school
score.
Altogether, these studies suggest that schools have responded to accountability in
arguably unforeseen and perverse ways. From manipulating student lunch menus to suspending
students before high-stakes testing, schools and school personnel under testing pressure have
attempted to “game” the system. Though these studies focus on specific states and districts and
may not be entirely generalizable to every state, the breadth and depth of the “gaming” literature
suggests that this behavior may not be limited only to the districts studied. The variability of the
focus of these studies also suggest that there may be mechanisms of gaming that have not yet
been studied. This gaming behavior should concern policymakers who support the transparency
provided from data on the performance of students and student subgroups. If significant portions
of members of a school or student subgroup are intentionally excluded, the achievement
information received from testing may not be as representative of the student population of
may be overlooked which may hinder school improvement and harm student performance
long-term. Accordingly, more studies investigating potential gaming behavior should be of interest to
policymakers as gaming may distort prior estimates of the effects of accountability and
contribute to misconduct toward students performing below proficiency.
Gaming, Accountability and Transferal of Students to Alternative Schools
No peer reviewed studies to date have examined whether test-based accountability has
altered the transferal of students to alternative schools. Since the manipulation of the testing pool
is a common occurrence in the “gaming” literature, transferring students to alternative schools is
another possible unintended consequence of accountability pressure. The closest examination of
this possibility is an investigation of alternative charter schools in Florida by the independent,
nonprofit newsroom ProPublica. Vogell and Fresques (2017), project leads, questioned whether
high-performing school districts in Florida were bolstering their performance by sending
low-performing students to the local alternative charter school, Sunshine High. Using federal data on
graduation rates in this district, they found that sending students to alternative schools correlated
with increased graduation rates for the sending schools. Examining data on how alternative
charter schools code for reasons students leave schools, they found that students who dropped
out of alternative schools school completely were miscoded as withdrawing to attend GED
programs. This faulty coding bolstered alternative school graduation data, presenting an illusion
that alternative schools have high graduation rates. Vogell and Fresques (2017) supplemented the
data with interviews of 32 students who had attended or left Sunshine High; they found that more
than half of the students sampled were sent to Sunshine due to academic performance. They
conclude that these findings support the idea that alternative education is used as a release valve
Though this study presents compelling findings on the frequency of recoding student exit
data and increases in graduation rates in surrounding schools, these data are only descriptive and
cannot determine whether pressures to meet performance standards are causally associated with
the transferal of students to alternative schools. This study is also limited in scope, because it
only examined potential “gaming” using alternative charter schools. Although alternative charter
schools are an important piece of the alternative school puzzle, majority of alternative schools
nationally are administered by public school districts (NCES, 2016). Further, since the
investigation took place in one large school district in Florida, the generalizability of these
finding to other states is threatened.
With knowledge that research on the effects of NCLB on alternative schooling is limited,
I seek to add to the extant literature by approaching this suggested relationship using a
comparative interrupted time series quasi-experimental research design. Using this causal
modeling I examine potential gaming behavior on a national scale, supplementing descriptive
Chapter 3: Methodology
I use a comparative interrupted time series (CITS) design to estimate the causal impact of
test-based accountability under NCLB on the enrollment of students in alternative schools. I
employ this research design in the spirit of Dee and Jacobs (2011) who utilized a CITS design to
estimate the impact of NCLB on national reading and math achievement. Dee and Jacobs
exploited the varying degrees of accountability within states before NCLB to sort states into a
treated and comparison group. The treated group of states had weak accountability systems
before NCLB and the comparison states had accountability standards with elements similar to
NCLB. In their application of the CITS design, the treatment effect of NCLB is the difference in
reading and math outcomes between the treated states and comparison states while the
comparison group netted out the effect of hard to observe factors (i.e. other educational reform,
market conditions) that may have confounded the relationship between NCLB and student
achievement. Similar to Dee and Jacobs’ (2011), I study the effect of NCLB at the national level
looking instead at its effects on alternative school enrollment making a CITS approach a natural
match for examining the relationship at hand. A key advantage to using the CITS is the ability to
estimate the causal effect of the onset of NCLB on alternative school enrollment. This approach
deviates from prior studies of alternative school enrollment and accountability which solely
examine the correlation between school enrollments and the onset of NCLB (Vogell & Fresques,
2017). Although these correlations share important descriptive findings they lack in their ability
to infer a causal impact. This CITS design fills in the gaps where descriptive studies have not
Selection of Treatment and Comparison Groups
Unlike an interrupted time series (ITS) design which compares pre and post trends after
an intervention for only a treated group, a CITS compares pre and post trends in an outcome of
interest between a treatment and comparison group. In a CITS, the impact of the policy is
estimated by evaluating whether the treatment group deviates from its baseline (pre-policy) trend
by a greater amount than the comparison group. In this study, I examine whether alternative
school enrollment in states that had weak accountability systems, and were thus “treated” by
NCLB deviates from its pre-NCLB trends by a greater amount than alternative school enrollment
in states that had consequential accountability systems before NCLB. A challenge with CITS as
applied to national policy, is the selection of an appropriate comparison group. To sort states into
treatment and comparison groups, I rely on the premise that NCLB had the strongest effect on
states that did not have strong accountability provisions in place before its passage. Using the
logic model outlined by Dee and Jacobs (2011), I expect that states that sanctioned and rewarded
schools based on standardized test performance prior to NCLB serve as a logical comparison
group since in many of states, the introduction of NCLB did not change accountability practices
because they already had similar practices in place.
I adopt Dee and Jacobs’ (2011) coding to identify states that had consequential,
state-based accountability practices before NCLB’s passage. Dee and Jacob’s identified states that had
consequential accountability systems using prior studies of accountability, Education Weeks’
Accountability and Assessment profile, surveys of state assessment program information from
states’ Department of Education websites and interviews with state officials to confirm the
timing and existence of accountability policies. Using the coding, I sort states into treatment and
as the control group and states without consequential accountability systems serve as the
treatment group. In total, twenty states are in the treatment group and thirty states are in the
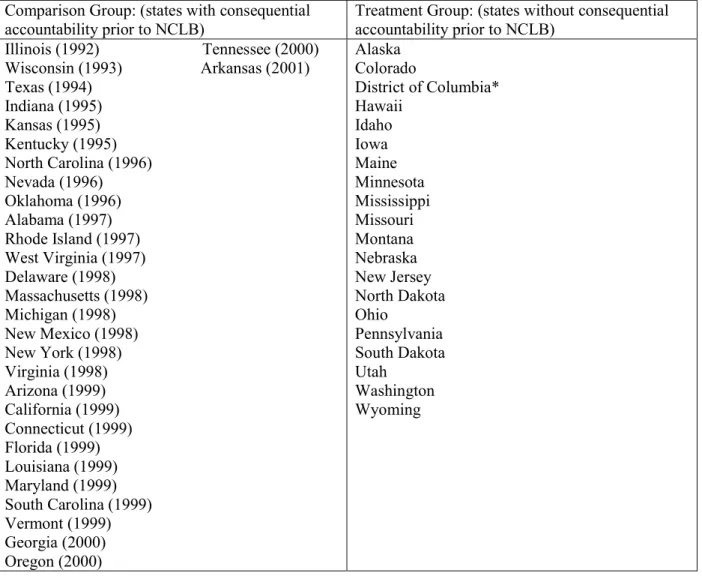
control group (see Table 1 for a list of states and their categorization).
Table 1. Comparison and Treated States for CITS Comparison Group: (states with consequential
accountability prior to NCLB) Treatment Group: (states without consequential accountability prior to NCLB) Illinois (1992) Tennessee (2000)
Wisconsin (1993) Arkansas (2001) Texas (1994)
Indiana (1995) Kansas (1995) Kentucky (1995) North Carolina (1996) Nevada (1996) Oklahoma (1996) Alabama (1997) Rhode Island (1997) West Virginia (1997) Delaware (1998) Massachusetts (1998) Michigan (1998) New Mexico (1998) New York (1998) Virginia (1998) Arizona (1999) California (1999) Connecticut (1999) Florida (1999) Louisiana (1999) Maryland (1999) South Carolina (1999) Vermont (1999) Georgia (2000) Oregon (2000)
Alaska Colorado
District of Columbia* Hawaii Idaho Iowa Maine Minnesota Mississippi Missouri Montana Nebraska New Jersey North Dakota Ohio Pennsylvania South Dakota Utah Washington Wyoming Outcome Variable
The outcome variable of interest is alternative school enrollment in each state. I draw
student enrollment for alternative schools from the National Center for Education Statistics
national, primary database for elementary and secondary schools and school districts. Student
enrollment data is reported to the CCD by state education agencies and collected annually for
each school through the Public Elementary and Secondary School Universe Survey for each state
and the District of Columbia.
To identify alternative schools, I reply on the CCD school-type codes which label schools
as regular, special education, vocational, or alternative/other. Using this coding, I draw
alternative school enrollment for each state between the years 1992 and 2014. A successful CITS
requires that data for the outcome of interest be available for at least four time points to establish
a baseline trend (Somers et al., 2013). The years selected exceed this requirement and captures
the state-based accountability and NCLB era. 1992 is ten years before NCLB’s passage and the
year of the emergence of the first state-based accountability system [see Table 1], 2002 to 2014
is the NCLB era where states without strong state-based accountability systems where introduced
to test-based accountability standards.
There are two threats to sample integrity that must be addressed before moving forward.
One threat to measurement integrity with using CCD to isolate alternative school enrollment is
that school type is self-reported by school districts to the CCD. Because state definitions of
alternative school classifications vary, districts may differ in what schools are reported as
alternative schools. CCD began auditing school type identifications in the 2007-2008 school
year. This risks that some schools classified as regular or vocational schools may be labeled as
alternative schools and vice versa which would result in a flawed enrollment sample. Juvenile
Detention Centers and Schools for the Deaf and Blind are also categorized as alternative/other
schools. I exclude enrollment data from schools entitled Juvenile Detention Facility or School for
Apart from detention facilities and schools for the Deaf and Blind, schools coded as alternative
will remain in the dataset and the alternative typing will be considered accurately reported data.
The second threat to sample integrity is fluctuations in student enrollment. Student
enrollment data for public schools is reported during the first few weeks of the school year.
While student enrollment data for regular public schools may remain fairly constant throughout
the school year, enrollment in alternative schools can vary widely between the first and last days
of the academic year. Because students can be transferred into and out of alternative schools
during the school year, enrollment numbers at the beginning of the school year may not reflect
enrollment during the middle or ends of the year. Unless this systematically differed in the
treatment and control group of states this would not bias estimates of the effect of NCLB,
however it is important to keep in mind that enrollments in these schools fluctuate. Sample data
would be strengthened by the ability to track enrollment data throughout different points of the
school year, however in the absence of this data, enrollment numbers reported at the beginning
of the year must be used.
Control Variables
One strength of the CITS design is its ability to control for differences between the
treatment and comparison group that may impact the outcome variable through the use of state
fixed-effects. The comparison group of states, which operate as a control group because they
were less treated by NCLB serve to net out the effect of hard-to-observe factors (i.e economic
conditions, and other educational reforms) that may influence alternative school enrollment.
While this design is able to account for invariant confounders, it is possible that
time-varying confounders may bias impact estimates. As a result, I also include a vector of control
Out of School Suspensions
Frequency of out of school suspensions is a probable time-variant confounder and serves
as a proxy for variations in school discipline. As alternative schools enroll students who are
identified as academically and behaviorally at risk, an increase in out of schools suspensions
impact alternative school enrollment by moving districts to open more seats in alternative
schools. I use out of school suspensions to control for the zero-tolerance era variations in student
suspensions. Zero tolerance policy was introduced in the 1980s to address weapon and drug
possession in schools. However, many schools began using zero-tolerance approaches to other
school issues including truancy, disrespect, and dress code (Martinez, 2009). The zero-tolerance
era has been criticized for permitting the over-usage of school discipline and schools have moved
to abandon the zero-tolerance approach. Alternative schools have also been used as a schooling
option for students suspended long-term. North Carolina, for example, ruled that students
suspended long-term must be offered access to alternative education (King vs. Beaufort County
Board of Education, 2010). Controlling for discipline allows for the netting-out of the effect that
variations in disciplinary policy and trends may play in influencing alternative school
enrollment.
I collect data on the number of students without disabilities suspended out of school for
each state for the available years 2000, 2004, 2006, 2009, 2011, and 2013. This out of school
suspension count includes the total of suspensions from students who have been suspended from
school once and those who have been suspended more than one time. These data are reported
from the U.S. Department of Education Civil Rights Data Collection. Out of school suspensions
for students with disabilities is not included in the Civil Rights Data for years 2000 and 2004,
years where data is not reported, I linearly predict missing values using observed values, creating
suspension predictions for missing years and an estimation of suspension trends for each state for
years 1992-2014.
Per Pupil Expenditures
I control for per pupil expenditures to net-out the effects of variations in funding levels
on student enrollment in alternative schools. The amount that states spend on educational
instruction, support services, salary, and additional educational expenditures may affect both
how states experience accountability and the number of students enrolled in alternative schools.
Public alternative schools operate as stand-alone schools and require funding for building
maintenance, school staff and supplies. I expect that the amount states spend per pupil may
impact the degree that states were impacted by test-based accountability. States with greater
capacity to respond to accountability may be those with greater funding levels which may impact
the ways states direct funding toward alternative schools.
Data on total per pupil expenditures for public primary and secondary education is
available for each state through NCES Common Core of Data. States report per pupil
expenditure data to the CCD. The per pupil expenditure amount is calculated by dividing total
expenditures by total public student membership during the fall of the reported year. The
measure excludes expenditures for equipment, non-public education, school construction, debt
financing, and community services. I collect total expenditure data for all states 1992-2014 and
Model
Using the CITS design, I create the following model:
Yst=β0+β1YEARt+β2NCLBt+β3(YR_SINCE_NCLB)+β4(Ts)+β5(Ts × YEARt)+β6(Ts ×
NCLBt)+β7(Ts × YR_SINCE_NCLBt)+β8(ppexpenditures)(suspensions)st+µ
where YST is the outcome variable of interest and is the natural log of student enrollment
in alternative schools (Y) in a given state (s) in a given year (t). The coefficient β0 represents the
intercept or starting level of alternative school enrollment for the comparison group or states that
did not adopt consequential accountability prior to NCLB. YEARt is a trend variable which
defines the periods of measurement where YEARt-1992 takes on a value of 0 and YEARt-2014
takes on a value of 22. The coefficient β1 measures the growth of alternative school enrollment
for the comparison group from 1992 until the start of NCLB. NCLBt is a dummy variable equal
to 1 for observations during the NCLB era and 0 for observations before NCLB’s passage. For
the purposes of this study, NCLB is defined as beginning in 2002. The coefficient β2 estimates
the level shift in enrollment after the adoption of NCLB or differences in alternative school
enrollment for the comparison group of states immediately after NCLB’s enactment. The
variable YR_SINCE_NCLB defines the treatment period, or years following NCLB and takes on
a value of 1 for the 2003-2004 school year which corresponds to alternative school enrollment
percentage totals for 2003. The coefficient β3 estimates the trend of the percentage of students
enrolled in alternative schools for the comparison group of states during the NCLB era.
After including coefficients with variables that delineate the years of observation and
define a treatment period for NCLB for the comparison group, I include Ts to model the effect of
being treated by NCLB. Ts when standing alone acts as a dummy variable that is defined for
estimates the level difference in intercept, or starting gap, between student enrollment in
alternative schools in states with and without consequential accountability prior to NCLB. Ts ×
YEARt is the interaction effect between the year of an observation and the treatment assignment.
The coefficient β5 estimates the difference in slope between the treated group of states and
comparison group of states prior to NCLB. TxNCLB is the interaction between treatment
assignment and the adoption of NCLB. Β6 estimates the difference in level between the number
of students enrolled in alternative schools within the treated states and comparison states
immediately following the adoption of NCLB. T×YR_SINCE_NCLB is the interaction effect
between treatment assignment and the years following NCLB adoption. B7 estimates the
difference between the slopes of the number of students enrolled in alternative schools for the
treated and comparison states after the adoption of NCLB.
Ts × NCLBt and Ts × YR_SINCE_NCLB work together to estimate the total treatment
effect of NCLB, pinpointing the effects of being treated by NCLB at a specific year. Using this
model, the total estimated NCLB effect for the year 2005 is β6+3 × β7. The variables
X(ppexpenditures)(suspensions)ST include the logged vector of controls which nets out potential
confounding effects of school discipline and per pupil expenditures on alternative school
enrollment. B8 estimates the impact of these controls on alternative school enrollment.
This CITS model estimates the basic effect of being treated by NCLB on student
enrollment in alternative schools without accounting for the effect of the years in which states
adopted accountability standards. Dee and Jacobs (2011) suggest that the effects of NCLB may
be more accurately measured if considered within the framework of a dosage model. A number
of states in the comparison group adopted accountability standards within 4 years or fewer of
the possibility of being treated by NCLB more than states that adopted accountability standards 5
or more years before NCLB was enacted. Therefore the binary definition of Ts may downwardly
bias the effects of NCLB on alternative school enrollment.
This considered, one solution to this issue is to drop states from the sample which
adopted accountability standards within a few years of NCLB enactment. However, this
approach leaves room for bias by requiring decisions about which states to exclude and what
years are considered too close to the enactment of NCLB. A stronger alternative and that used by
Dee and Jacobs (2011) is to redefine Ts as the number of years that a state went without prior
consequential accountability between the 1992-1993 academic year and the adoption of NCLB.
Under this approach Ts would be highest for states that had no accountability whatsoever prior to
the onset of NCLB (i.e. 10) and smallest for Illinois who implemented its state-based
accountability during the 1992-1993 school year (i.e. 0). Under this approach, the effect of
NCLB is grows larger as the value of Ts grows. Using a dosage model, the total estimated NCLB
effect on alternative school enrollment can be estimated taking into account both when a state
introduced accountability the effect of NCLB on enrollment at a specific year. For example, the
estimated impact of NCLB as of 2010 corresponding to a state that adopted accountability
standards in 2000 is β6 + 64 × β7, assigning a larger NCLB effect than the binary model since the
state adopted accountability closer to NCLB enactment. I will discuss results from modeling the
treatment effect as binary and as a dosage model in the Results section that follows my
discussion of threats to internal validity.
Threats to Internal Validity
For this CITS, internal validity is compromised if a determinant of alternative education
group of states. To check for systematic bias, I run a regression analysis using the CITS equation
where the dependent variable of interest is the effect of the onset of NCLB on time-variant
predictors of alternative school enrollment: per-pupil expenditures and out of school suspensions.
This will estimate the effect of NCLB’s enactment on these measures and provide evidence on
whether these factors systematically varied between states with the onset of the policy. I find that
out of school suspensions (p=.660) and per pupil expenditures (p=.836) did not vary significantly
between the treated and comparison states with the onset of NCLB suggesting that the analysis
Chapter 4: Results
General Findings
Findings suggest that the initial adoption of NCLB had little effect on the enrollment of
students in alternative schools. Both models, one which measures the treatment effect as binary
and the other which measures it as continuous, suggest that effects of NCLB on alternative
school enrollment at the adoption year is insignificant (p=.96 and p=.45). The standard CITS
model and CITS analyses which control for the effects of per pupil expenditures suggest that
NCLB accountability pressure had the greatest impact on alternative school enrollment in the
years following NCLB adoption. For these models, the estimated effect of being treated by
NCLB in the years following enactment is significant in the dosage model (p=.03 and p=.025)
and approaches significance in the non-dosage model (p=.12 and p=.105). These models suggest
that accountability pressure is casually attributed to a 6 to 8 percent increase in alternative school
enrollment per year. This relationship is sensitive to the inclusion of out of school suspensions as
an additional control, motivating further analysis on the role of out of school suspensions in
transfers to alternatives. Analyses suggest that out of school suspensions may be an intermediate
pathway through which students are sent into alternatives
NCLB Adoption and Effects During NCLB Era
Regression analyses for both models suggest that the most significant impact of
accountability pressure from NCLB occurred in the years following adoption. No significant
NCLB effect is observed at the adoption of the policy (2002) across all regressions, and impacts
of NCLB-era accountability pressures are seen most significantly in the years following
model. The non-dosage model assigned states to treatment and comparison groups on the basis
of whether or not a state had accountability standards before NCLB’s enactment and the dosage
model assigned a treatment effect to states based on the number of years that a state went without
accountability standards. The dosage models may provide more plausible estimates of the
treatment effect because it takes into account the degree to which a state may be treated by
NCLB. This model takes into account a state’s capacity to respond to accountability, suggesting
that states adopting accountability closer to NCLB enactment (i.e. 2000) are treated by the policy
more than states which adopted accountability ten years before NCLB’s passage (i.e. 1992).
CITS analysis without the inclusion of control variables (Model 1) suggests that at
enactment of NCLB, alternative school enrollment declined approximately four percent in the
non-dosage model (p=.80) and .4 percent per the number of years that a state went without
accountability in the dosage model (p=.86). In the years following adoption, the non-dosage
model suggests that alternative school enrollment grew 3.5 percent per year (p=.13) due to the
impacts of accountability pressure from NCLB. The dosage model suggests enrollment grew .84
percent per year, for each year that a state went without accountability (p=.03). Using the dosage
analysis to analyze the impact of NCLB for states which adopted accountability in 1999,
modeling predicts a 6% growth in enrollment due to accountability pressures.
Controlling for per pupil expenditures in the second multivariate regression (Model 2),
marginally increases the magnitude of the yearly treatment effect. Using this model, the growth
rate of alternative school enrollment due to the impact of NCLB accountability pressure is
approximately 4 percent per year for the non-dosage model and .9 percent per year for each year
that a state went without accountability for the dosage model. For both models, the values are
Notes: Output and Controls are Logged Variables ***p<.001; **p<0.05;*p<.1 (P-Values in Parenthesis) Estimations include state fixed-effect
Non-Dosage Model Dosage Model
Ts=no prior accountability Ts=years without prior school accountability
Model 1 Model 2 Model 3 Model 1 Model 2 Model 3
Enrollment growth for comparison states until NCLB adoption
Level shift in enrollment at NCLB adoption for comparison states
Enrollment trends during NCLB era for comparison states
Level difference in intercept between treatment and comparison states
Difference in enrollment growth between treated and comparison states until NCLB adoption
Level difference between treated and comparison states at NCLB adoption
Difference in growths in alternative school enrollment during NCLB era
Per Pupil Expenditures
Out of School Suspensions
Intercept
R2
0.0975*** 0.109*** 0.0963*** 0.125*** 0.138*** 0.106**
(0.00) (0.00) (0.00) (0.00) (0.00) (0.001)
-0.0330 -0.0190 -0.0575 -0.0770 -0.0670 -0.214
(0.712) (0.833) (0.549) (0.688) (0.727) (0.334)
-0.130*** -0.135*** -0.120*** -0.176*** -0.183*** -0.146***
(0.00) (0.00) (0.00) (0.00) (0.00) (0.00)
-0.299 -0.294 -0.0389 -0.0881 -0.0877 -.0638
(0.576) (0.571) (0.931) (0.337) (0.325) (0.445)
-0.0231 -0.0242 -0.0120 -0.00505 -0.00518 -0.00202
(0.225) (0.206) (0.588) (0.119) (0.111) (0.559)
-0.0372 -0.0353 -0.00793 -0.00434 -0.00516 0.0214
(0.803) (0.813) (0.960) (0.864) (0.839) (0.457)
0.0350 0.0374 0.0246 0.00844** 0.00878** 0.00502
(0.126) (0.105) (0.322) (0.031) (0.025) (0.274)
-0.244
(.331) (0.544) -0.154 (0.277) -0.263 -0.155 (.539)
0.103
(0.136) 0.130* (.069)
that accountability pressure under NCLB had the most significant effect on alternative school
enrollment following NCLB enactment.
Including out of school suspensions within the multivariate model (Model 3) reduces the
significance of the estimated yearly treatment effect for the non-dosage and dosage models.
Controlling for per pupil expenditures and out of school suspensions, the effects of
accountability pressure are found to be insignificant with pressure associated with an increase in
alternative school enrollment of 2.5 percent per year for the dosage model (p=.322) and .5
percent per year for year each that a state went without accountability for the non-dosage model
(p=.274). The lack of significance of these estimates render two plausible hypotheses:
1. Out of school suspensions confound the relationship between accountability pressure
and alternative school enrollment, being an alternative and more plausible
explanation for changes in alternative school enrollment
2. Out of school suspensions work as an intermediate or pathway mechanism, working
between accountability pressure and alternative school enrollments
Pathway Mechanism: Suspensions, Accountability Pressure, and Enrollments
Analyses suggests that accountability pressure may work through out of school
suspensions as a pathway through which students are sent into alternatives. To test for whether
an intermediate effect exists, I use the CITS model to predict the impact of accountability
pressure on out of school suspensions. I find that accountability pressure significantly increased
the percentage of students suspended out of school in a pattern that mirrors the effects of
accountability pressure on alternative school enrollment. At the initial adoption of NCLB,
dosage models (p=.558 and p=.385, respectively). However, accountability pressure has a
significant impact on the number of students suspended out of school in the years following
NCLB adoption. For the non-dosage model, accountability pressure is associated with a 6
percent increase per year in the number of students suspended out of school (p=.00) and a 1
percent increase per year in the number of students suspended out of school for each year that a
state went without accountability for the non-dosage model (p=.00).
To take the analysis a step further, I run a Pearson’s Correlation Test, to test the linear
correlation between alternative school enrollment and out of school suspensions. The correlation
analysis suggests that out of school suspensions and alternative school enrollment are
moderately, positively correlated (r=.55). Findings from the CITS and Pearson’s Correlation
analyses render support for the idea that accountability pressure may influence school behavior,
causing schools to alter disciplinary patterns by suspending students out of schools and into