Gut microbiota in relation to glycemic status in rural & urban Chinese people by
Yongkyum Kim
Honors Thesis Department of Nutrition University of North Carolina
2017
Approved:
______________________________ Advisor: Penny Gordon-Larsen, PhD
Introduction
After the human genome project yielded the discovery of only 20,000 protein coding genes, research on the microbiota, the microorganisms found in and on humans, have grown. In particular, the gut microbiota, which outnumbers human’s cells by 10 times, is a recent topic of interest [1]. By looking at the greater abundance of microbes, researchers theorized that the interaction of human genes with this greater population leads to complex human life [1, 2]. To understand the nature of human diversity and disease, we must study the microbes that are so prevalent.
Studies have shown long-term dietary intake influences the human gut microbiome [3]. A study on 18 people found that by comparing 4 days of their diet by total protein, carbohydrate, and insoluble fiber intake, the structure and function of their gut microbiome was significantly associated with dietary intake [4]. Different diets as well, such as switching from a low-fat diet to a high-fat, high-sugar “Western” diet changed the microbiota and its gene expression [5]. The biochemical mechanisms behind these changes are just beginning to be understood. Studies have shown that gut microbiota extract nutrients and energy from the diet and play a role in gut health and disease through production of metabolites and maintenance of gut integrity [6, 7]. The
Bacteroidetes phyla, for example, have been shown to include bacteria that have several carbohydrate utilization pathways [8]. Decreasing nutrients in a diet produces measurable
Understanding these processes is critical because as microbiota changes, it affects health outcomes. An experiment on humanized mice found switching from a standard low-fat, plant polysaccharide-rich diet to a Western diet changed fecal microbiomes within a day [7]. By transplanting Western diet mice’s microbiota into previously normal mice, the lean germ-free mice gained a greater fat disposition characteristic within 2 weeks [7]. In addition to obesity, the gut microbiome has been implicated in the pathways to circulatory disease [9], autism [10], and diabetes [11]. Inflammation in metabolic processes has been shown to lead to metabolic syndrome, obesity and diabetes [8]. Indeed, it has been hypothesized that bacterial
lipopolysaccharides from gram-negative bacteria within the Bacteroidetes and Proteobacteria phyla may be the trigger for this inflammation [12].
Given that altering specific groups of gut microbiota is associated with obesity and diabetes, identifying phyla associated with certain diseases is being explored. The mechanisms proposed linking gut microbiota to obesity and diabetes through chronic endotoxinemia [12] and modulation of gut-derived peptide secretion [13] suggest Bacteroidetes, Firmicutes,
plasma glucose but not with BMI. This could indicate that obesity and diabetes are associated with different groups of gut microbiota [17]. Other studies have found contrasting results for Proteobacteria; one showing a negative correlation between abundance and diabetic phenotype against the finding of high abundance of Proteobacteria in patients with metabolic diseases [16,18].
Although these phyla of bacteria, Firmicutes, Bacteroidetes, Proteobacteria, and
Actinobacteria have been studied with relation to diabetes, how microbiota vary in populations experiencing rapid urbanization is now well studied. Transitioning from traditional rural to Westernized urban lifestyles is associated with altered diet, decrease in physical activity, and increased risk of diseases [19]. How the gut microbiota changes and how this affects disease risk is still being explored. Increasing knowledge of how urbanization in China associates with differences in the microbiome by contrasting urban and rural individuals living in similar regions may be informative since previous studies have made such contrasts across different countries and regions. The objective of this study is to examine how glycemic status is associated with differences in the bacteria abundance in a similar region of southern China while thinking about what role rural/urban status plays. Using linear regression, the Firmicutes, Bacteroidetes,
Proteobacteria, and Actinobacteria abundances in individuals with elevated versus normal HbA1c was examined.
Methods
Participants
excluded if they had lived in those communities for less than 2 years, had been diagnosed with cancer, reported antibiotic use in the past three months, or were pregnant or lactating at the time of the exam.
Data Collection
China CDC data collectors recorded participant characteristics during 3 day house visit and collected fecal samples. Sequencing of microbiome was performed by the Beijing Genomics Institue-Shenzhen, using an Illumina MiSeq PE250 for 16S rRNA sequencing targeting the V4 hypervariable region. 16S rRNA sequencing reads were then classified using the Ribosomal Database Project classifier. Sequencing was completed using fecal samples collected at two time points, separated by two weeks. This was a UNC IRB approved study for data collection and analysis of microbiome and phenotypic data [20].
Data Analysis
All data analysis was completed using STATA version 14 (StataCorp). Significant differences in the urban versus rural participants were quantified. Contrasting individuals with normal (<5.7%) versus elevated (≥5.7%) HbA1c levels were similarly found. A linear regression was used to estimate differences in phyla Firmicutes, Bacteroidetes, Proteobacteria,
rural/urban status: a change-of-estimate greater than 10% was considered evidence of meaningful confounding.
Results
Sociodemographic
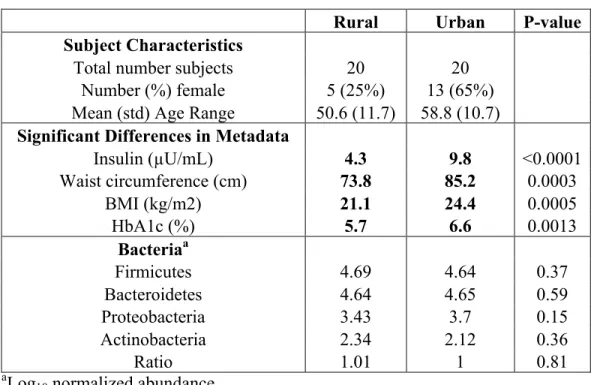
Sociodemographic characteristics for all 40 participants in the study by rural and urban status are shown in Table 1. Urban subjects had statistically significantly greater insulin, waist circumference, BMI, and HbA1c levels than rural participants. We found no significant differences in rural versus urban bacteria abundance using Wilcoxon signed-rank test.
Bacteria
In all 40 subjects, the Firmicutes and Bacteroidetes phyla were dominant in the fecal samples, consisting of greater than 90% of total bacteria abundance. (Table 2)
Regression Model
also found. At least 350 people (175 rural, 175 urban) would be necessary for all models to have 0.80 power.
Effect Modifier
Rural urban status as an effect modifier was tested using interaction terms in the models of bacteria (log10) = HbA1c status (normal or elevated) + Rural/Urban status (rural or urban) + HbA1c status * Rural/Urban status (interaction term) (Table 4). We made four comparisons: normal HbA1c and rural, elevated HbA1c and rural, normal HbA1c and urban, and elevated HbA1c and urban. All interaction terms were found to be not significant. The interaction term was removed from the model and rural/urban was looked at together instead of by stratifying.
Confounding
Rural/urban status as a confounder (Figure 1) was tested using the models of bacteria (log10) = HbA1c status (normal or elevated) + Rural/Urban status (rural or urban) (Table 5). The coefficient for change in HbA1c status was measured and compared to the previous models not controlling for rural/urban status. The percent change of all models exceeded 10%.
Discussion
with elevated HbA1c had lower abundances of Firmicutes, Actinobacteria, and ratio of
Firmicutes to Bacteroidetes but higher abundances of Bacteroidetes and Proteobacteria compared to normal HbA1c level individuals. Rural/urban status as an interaction term with HbA1c status was found to be statistically insignificant. Controlling for rural/urban status changed coefficient for change in HbA1c status greater than 10%, indicating confounding [21].
These findings support previous research on gut microbiome and diabetes. Our Chinese subjects had similar pattern of higher BMI in urban participants as another study using data from the China Health and Nutrition Survey [22]. In line with our findings, Frank et al. similarly found that Firmicutes, Bacteroidetes, Proteobacteria, and Actinobacteria dominated gut bacteria in 190 gastrointestinal tissue samples. The abundance differences in elevated HbA1c subjects in
Firmicutes, Bacteroidetes, Proteobacteria, and the ratio between Firmicutes and Bacteroidetes that we found were consistent with a study of 36 Danish men examining phyla abundances in adult type 2 diabetics versus nondiabetics [17, 24]. However, we found lower abundances of Actinobacteria in our elevated HbA1c subjects when the Danish study found no difference in diabetics versus nondiabetics [17].
increases disease risk will require long-term, greater studies in larger samples. Because our study did not examine smaller taxonomies abundance differences or the diversity of the gut microbiota, further research is required to understand the results of this analysis.
Conclusion
This study on 40 subjects examined associations between abundance of microbiota with HbA1c in urban versus rural individuals living in Hunan province, China. Firmicutes and Bacteroidetes were the dominant phyla in both urban and rural participants. The abundance of Firmicutes, Actinobacteria, and the ratio of Firmicutes to Bacteroidetes was lower while the abundance of Bacteroidetes and Proteobacteria were higher in elevated HbA1c level subjects than normal HbA1c level subjects. Rural/urban status was found to act as a confounder instead of an effect modifier; however our models of Bacteroidetes, Proteobacteria, Actinobacteria, and ratio of Firmicutes to Bacteroidetes were underpowered in our exploratory analysis and should be confirmed in larger samples. How rural/urban status acts to affect the microbiome, whether because of differences in diet, physical activity, or clustering are also in need of further research. Our results suggest a hypothesis that a difference in HbA1c levels is associated with differences in the microbiome after adjusting for urban/rural status as a confounder. These exploratory findings may help to understand differences in the microbiome between rural and urban subjects that can be attributed to HbA1c levels.
References
2. Gill SR, Pop M, Deboy RT, et al. Metagenomic analysis of the human distal gut microbiome. Science. 2006;312(5778):1355-9.
3. Turnbaugh PJ, Bäckhed F, Fulton L, Gordon JI. Diet-induced obesity is linked to marked but reversible alterations in the mouse distal gut microbiome. Cell Host Microbe. 2008;3(4):213-23.
4. Muegge BD, Kuczynski J, Knights D, et al. Diet drives convergence in gut microbiome functions across mammalian phylogeny and within humans. Science. 2011;332(6032):970-4.
5. Jumpertz R, Le DS, Turnbaugh PJ, et al. Energy-balance studies reveal associations between gut microbes, caloric load, and nutrient absorption in humans. Am J Clin Nutr. 2011;94(1):58-65.
6. Round JL, Mazmanian SK. The gut microbiota shapes intestinal immune responses during health and disease. Nat Rev Immunol. 2009;9(5):313-23.
7. Turnbaugh PJ, Ridaura VK, Faith JJ, Rey FE, Knight R, Gordon JI. The effect of diet on the human gut microbiome: a metagenomic analysis in humanized gnotobiotic mice. Sci Transl Med. 2009;1(6):6ra14.
8. Devaraj S, Hemarajata P, Versalovic J. The human gut microbiome and body metabolism: implications for obesity and diabetes. Clin Chem. 2013;59(4):617-28.
9. Holmes E, Loo RL, Stamler J, et al. Human metabolic phenotype diversity and its association with diet and blood pressure. Nature. 2008;453(7193):396-400.
11. Brown CT, Davis-richardson AG, Giongo A, et al. Gut microbiome metagenomics analysis suggests a functional model for the development of autoimmunity for type 1 diabetes. PLoS ONE. 2011;6(10):e25792.
12. Cani PD, Delzenne NM. Involvement of the gut microbiota in the development of low grade inflammation associated with obesity: focus on this neglected partner. Acta Gastroenterol Belg. 2010;73(2):267-9.
13. Musso G, Gambino R, Cassader M. Obesity, diabetes, and gut microbiota: the hygiene hypothesis expanded?. Diabetes Care. 2010;33(10):2277-84.
14. Frank DN, St amand AL, Feldman RA, Boedeker EC, Harpaz N, Pace NR.
Molecular-phylogenetic characterization of microbial community imbalances in human inflammatory bowel diseases. Proc Natl Acad Sci USA. 2007;104(34):13780-5.
15. Murri M, Leiva I, Gomez-zumaquero JM, et al. Gut microbiota in children with type 1 diabetes differs from that in healthy children: a case-control study. BMC Med. 2013;11:46.
16. Karlsson FH, Tremaroli V, Nookaew I, et al. Gut metagenome in European women with
normal, impaired and diabetic glucose control. Nature. 2013;498(7452):99-103.
17. Larsen N, Vogensen FK, Van den berg FW, et al. Gut microbiota in human adults with type 2 diabetes differs from non-diabetic adults. PLoS ONE. 2010;5(2):e9085.
18. Qin J, Li Y, Cai Z, et al. A metagenome-wide association study of gut microbiota in type 2 diabetes. Nature. 2012;490(7418):55-60.
20. Winglee K, Howard A, Sha W, et al. Recent urbanization in China is correlated with a
westernized microbiome encoding increased virulence and antiobiotic resistance genes. 2017;
21. Lee PH. Is a cutoff of 10% appropriate for the change-in-estimate criterion of confounder identification?. J Epidemiol. 2014;24(2):161-7.
22. Xiaohui hou . Urban-rural disparity of overweight, hypertension, undiagnosed hypertension, and untreated hypertension in China. Asia Pac J Public Health. 2008;20(2):159-69.
23. Thomas V, Clark J, Doré J. Fecal microbiota analysis: an overview of sample collection methods and sequencing strategies. Future Microbiol. 2015;10(9):1485-504.
24. Qin J, Li R, Raes J, et al. A human gut microbial gene catalogue established by metagenomic sequencing. Nature. 2010;464(7285):59-65.
25. Du S, Mroz TA, Zhai F, Popkin BM. Rapid income growth adversely affects diet quality in China--particularly for the poor!. Soc Sci Med. 2004;59(7):1505-15.
Tables and Figures
Table 1. Characteristics of participants from Hunan China stratified by rural and urban status
Rural Urban P-value
Subject Characteristics
Total number subjects 20 20
Number (%) female 5 (25%) 13 (65%)
Mean (std) Age Range 50.6 (11.7) 58.8 (10.7) Significant Differences in Metadata
Insulin (µU/mL) 4.3 9.8 <0.0001
Waist circumference (cm) 73.8 85.2 0.0003
BMI (kg/m2) 21.1 24.4 0.0005
HbA1c (%) 5.7 6.6 0.0013
Bacteriaa
Firmicutes 4.69 4.64 0.37
Bacteroidetes 4.64 4.65 0.59
Proteobacteria 3.43 3.7 0.15
Actinobacteria 2.34 2.12 0.36
Ratio 1.01 1 0.81
aLog10 normalized abundance bRatio = Firmicutes / Bacteroidetes
Table 2. Mean abundance (log10) of potential bacteria related to diabetes and relative proportion of gut bacteria
Bacteriaa Mean Stdb Proportion
Firmicutes 4.67 0.13 49.60% Bacteroidetes 4.64 0.14 46.33% Proteobacteria 3.56 0.46 3.85% Actinobacteria 2.23 0.6 0.18%
Ratioc 1 0.056 -
aLog10 normalized abundance bStandard devation
Table 3. Difference in log10 bacteria abundance in normal versus elevated HbA1c levels and sample size necessary for 0.80 power in each model
Bacteriaa Coefficient Stdb P-value Power Sample Size Needed
Firmicutes -0.11 0.039 0.008* 0.82 40
Bacteroidetes 0.062 0.044 0.177 0.26 172
Proteobacteria 0.23 0.15 0.122 0.36 120
Actinobacteria -0.18 0.19 0.367 0.15 350
Ratioc -0.037 0.017 0.034 0.58 68
aModel: Bacteria (log10) = HbA1c status (normal or elevated) bStandard devation
cRatio = Firmicutes / Bacteroidetes *Adequate power
Table 4. Expected log10 bacteria abundance including interaction term for HbA1c status and rural/urban status in 4 comparisons
Bacteriaa
Rural + Normal
Rural + Elevated
Urban + Normal
Urban +
Elevated P-value
Firmicutes 4.71 4.64 4.73 4.59 0.52
Bacteroidetes 4.62 4.65 4.61 4.72 0.54
Proteobacteria 3.83 3.68 3.36 3.57 0.39
Actinobacteria 1.88 2.14 2.40 2.19 0.39
Ratio 1.02 1.00 1.03 0.97 0.51
Table 5. Change in coefficients for log10 bacteria abundance with and without control for rural/urban status
Bacteriaa
Coefficient for Change in HbA1c status not controlling for
rural/urban
Coefficient for Change in HbA1c status controlling for
rural/urban Change (%)
Firmicutes -0.11 -0.13 15
Bacteroidetes 0.062 0.088 42
Proteobacteria 0.23 0.101 56
Actinobacteria -0.18 -0.06 65
Ratio -0.037 -0.05 24
aModel: Bacteria (log10) = HbA1c status (normal or elevated) + Rural/Urban status (rural or
urban)