ABSTRACT
Intraspecies variability is an important component in evaluating public health risks. In developmental toxicity studies, such variation may occur among litters within a treatment group. This study examined the degree of similarity across three breedings of female mice (CD-I) with respect to their responses to two known developmental
toxicants. Each female was mated to the same male (CD-I) and exposed to the same
dosing regimen during each pregnancy. Litters were evaluated for postnatal viability and
growth. The known murine teratogens dinocap and all-trans retinoic acid were chosen because of the existence of adequate historical data on these compounds. Two doses of each chemical were chosen to produce marginal or severe developmental toxicity. Five treatment groups (22-29 animals per group) were dosed by gastric intubation as follows: control (corn oil, gestation days 10 through 13); dinocap (20 or 40 mg/kg/day in corn oil, gestation days 10 through 13); and all-trans retinoic acid (10 or 20 mg/kg/day in corn oil, gestation days 11 through 13). Litters were examined on postnatal days 1 and 3 for viability, evidence of developmental toxicity, and growth (body weight). Gross
abnormalities observed included abdominal ballooning in the high dose litters and limb defects in the all-trans retinoic acid treated animals. Intergroup differences were assessed using the multiple t-test of least square means. A rank test of independence was performed to assess whether or not a given dam's response was consistent across
litters and intraclass correlation coefficients were calculated to assess between versus
within dam variability. These analyses indicated that maternal variability contributed to interlitter difference in untreated CD-I mice, in many cases up to 40 percent. Treatment with either of two known development toxicants, however, decreased the role that
maternal variability played with respect to interlitter differences, frequently dropping by
TABLE OF CONTENTS
Introduction 1
Materials and Methods 6
Animals ,, 6
Chemicals 6
Experimental Design 7
Statistical Analyses 8
Results and Discussion 10
Maternal Effects 10
Neonatal Effects 10
Interlitter Differences 13
Inter-Versus Intra-dam Variability 13
Summary ., 16
References 18
TABLES AND FIGURES
Table I Neonatal and Maternal Effects of Dinocap and All-trans
Retinoic Acid - Litter 1 21
Table II Neonatal and Maternal Effects of Dinocap and All-trans
Retinoic Acid - Litter 2 22
Table III Neonatal and Maternal Effects of Dinocap and All-trans
Retinoic Acid - Litter 3 23
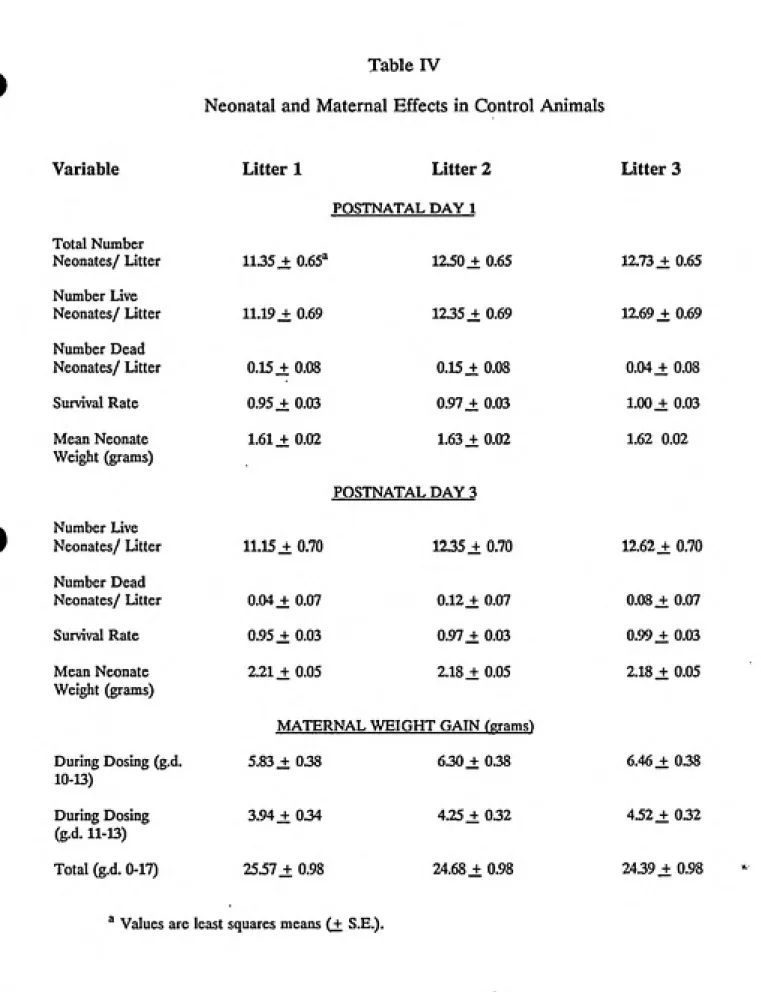
Table IV Neonatal and Maternal Effects - Control 24
Table V Neonatal and Maternal Effects - Dinocap (20 mg/kg/d) 25
Table VI Neonatal and Maternal Effects - Dinocap (40 mg/kg/d) 26
Table VII Neonatal and Maternal Effects - All-trans Retinoic Acid
(10 mg/kg/d) 27
Table VIII Neonatal and Maternal Effects - All-trans Retinoic Acid
(20 mg/kg/d) 28
Table IX Neonatal and Maternal Effects - Liver-to-Total Body Weight
Ratios 29
Table X Rank Test of Independence - Control 30
Table XI Rank Test of Independence - Dinocap (20 mg/kg/d) 31
Table XII Rank Test of Independence - Dinocap (40 mg/kg/d) 32
Table XIII Rank Test of Independence - All-trans Retinoic Acid
. (10 mg/kg/d) 33
Table XIV Rank Test of Independence - All-trans Retinoic Acid
(20 mg/kg/d) 34 Figure I Rank Test of Independence 35
Table XV Intraclass Correlation Coefficients 36
Table A-I Pilot Study I: Neonatal and Maternal Effects of Dinocap 41 Table A-II Pilot Study I: Neonatal and Maternal Effects of All-trans
Retinoic Acid 42
Table A-III Pilot Study I: Neonatal and Maternal Effects of
Valproic Acid 43
Table A-IV Pilot Study I: Neonatal and Maternal Effects of Nitrofen 44
Table A-V Pilot Study I: Neonatal and Maternal Effects of 2,4,5-T 45
Table A-VI Pilot Study II: Neonatal and Maternal Effects of Nitrofen 46
Table A-VII Pilot Study II: Neonatal and Maternal Effects of Dinocap 47 Table A-VIII Pilot Study II: Neonatal and Maternal Effects of All-trans
THE ROLE OF INDIVIDUAL MATERNAL VARIATION IN THE ASSESSMENT
OF DEVELOPMENTAL TOXICANTS
INTRODUCTION
Historically, in the regulation of industrial or agricultural chemicals by government agencies, uncertainty factors have been applied to exposure or dose levels observed in epidemiological or toxicological studies in order to estimate an acceptable environmental or industrial level of exposure for humans. Differences in toxicological response related to intraspecies variability are generally accounted for by such
uncertainty factors.
Most commonly, data derived from laboratory animals or occupational studies
of "healthy" workers are used to calculate an acceptable exposure level for the general human population including sensitive individuals. More specifically, for noncancer health endpoints, an evaluation of a chemical's toxicity for regulatory purposes has traditionally involved the identification of a lowest-observed-adverse-effect level (LOAEL) or no-observed-adverse-effect level (NOAEL). The LOAEL or NOAEL is converted to a human equivalent dose followed by division of this dose by uncertainty factors.
Uncertainty factors (generally factors of 10 for each applicable source of uncertainty) are
generally used to account for (1) interspecies variability; (2) intraspecies variability; (3)
use of a LOAEL when a NOAEL is not available; and (4) use of health data associated
with subchronic rather than chronic exposures when deriving an acceptable level for
long-term exposure periods. This procedure is commonly referred to as the derivation of
a reference dose (RfD). A discussion of the history and limited experimental evidence
1983). A discussion of the RfD development and verification process is available
elsewhere (Barnes and Dourson, 1989; U.S. EPA, 1987).
Despite the use of an uncertainty factor of ten to account for intraspecies variabiUty, the true significance of this variability in response to a toxicant is often
unknown. Generally, studies are designed with sufficient numbers of animals so that the
agent-induced effects may be identified regardless of normal genetic variation. Studies
conducted using multiple strains which would allow for exploring the diversity of a
species are relatively uncommon (Festing, 1990).
In many toxicological studies, at intermediate dose levels, a wide variety of responses may be observed in different animals. Frequently, a small number of animals within a treatment group may appear to be either sensitive or resistant to a dose level, though this observation may not be statistically significant. In developmental toxicity studies, this observation may be seen as: (1) some litters appearing to be unaffected by a given chemical/dose, while others are severely affected, and (2) litters containing substantial within-litter variation in response, with resorbed or dead conceptuses, malformed fetuses, and normal fetuses in the same litter. Dams evaluated in
developmental toxicity studies are commonly sacrificed prior to or soon after delivery of
their first litters, therefore, further study of those animals producing highly sensitive,
resistant, or variable litters is not generally possible.
The phenomenon of intraspecies variability may have a strong genetic
transmitted through the egg but not the sperm cytoplasm (Biddle, 1981; Biddle and Fraser, 1977). In addition to maternal genetic variability, other factors that may account
for intraspecies differences include: experimental error and/or variation (e.g., in dosing
volume), paternal genetic variability, the amount of food in the stomach of animals dosed orally, differences in the health status of dams which may not
be apparent to the investigator, and kinetic differences based upon variations in the size
of a litter or position within the uterus.
A number of studies have attempted to elucidate the precise roles of the
maternal and/or fetal genomes in in utero growth. These studies have generally utilized
egg transplant techniques or treatments in inbred strains (Biddle and Fraser, 1977; Inouye and Kajiwara, 1990; Kaher, 1979; Seller et.al.,1983; Hansen and Hodes, 1983). However, no study has directly dealt with the role of individual maternal variation in
developmental toxic responses.
An outbred strain of laboratory animals was chosen to study intraspecies variation as these animals provide the investigator with a population having genetic
heterogeneity and strong reproductive characteristics. Conversely, an inbred strain composed of virtually genetically equivalent individuals provides only a narrow spectrum
of the genetic makeup of a species, generally less reproductive vigor, and, reportedly,
increased sensitivity to phenotypic variance caused by environmental factors (Gill, 1980).
A modification of an in vivo tertology screen developed by Chernoff and
Chernoff-Kavlock screening assay involves exposing pregnant animals to a minimally toxic dose during a portion of the period of major organogenesis. The dams are allowed to give birth and litter size and pup weight are examined on postnatal days 1 and 3 (Chernoff and Kavlock, 1982). Results of previous studies using this protocol have shown that most prenatal effects can be observed postnatally as reduced viability and/or impaired growth (Chernoff and Kavlock, 1982; Gray and Kavlock, 1984; Kavlock, et al, 1987). Specific modifications to this study design needed to evaluate the role of
maternal variation in developmental toxicity include: expanding the protocol in order to evaluate multiple litters of the same parents; selecting dose levels that produce little or no maternal toxicity since it was desired to maintain the health of the females across
multiple breedings and because developmental effects observed at nonmaternally toxic levels are of most concern; and dosing dams at more than one level per chemical.
Two known murine teratogens, dinocap and all-trans retinoic acid, were chosen for the study based on results of pilot studies and because of the existence of adequate historical data on these compounds. A brief summary of each chemical is presented
below.
Dinocap is a complex mixture used as a fungicide in the control of powdery mildew and also as a miticide (Rohm and Haas Co., 1961). Technical-grade dinocap
reportedly contains 74% 2,4- and 2,6- dinitrooctylphenylcrotonates, 6% mixed
nitrooctylphenols, and 0.54 - 0.86% mononitrooctyl- phenols, with nonvolatile materials
CD-1 mouse at levels that are not maternotoxic. Adverse effects seen in the offspring
include cleft palate, otolith defects, reduced body weight, abdominal "ballooning", poor
postnatal survival, and behavioral torticollis (Gray et. al., 1986; Rogers et. al., 1986; Rogers et. al., 1987a). The standard teratogenicity study underestimates the toxic effects in the CD-I mouse. Specifically, behavioral effects that are not observed at birth may be
seen at weaning (Gray et. al, 1988). The active component(s) within the technical-grade
dinocap responsible for the developmental toxicity is (are) unknown since neither of the two major fungicidal ingredients (2,4-dinitro-6-(l-methylheptyl)phenyl crotonate and 2,6-dinitro-4-(l-methylheptyl)phenyl crotonate produce developmental toxicity in purified
form (Rogers et. al., 1987b).
All-trans retinoic acid is a naturally occurring form of vitamin A. This vitamin can be metabolized to retinoic acid which has been proposed to be a morphogen in limb development (Thaller and Eichele, 1987; Satre and Kochhar, 1988; Maden, 1985; Thaller and Eichele, 1988). Excess vitamin A or retinoic acid has been found to be teratogenic in many animal species, producing a wide range of malformations including cleft palate
and limb defects (Geelen, J.A.G., 1979; Kochhar et. al, 1984; Birnbaum et.al, 1989). In
the ICR mouse, the period of peak susceptibility for limb development is day 11.5 of
gestation and that for palatal clefts, day 12.0 (sperm plug = day 1) (Kochhar et. al.,
1984).
In standard developmental toxicity studies, the pregnant animal is killed before
degree of similarity across breedings of a given female in terms of its response to a known developmental toxicant. The hypothesis, that maternal variability contributes significantly to inter-litter difference, was examined in a group of multiply bred animals with constant dosage. The study design followed an in vivo screening procedure that
relies on postnatal viability and growth as measures of developmental toxicity (Chernoff
andKavlock, 1982).
MATERIALS AND METHODS
Animals
Females, approximately 60 days old, and males, approximately 90 days old, of the CD-I strain were obtained from Charles River Laboratories (Raleigh, NC). Animals were housed in solid bottom cages with wood shavings bedding and fed Wayne Lab Blox and tap water ad libitium. The animal rooms were maintained at 20 to 24° C and 40 to
50 percent relative humidity. The mice were kept on a 10 hours light: 14 hours dark photoperiod and were housed individually except during breeding periods.
Chemicals
Two pilot studies were undertaken to determine the chemicals and dosing
regimes to be used in this study. Five chemicals (nitrofen, dinocap, valproic acid, all-trans retinoic acid, and 2,4,5 trichlorophenoxyacetic acid (2,4,5-T)) were assessed in the
first pilot study. All of these chemicals are known developmental toxicants in the mouse.
Based upon the results of this pilot study, three chemicals (nitrofen, dinocap, and
all-trans retinoic acid) were further evaluated in a second pilot study. Two chemicals
levels were selected to produce minimal or no maternal toxicity. The two dosage levels selected for each chemical were chosen to produce developmental effects in
approximately 25 to 35 percent of the low dose litters and effects in approximately 50 to 75 percent of the high dose litters. The results of the two pilot studies are presented in
the Appendix.
Experimental Design
Each male was initially mated with five females chosen randomly. The mating
period lasted 10 days (two Sunday night through Thursday night periods). Females were checked the morning after mating for evidence of a sperm plug (gestation day 0). As each female successfully mated, it was removed from the male's cage and assigned
randomly to one of five treatment groups. Only one female mated to a specific male was assigned to a given treatment group. Females that did not successfully mate during the
10 day breeding period were removed from the study.
The five treatment groups were as follows: (1) control (corn oil); (2) 20
mg/kg/day dinocap; (3) 40 mg/kg/day dinocap; (4) 10 mg/kg/day all-trans retinoic acid; and (5) 20 mg/kg/day all-trans retinoic acid. Control and dinocap-treated dams were dosed on days 10 - 13, and retinoic acid-treated dams were treated on days 11-13. The dose levels were selected based upon the two pilot studies presented in the Appendix.
The compounds were administered by gastric intubation using corn oil as the vehicle.
Dosing solutions were adjusted for chemical purity. The females were weighed on
gestation days 0, 8, 17 and throughout dosing. Dosing volumes were adjusted daily for
Throughout gestation, the dams were observed for signs of toxicity. The females were allowed to deliver naturally and the litters were examined on postnatal
days 1 and 3 for viability, evidence of developmental toxicity, and growth (body weight). Following litter observations on postnatal day 3, all surviving offspring were removed from the dam and euthanized. Dams that had not delivered litters by postnatal day 3 and that had shown little or no weight gain during the gestational period were assumed
to be nonpregnant and were removed from the study.
Approximately one week following the last litter's postnatal day 3, each female that had successfully delivered a first litter was remated to its original mate. The
protocol described above was followed a second time. Similarily, dams that successfully delivered a second litter were remated to the same males for a third time. Only dams that successfully delivered three litters were retained in the study. Treatment groups ultimately contained 22 to 29 animals. The length of time from the first mating through
delivery of the third litter was approximately 100 days.
Exposure to dinocap has been shown to increase absolute and relative liver weight (Rogers et.al., 1986). Therefore, following postnatal day 3 of the third htters, all control and dinocap females were killed by asphyxiation with carbon monoxide and
whole body and liver weights were recorded.
Statistical Analyses
To evaluate intergroup differences, the multiple t-test of least squares means
therefore, the values presented in Tables I - IX represent least squares means of litter values _+ standard error. Values that were statistically different from controls at p ^
0.05 and p_< 0.01 were noted.
To assess whether or not a response was consistent rather than random across breedings, a rank test of independence was performed (Lehmann, 1975). The correlation of the ranking of variables between two litters (litters 1 and 2; litters 2 and 3; and litters 1 and 3) were determined. For each litter and variable (e.g., the number of live
neonates/litter on postnatal day 1), dams were ranked within each treatment group. Thus, the dam with the largest number of live neonates/litter on postnatal day 1 would be given a rank of 1, the dam with the second largest number of live neonates/litter on postnatal day 1 would receive a rank of 2, etc. Rank ties were given equivalent scores. A dam's rank for a specific variable could then be compared across litters. The null hypothesis (H^) tested was that the dams will respond randomly across multiple breeds and, thus, a dam's rank for a given variable will change significantly from litter to litter.
Where the H^, could be rejected at the p _< 0.05 level, the dams/litters were determined
to be responding consistently from litter to litter.
Intraclass correlation coefficients were calculated to assess the between versus
within dam variability; that is, the significance of the ratio of interdam variability to
interdam plus intradam variability. A ratio of 0.50 would indicate that interdam and
intradam variabiUty contributes equally to interlitter differences. Confidence intervals
significantly different from control animals were identified (Donner and Wells, 1986;
Swiger et.al., 1964).
RESULTS AND DISCUSSION
The results of exposing pregnant CD-I mice to the the five treatment regimens are presented in Tables I through XV and Figure I. Summaries of maternal and
neonatal toxicity are presented below. Maternal Effects
As identified in the previous section, only dams that successfully delivered
three litters remained in the study for statistical analyses. Twenty-two to 29 animals per
treatment group successfully delivered three litters. Of the dams not considered in the statistical analyses, less than two percent died during any part of the study, therefore,
treatment-related maternal mortality was considered unimportant.
Evidence of maternal toxicity was observed as a decrease in weight gain for dams treated with 40 mg/kg/day dinocap. Maternal weight gain was reduced
throughout dosing (Tables I through III). This effect was observed during all three gestational periods but was most severe during the last pregnancy (Table VI). For the first and third pregnancies, this decrease in weight gain persisted throughout pregnancy
(Tables I and III). Evidence of maternal toxicity was not seen in the other treatment
groups.
Neonatal Effects
Malformed neonates are frequently cannibalized by the dams. Since the dams
morning, the observations made on postnatal day 1 probably underestimate the number of dead neonates and, thus, the total number of pups in a litter. This phenomenon may explain the difference in litter size between the control animals and those treated with
dinocap at 40 mg/kg/d (Tables I and III). The litter loads of the remaining treatment
groups were not different from those of control animals.
Considerable offspring mortality on postnatal days 1 and 3 was observed in the
40 mg/kg/day dinocap treatment group (Tables I through III). Increased neonatal mortality in the 20 mg/kg/day dinocap group was only seen on postnatal day 3 of the third litter (Table III). In many of the neonates that died postnatally, a "ballooned" abdomen was observed. This effect has been observed previously in dinocap-treated litters and was found to be associated with cleft palate. The "ballooning" results from a neonate swallowing air so that eventually the gastrointestinal tract is filled, distending the
abdomen (Gray et.al., 1986).
Developmental toxicity in the two dinocap groups was also observed as a
decrease in mean neonatal weight on postnatal day 1 (Tables I through III). This was observed in the third litter of the low dose group and all three litters of the high dose group. By postnatal day 3, however, in all but the second litter for the high dose group, there were no weight differences between dinocap-treated neonates and control
neonates. This most likely is the result of the high mortality of severely affected pups, as noted above. All pups that survived through postnatal day 3 appeared normal.
Developmental toxicity increased by the third litter in the dinocap treated
animals; that is, neonatal survival was significantly reduced in the last litter compared to
the first two litters (Tables V and VI). A previous study had hypothesized that the CD-I mouse may metabolize dinocap differently than other species (Rogers, et. al., 1988). One possibility may be that exposure to dinocap induces synthesis of liver xenobiotic metabolizing enzymes, increasing the availability of a toxic metabolite. If these enzymes were induced over a period of time, this may account for a greater response with dosing during subsequent pregnancies. Frequently, the induction of liver enzymes may be observed as an increase in liver weight. Analysis of absolute and relative liver weights following completion of the third litter observations, however, did not show a difference
between dinocap treated and control animals (Table IX).
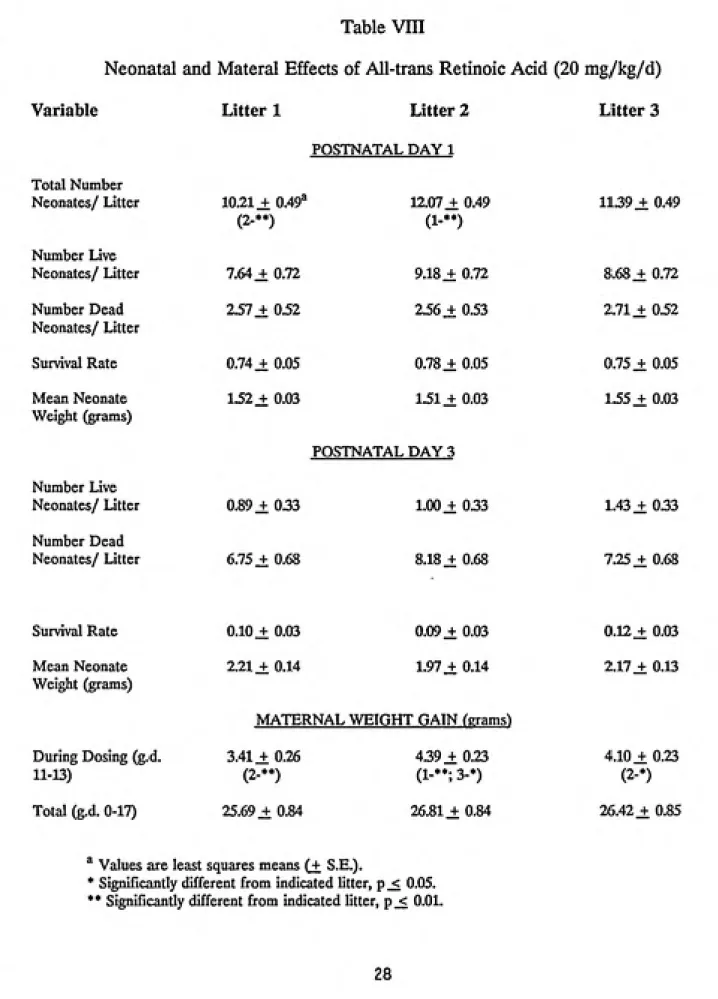
Administration of all-trans retinoic acid at either 10 or 20 mg/kg/day
significantly reduced neonatal survival on postnatal day 3 for all three litters in a dose dependent manner. A reduction in survival rate was also seen on postnatal day 1 in all three litters of the high dose group (Tables I through III). Similar to the dinocap treated animals, mean neonatal weights were slightly reduced on postnatal day 1 for the first two high dose litters, however, by postnatal day 3 all surviving pups appeared normal.
The "ballooning" gastrointestinal tracts observed in the dinocap animals were
also observed in many of the neonates that died following the all-trans retinoic acid treatment. In addition, hind limb defects were observed in many of these animals. These observations correlate with the results of previous studies where cleft palate and limb defects were observed in other mouse strains following treatment with all-trans
retinoic acid during similar gestational periods (Kochhar, et. al., 1984; Abbott, et.al.,
Interlitter Differences
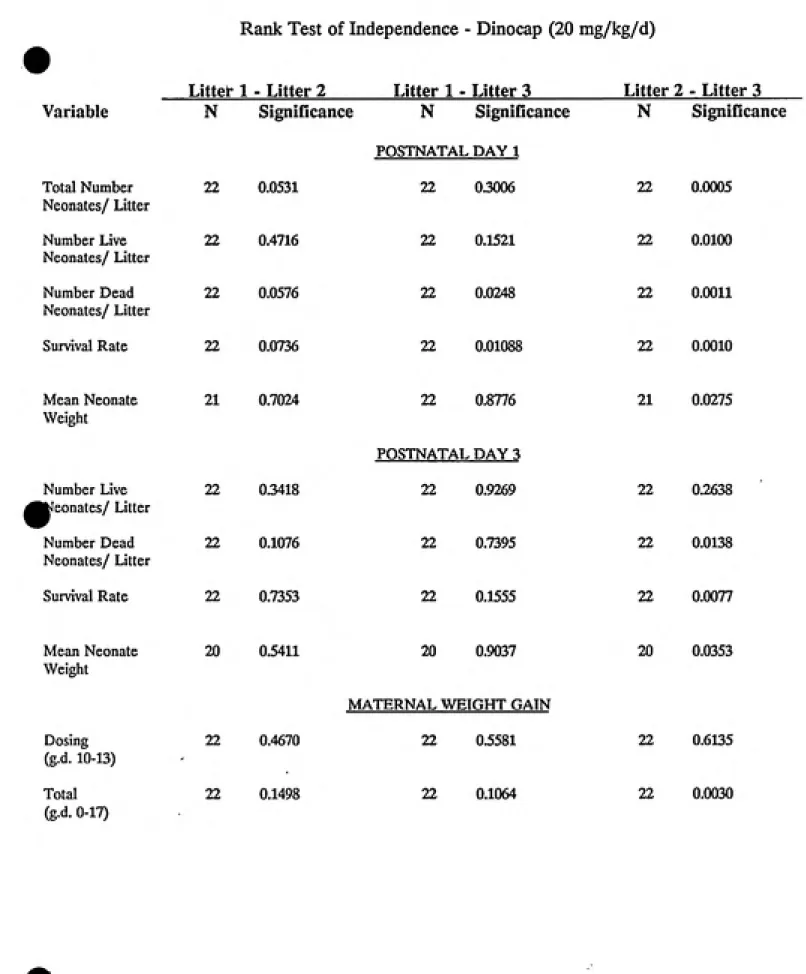
The results of a rank test of independence are presented in Tables X through XIV and Figure I. Probability levels less than or equal to 0.05 indicate rank
comparisons where the null hypothesis could be rejected; that is, the dams responded consistently from one litter to another.
In the control animals, a pattern of consistent reponse was seen for many variables in all three pairs of litter comparisons (Table X), Figure I illustrates this patterned response by variable for the three litter comparisons. For some variables, these results are not surprising. For example, few neonates died in the control litters, therefore, survival rates and the number of dead neonates per litter remained virtually
constant.
A similar but less dramatic pattern was seen in the 10 mg/kg/day all-trans retinoic acid treated animals (Table XIII and Figure I). The remainder of the treatment groups exhibited more random patterns of response across litters with respect to specific variables as evidenced by probability levels less than 0.05 (Tables XI, XII, and XIV and Firgure I). This result was observed despite few differences in mean litter values (Tables
IV through VIII).
Inter- Versus Intra-dam VariabiUty
Intradam variability, as calculated for this study, includes variation specifically
associated with the parental pair as well as variation in the Utter. In addition to genetic
variability, other factors that may account for the inter dam variabiUty include:
experimental error and/or variation; differences in the amount of food in the stomach of
animals dosed orally; differences in the health status of the dams which may not be apparent to the investigator; and kinetic differences in litter load or position in the
uterus. Experimental error and/or variation can be minimized by use of good laboratory practices, but can never be completely eliminated. All possible steps were taken to ensure a consistent environment for the animals including the random assignment of dams to a treatment group; the preparation of dosing solutions was assumed by one individual; and the dosing and observation of animals at a consistent time each day. Since individual offspring measurements were not made in this study, the relative contribution of maternal versus litter variabihty to the "intradam" variability
cannot be determined.
Likewise, since CD-I male mice were used in breeding, the relative
contribution of paternal variability could also not be determined. Each male was initially assigned five females, one for each treatment group, so that significant paternal variation would not be limited to one treatment group. To study the impacts of genetic variation
associated with the sire on inter-litter difference the study would need to be repeated with males from an inbred strain since these animals are virtually genetically identical.
No intraclass correlation coefficient calculated was greater than 0.50 (Table
XV). This indicates that intradam variability contributes more to the total variability
observed than interdam variability. Interdam variability, though smaller than intradam
variability, did appear to contribute substantially to overall variation. This was most
easily seen in the control animals where the intraclass correlation coefficients ranged
observed for the endpoints evaluated on postnatal day 3 in the 10 mg/kg/d retinoic acid animals. These values generally decreased in the other treatment groups for most variables, though few were statistically significant from controls. The lack of statistical significance was primarily related to large confidence intervals associated with the
intraclass correlation coefficients.
SUMMARY
The present study confirmed the results of previous experiments showing that
dinocap and all-trans retinoic acid are teratogenic in CD-I mice. Using a modification of an in vivo teratology screen that assesses postnatal growth and viability (Chernoff and Kavlock, 1982), developmental toxicity was observed as an increase in neonatal mortality by postnatal day 3 in all treatment groups in one (20 mg/kg/day dinocap; litter 3) or all three litters. In addition, an increase in neonatal mortality as well as a decrease in mean neonate weight were seen on postnatal day 1 in the majority of the two high dose litters. Malformations characteristic of treatment with these teratogens were also observed in
some surviving neonates.
Individual maternal variation appeared to contribute significantly to the
responses of untreated animals. A consistent response pattern was observed in untreated
animals as evidence by consistent ranks across litters for specific endpoints. That is, a
dam that had a large number of pups in one litter tended to have large second and third litters when compared to the other dams in the control group. Relatively large intraclass
correlation coefficients observed for the control animals also indicate that interdam
variation contributes significantly to interlitter differences.
' The significance of individual maternal variability decreased when the dams were exposed to dinocap or all-trans retinoic acid. Specifically, the relative rank of a dam for a given variable within a treatment became more random and the intraclass correlation coefficients decreased, in some cases to less than 0.10. This finding was
mg/kg/day) showing statistically significant differences in several endpoints when
compared to controls using standard statistical test as well as a third treatment group
(dinocap: 20 mg/kg/day) where most endpoints were not significantly different than
controls. These data raise the possibility of an environmental exposure, in this case, a
known developmental toxicant, masking the role of normal individual variation, including
differences related to genetic variation.
REFERENCES
Abbott, B.D.; Harris, M.W. and Birnbaum, L.S. (1989). Etiology of retinoic acid-induced cleft palate varies with the embryonic stage. Teratology. 40:533-553.
Abbott, B.D.; Hill, L.G.; and Birnbaum, L.S. (1990). Processes involved in retinoic acid production of small embryonic palatal shelves and limb defects. Teratology. 41:299-310. Biddle, F.G. (1981). The role of genetic studies in developmental toxicology.
Developmental Toxicology (C.A. Kimmel and J. Buelke-Sam, eds). pp. 55-82. Biddle, F.G. and Fraser, F.C. (1977). Maternal effects in experimental teratology. Handbook of Teratology: Volume III - Comparative. Maternal, and Epidemiologic Aspects (J.G. Wilson and F.C Fraser, eds.). pp. 3-33.
Birnbaum, L.S.; Harris, M.W.; Stocking, L.M.; Clark, A.M.; and Morrissey, R.E. (1989).
Retinoic acid and 2,3,7,8-tetrachlorodibenzo-p-dioxin (TCDD) selectively enhance
teratogenesis in C57BL/6N mice. Toxicology and Applied Pharmacology. 98:487-500. Brockes, S.P. (1989). Retinoids, homeobox genes, and limb morphogenesis. Nature, Lond. 332:850-853.
Chernoff, N. and Kavlock, R.J. (1982). An in vivo teratology screen utilizing pregnant
mice. J Tox and Env Health. 10:541-550.
Dormer, A. and Wells, G. (1986). A comparison of confidence interval methods for the
intraclass correlation coefficient. Biometrics. 42:401-12.
Dourson, M.L. and Stara, J.F. (1983). Regulatory history and experimental support of
uncertainty factors. Reg Tox and Pharmacology. 3:224-238.
Festing, M.F.W. (1990). Use of genetically heterogeneous rats and mice in toxicological researce: a personal perspective. Toxicology and Applied Pharmacology. 102:197-204. Gill, T.J. (1980). The use of randomly bred and genetically defined animals in
biomedical research. Americal Jornal of Pathology. 101(3) S21-32.
Geelen, J.A.G. (1979). Hypervitaminosis A induce teratogenesis. CRC Crit Rev
Toxicol. 6:351-375.
Gray, L.E. and Kavlock, R.J. (1984). An extended evaluation of an in vivo teratology screen utilizing postnatal growth and viability in the mouse. Teratogenesis,
Gray, L.E.; Rogers, J.M.; Kavlock, R.J.; Ostbly, J.S.; Ferrell, J.M.; and
Gray, K.L. (1986). Prenatal exposure to the fungicide dinocap causes behavioral
torticollis, ballooning, and cleft palate in mice, but not rats or hamsters. Teratogenesis Carcinog Mutagen. 6:33-43.
Hanson, D.K. and Hodes, M.E. (1983). Comparative teratogenicity of phenytoin among
several inbred strains of mice. Teratology. 28:175-179.
Inouye, M. and Kajiwara, Y. (1990). Strain difference of the mouse in manifestation of hydrocephalus following prenatal methylmercury exposure. Teratology. 41:205-210.
Kalter, H. (1979). The history of the A family of mice and biology of its congential
malformations. Teratology. 20:213- .
Kavlock, R.J.; Short, R.D.; and Chernoff, N. (1987) Further evaluation of an in vivo teratology screen. Teratogenesis, Carcinogenesis, and Mutagenesis. 7:7-16.
Kochhar, D.M.; Penner, J.D.; and Tellone, C.I. (1984) Comparative teratogenic activities
of two retinoids: effects on palate and limb development. Teratogenesis,
Carcinogenesis, and Mutagenesis. 4:377-387.
Kurtz, C.P.; Baum, H.; and Swittenbank, C. (1970). Gas chromatographic determination
of total active ingredient content of Karathane Technical and Karathane.
Lehmann, E.L. (1975). Nonparametrics: Statistical Methods Based on Ranks.
Holden-Day, Inc., San Francisco, pp. 287-303.
Maden, M. (1985). Retinoids and the control of pattern in limb development and
regenration. Trends in Genetics. 1:103-104.
Robertson, M. (1987). Towards a biochemistry of morphogenesis. Nature. 330:420-421.
Rogers, J.M.; Carver, B.; Gray, L.E.; Jr.; Gray, J.A.; and Kavlock, R.J. (1986).
Teratogenic effects of the fungicide dinocap in the mouse. Teratogenesis Carcinog
Mutagen. 6:375-81. ,;
Rogers, J.M.; Gray. L.E., Jr.; Carver, B.; and Kavlock, R.J. (1987b). Developmental toxicity of dinocap in the mouse is not due to two isomers of the major active
ingredients. Teratogenesis Carcinog Mutagen. 7:341-46.
SAS Institute, Inc. (1985). SAS Users Guide: Statistics. SAS Institute, Inc., Cary, NC. Satre, M.A. and Kochhar, D.M. (1988). Endogenous concentrations of retinol and retinoic acid in embryonic mouse tissues and limb-buds. Teratology. 37:489.
iPHjr
Seller, M.J.; Perkins, K.J.; and Adenolfi, M. (1983). Differential response of
heterozygous curly-tail mouse embryos to vitamin A teratogenesis depending on maternal
genotype. Teratology. 28:123-129.
Swiger, L.A.; Harvey, W.R.; Everson, D.O.; and Gregory, K.E. (1964). The variance of intraclass correlation involving groups with one observation. Biometrics 20:818-826.
Thaller, C. and Eichele, G. (1988). Characterization of retinoid metabolism in the developing chick limb bud. Development. 103:47-483.
Thaller, C. and Eichele, G. (1987). Identification and spatial distribution of retinoids in the developing chick limb bud. Nature. 327: 625-628.
Tickle, C; Alberts, B.; Wolpert, L. and Lee, J. (1982). Local application of retinoic acid to the limb bud mimics the action of the polarizing region. Nature. 296: 564-566.
U.S. Environmental Protection Agency (1987). Integrated Risk Information System
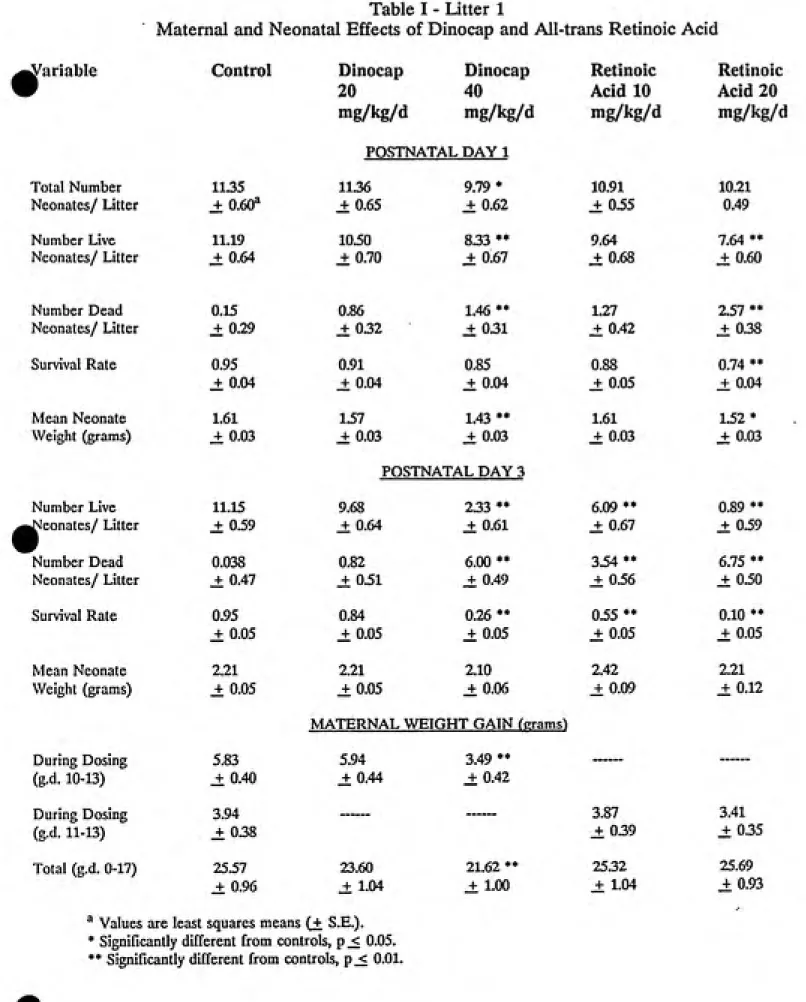
Table I - Litter 1
Maternal and Neonatal Effects of Dinocap and All-trans Retinoic Acid
Variable Total Number Neonates/ Litter Number Live Neonates/ Litter Number Dead Neonates/ Litter Survival Rate Mean Neonate Weight (grams) Number Live "Neonates/ Litter Number Dead Neonates/ Litter Survival Rate Mean Neonate Weight (grams) During Dosing (g.d. 10-13) During Dosing (g.d. 11-13) Total (g.d. 0-17)
Control Dinocap Dinocap Retinoic Retinoic
20 40 Acid 10 Acid 20
mg/kg/d mg/kg/d mg/kg/d mg/kg/d
POSTNATAL DAY 1
11.35 11.36 9.79* 10.91 10.21
J: 0.60^ J:0.65 ± 0.62 ±0.55 0.49
11.19 10.50 8.33 ** 9.64 7.64 **
± 0.64 J:0.70 ±0.67 ± 0.68 ± 0.60
0.15 0.86 1.46** 1.27 2.57 **
± 0.29 _+ 0.32 ± 0.31 ± 0.42 ±0.38
0.95 0.91 0.85 0.88 0.74 **
± 0.04 J: 0.04 ± 0.04 ± 0.05 ± 0.04
1.61 1.57 1.43 ** 1.61 1.52*
± 0.03 ± 0.03 _t 0.03 ± 0.03 ± 0.03
POSTNATAL DAY 3
11.15 9.68 . 2.33 ** 6.09 ** 0.89 **
± 0.59 ± 0.64 J: 0.61 ± 0.67 ± 0.59
0.038 0.82 6.00 ** 3.54 ** 6.75 **
± 0.47 ± 0.51 ± 0.49 ± 0.56 ± 0.50
0.95 0.84 0.26 ** 0.55 ** 0.10 **
jf 0.05 _+0.05 ± 0.05 ± 0.05 ± 0.05
2.21 2.21 2.10 2.42 2.21
±0.05 jt0.05 ± 0.06 ± 0.09 ±0.12
MATERNAL WEIGHT GAIN ferams)
5.83 5.94 3.49 **
J; 0.40 ± 0.44 ± 0.42
3.94 3.87 3.41
± 0.38 ± 0.39 ± 0.35
25.57 ' 23.60 21.62 ** 25.32 25.69
+ 0.96 ± 1.04 ± 1.00 ± 1.04 ± 0.93
^ Values are least squares means (+ S.E.).
* Significantly different from controls, p _< 0.05. ** Significantly different from controls, p_< 0.01.
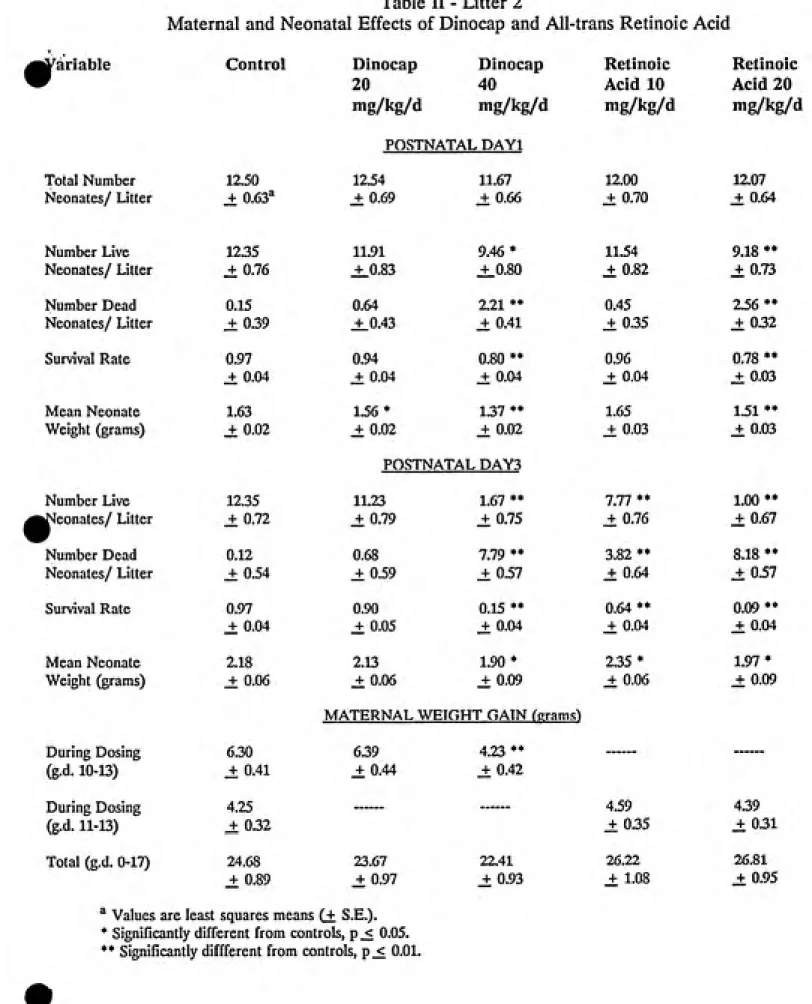
Table II - Litter 2
Maternal and Neonatal Effects of Dinocap and All-trans Retinoic Acid
I'ariable Control Dinocap
20 mg/kg/d Dinocap 40 mg/kg/d Retinoic Acid 10 mg/kg/d Retinoic Acid 20 mg/kg/d POSTNATAL DAYl Total Number Neonates/ Litter 12.50 J: o.es'' 12.54 J:0.69 11.67 ± 0.66 12.00 ± 0.70 12.07 ±0.64 Number Live Neonates/ Litter 12.35 jfO.76 11.91 + 0.83 9.46* ±_om 11.54 ± 0.82 9.18 ** ± 0.73 Number Dead Neonates/ Litter 0.15 J: 0.39 0.64 J^O.43 2.21 ** ± 0.41 0.45 ± 0.35 2.56 ** ±0.32
Survival Rate 0.97
± 0.04 0.94 ± 0.04 0.80 ** ± 0.04 0.96 ± 0.04 0.78 ** ± 0.03 Mean Neonate Weight (grams) 1.63 ± 0.02 1.56 * J: 0.02 1.37** ± 0.02 1.65 ± 0.03 1.51 ** ± 0.03 POSTNATAL DAY3 Number Live ^Jeonates/ Litter 12.35 ± 0.72 11.23 J:0.79 1.67 ** J; 0.75 7.77 ** J: 0.76 1.00** ±0.67 Number Dead Neonates/ Litter 0.12 ± 0.54 0.68 ± 0.59 7.79 ** ± 0.57 3.82 ** ±0.64 8.18 ** ± 0.57
Survival Rate 0.97
_f 0.04 0.90 ± 0.05 0.15 ** _+ 0.04 0.64 ** ± 0.04 0.09** ± 0.04 Mean Neonate Weight (grams) 2.18 J; 0.06 2.13 ± 0.06 1.90* ± 0.09 2.35 * ± 0.06 1.97* ± 0.09
MATERNAL WEICJHT GAIN Cerams^
During Dosing (g.d. 10-13) 6.30 J: 0.41 6.39 J:0.44 4.23 ** _t 0.42 During Dosing (g.d. 11-13) 4.25 ±0.32 4.59 J: 0.35 4.39 ± 0.31
Total (g.d. 0-17) 24.68 + 0.89 23.67 + 0.97 22.41 + 0.93 26.22 ± 1.08 26.81 ± 0.95
^ Values are least squares means (+ S.E.).
* Significantly different from controls, p _< 0.05.
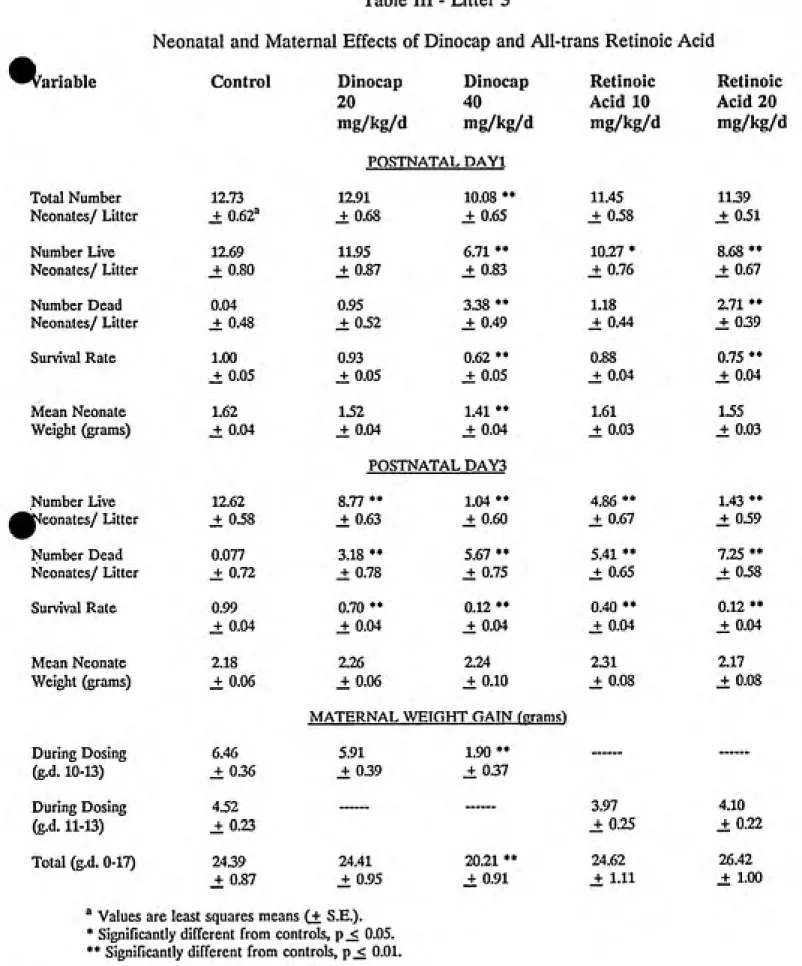
Table III - Litter 3
Neonatal and Maternal Effects of Dinocap and All-trans Retinoic Acid
^^ariable Control Dinocap Dinocap Retinoic Retinoic
20 40 Acid 10 Acid 20
mg/kg/d mg/kg/d mg/kg/d mg/kg/d
POSTNATAL DAYl
Total Number 12.73 12.91 10.08 ** 11.45 11.39
Neonates/ Litter ± 0.62^ ± 0.68 J; 0.65 ± 0.58 ± 0.51
Number Live 12.69 11.95 6.71 ** 10.27 * 8.68 **
Neonates/ Litter J: 0.80 ± 0.87 ±0.83 ± 0.76 ±0.67
Number Dead 0.04 0.95 3.38 ** 1.18 2.71 **
Neonates/ Litter ± 0.48 j!:0.52 ± 0.49 ± 0.44 ±0.39
Survival Rate 1.00 0.93 0.62 ** 0.88 0.75 **
± 0.05 ± 0.05 _t 0.05 J: 0.04 ± 0.04
Mean Neonate 1.62 1.52 1.41 ** 1.61 1.55
Weight (grams) ± 0.04 ± 0.04 ± 0.04 ± 0.03 ± 0.03
POSTNATAL DAY3
Number Live 12.62 8.77 ** 1.04 ** 4.86 ** 1.43 **
^ͣj^eonates/ Litter ± 0.58 J: 0.63 J: 0.60 _+ 0.67 ± 0.59
Number Dead 0.077 3.18 ** 5.67 ** 5.41 ** 7.25 **
Neonates/ Litter J; 0.72 jt 0.78 ± 0.75 ± 0.65 ± 0.58
Survival Rate 0.99 0.70 ** 0.12 ** 0.40 ** 0.12 **
J: 0.04 ± 0.04 ± 0.04 _t 0.04 ±0.04
Mean Neonate 2.18 2.26 2.24 2.31 2.17
Weight (grams) ± 0.06 ± 0.06 ± 0.10 ± 0.08 ± 0.08
MATERNAL WEIGHT GAIN ferams)
During Dosing 6.46 5.91 1.90 **
---(g.d. 10-13) ± 0.36 ± 0.39 ± 0.37
During Dosing 4.52 3.97 4.10
(g.d. 11-13) ± 0.23 ± 0.25 ± 0.22
Total (g.d. 0-17) 24.39 24.41 20.21 ** 24.62 26.42
+ 0.87 J: 0.95 ± 0.91 ± Lll ± 1.00
^ Values are least squares means (+ S.E.). * Significantly different from controls, p _< 0.05. ** Significantly different from controls, p^ 0.01.
Table IV
Neonatal and Maternal Effects in Control Animals
Variable Total Number Neonates/ Litter Number Live Neonates/ Litter Number Dead Neonates/ Litter Survival Rate Mean Neonate Weight (grams) Number Live Neonates/ Litter Number Dead Neonates/ Litter Survival Rate Mean Neonate Weight (grams)
During Dosing (g.d. 10-13)
During Dosing (g.d. 11-13) Total (g.d. 0-17)
Litter 1 Litter 2
POSTNATAL DAY 1
11.35 J: 0.65^ ; , 12.50 jh 0.65
11.19 jh 0.69 12.35 J: 0.69
0.15 J: 0.08 0.15 jf 0.08
0.95 J: 0.03 0.97 _+0.03 1.61 J: 0.02 1.63 _+ 0.02
POSTNATAL DAY 3
n.l5j:0.70 12.35 _t 0.70
0.04 J: 0.07 0.12 J: 0.07 0.95 jh 0.03 0.97 J: 0.03
2.21 J: 0.05 2.18 J; 0.05
MATERNAL WEIGHT GAIN (grams)
5.83 + 0.38 6.30 + 0.38
Litter 3
12.73 _t 0.65
12.69 J: 0.69
0.04 jh 0.08 1.00 J: 0.03
1.62 0.02
12.62 jt 0.70
0.08 jt 0.07
0.99 J: 0.03
2.18 + 0.05
3.94 + 0.34
25.57 + 0.98
4.25 + 0.32
24.68 + 0.98
6.46 + 0.38
4.52 + 0.32
24.39 + 0.98
Table V
Neonatal and Maternal Effects of Dinocap (20 mg/kg/d)
Variable Litter 1 Litter 2
POSTNATAL DAY 1
Litters
Total Number
Neonates/ Litter 11.36 jh 0.60^ 12.54 jh 0.60 12.91 jt 0.60
Number Live
Neonates/ Litter 10.50 J; 0.71 11.91 jt 0.71 11.95 jt 0.71
Number Dead
Neonates/ Litter 0.86 JL 0.44 0.64 jh 0.44 0.95 jt 0.44
Survival Rate 0.91 J: 0.04 0.94 jh 0.04 0.93 _+ 0.04
Mean Neonate 1.57 J: 0.03 1.56 J: 0.03 1.52 jh 0.03
Weight (grams)
" " --S.
POSTNATAL DAY 3
Number Live
Neonates/ Litter 9.68 J; 0.72 11.23 + 0.72 8.77 + 0.72
(3-*) (2-*)
Number Dead 0.82 + 0.51 0.68 + 0.51 3.18 jt 0.51
Neonates/ Litter (3-**) (3-**) (1-**; 2-**)
Survival Rate 0.84 + 0.05 0.90 + 0.05 0.70 + 0.05
(3-*) (3-**) (2**)
Mean Neonate 2.21 jh 0.06 2.13 i 0.06 2.26^ 0.06 Weight (grams)
MATERNAL WEIGHT GAIN Cgrams^
During Dosing (g.d. 5.94 J: 0.39 6.39 jt 0.39 5.91 ± 0.39
10-13)
Total (g.d. 0-17) 23.60 J: 0.92 23.61 ± 0.92 24.41 _f 0.92
^ Values are least squares means {± S.E.).
* Significantly different from indicated litter, p _< 0.05. ** Significantly different from indicated litter, p_< 0.01.
Variable
Table VI
Neonatal and Maternal Effects of Dinocap (40 mg/kg/d)
Litter 1 Litter 2 Litter 3
POSTNATAL DAY 1
Total Number
Neonates/ Litter 9.79 + 0.66^
(2-*)
11.67 + 0.66
(1-*)
10.08 J; 0.66
Number Live Neonates/ Litter
8.33 J; 0.89 9.46 + 0.89
(3-*)
6.71 + 0.89
(2-*)
Number Dead
Neonates/ Litter
1.46 + 0.58 (3-*)
2.21 J: 0.58 3.38 + 0.58
(1-*)
Survival Rate 0.85 + 0.06
(3-**)
0.80 + 0.06
(3-*)
' 0.62 J: 0.06
(1-**; 2-*)
Mean Neonate
Weight (grains)
1.43 _t 0.04 1.37 J; 0.04
POSTNATAL DAY 3
1.41 jt 0.04
Number Live
Neonates/ Litter 233 ± 0.55 1.67 jt 0.55 1.04 jt 0.55
Number Dead
Neonates/ Litter 6.00 _t 0.95 7.79 J; 0.95 5.67 jh 0.95
Survival Rate 0.26 ± 0.06 0.15 jf 0.06 0.12 J: 0.06
Mean Neonate
Weight (grains)
2.10 jh 0.10 1.90 _f 0.12 2.24 _+ 0.12
MATERNAL WEIGHT GAIN (grams)
During Dosing (g.d. 10-13)
3.49 + 0.44
(3-*)
4.23 + 0.44
(3-**)
1.90 + 0.44
(l.*;2-**) Total (g.d. 0-17) 21.62 jh 0.90 22.41 jt 0.90 20.21 J: 0.90
^ Values are least squares means (+ S.E.).
Table VII
Neonatal and Maternal Effects of All-trans Retinoic Acid (10 mg/kg/d)
Variable Litter 1 Litter 2 Litter 3
POSTNATAL DAY 1
Total Number
Neonates/ Litter 10.91 jh 0.58^ 12.00 jf 0.58 11.45 ±0.58
Number Live
Neonates/ Litter
9.64 jf 0.68 11.54 jh 0.68 10.27 J: 0.68
Number Dead Neonates/ Litter
1.27 jh 0.35 ;; 0.45 ± 0.35 1.18 _f 0.35
Survival Rate 0.88 J: 0.03 0.96 jf 0.03 0.88 jh 0.03
Mean Neonate
Weight (grams)
1.61 _f 0.04 1.65 jt 0.04
POSTNATAL DAY 3
1.61 J: 0.04
Number Live
Neonates/ Litter 6.09 ± 0.91 7.77 + 0.91
(3-*)
4.86 + 0.91
(2-*)
Number Dead
Neonates/ Litter
3.54 _f 0.75 3.82 jh 0.75 5.41 ± 0.75
Survival Rate
Mean Neonate
Weight (grams)
0.55 _f 0.07 2.42 jt 0.08
0.64 + 0.07
(3-*)
2.35 J: 0.08
0.40 + 0.07
(2-*)
2.32 _f 0.09
MATERNAL WEIGHT GAIN (crams) During Dosing
(g.d. 11-13)
3.87^0.39 4.59 jh 0.39 3.97 jt 0.39
Total (g.d. 0-17) 25.32 jt 1.23 26.22 jt 1.23 24.62 J: L23
^ Values are least squares means (+ S.E.).
* Significantly different from indicated litter, p _< 0.05.
Table VIII
Neonatal and Materal Effects of All-trans Retinoic Acid (20 mg/kg/d)
Variable Litter 1 Litter 2 Litter 3
POSTNATAL DAY 1
Total Number
Neonates/ Litter 10.21 + 0.49^ 12.07 + 0.49 11.39 J: 0.49
(2-**) (1-**)
Number Live
Neonates/ Litter 7.64 J: 0.72 9.18 J: 0.72 8.68 J; 0.72
Number Dead 2.51 ± 0.52 2.56 jt 0.53 2.71^0.52
Neonates/ Litter
Survival Rate 0.74 _t 0.05 0.78 J: 0.05 0.75 ± 0.05 Mean Neonate 1.52^ 0.03 ' 1-51 ± 0.03 1.55 jt 0.03
Weight (grams)
POSTNATAL DAY 3
Number Live
Neonates/ Litter 0.89^0.33 1.00^ 0.33 1.43 J: 0.33
Number Dead
Neonates/ Litter 6.75 J; 0.68 8.18 jt 0.68 1.25 ± 0.68
Survival Rate 0.10 J: 0.03 0.09 _t 0.03 0.12 jt 0.03
Mean Neonate
Weight (grams)
2.21 jf 0.14 1.97 jh 0.14 2.17 jt 0.13
MATERNAL WEIGHT GAIN (erams") During Dosing (g.d.
11-13)
3.41 + 0.26
(2-**)
4.39 + 0.23
(1-**; 3-*)
4.10 + 0.23
(2-*) Total (g.d. 0-17) 25.69 J: 0.84 26.81^ 0.84 26.42 J: 0.85
^ Values are least squares means {± S.E.).
Table IX
Liver-to-Body Weight Ratios^
Variable Control Dinocap Dinocap (20 mg/kg/d) (40 mg/kg/d)
Liver/Body 0.072 ± 0.0017*' 0.071 ± 0.0020 0.073 ± 0.0018
Weight
^ Liver and body weights were measured following observation of the third litter on postnatal day 3.
^ Values are least squares means (+ S.E.).
Table X
Rank Test of Independence - Control
Litter 1 - Litter 2 Litter 1 - Litter 3 Litter 2 - Litter 3 Variable N Significance N Significance
POSTNATAL DAY 1
N Significance
Total Number
Neonates/ Litter
26 0.0165 26 0.0029 26 0.0727
Number Live
Neonates/ Litter
26 0.0191 26 0.0278 26 0.02418
Number Dead
Neonates/ Litter
26 < 0.0006 26 < 0.0001 26 < 0.0001
Survival Rate 26 0.0006 26 < 0.0001 26 < 0.0001
Mean Neonate
Weight
25 0.1416 25 0.0124 25 0.4722
POSTNATAL DAY 3
^umber Live TJeonates/ Litter
26 0.02116 26 0.0024 26 0.0517
Number Dead
Neonates/ Litter
26 < 0.0001 26 < 0.0001 26 < 0.0001
Survival Rate 26 0.0131 26 0.0005 26 0.0016
Mean Neonate
Weight
23 0.4346 23 0.0129 26 0.4921
MATERNAL WEIGHT GAIN
Dosing (g.d. 10-13)
26 0.0887 26 0.0003 26 0.0440
Dosing (g.d. 11-13)
24 0.7427 24 0.0003 26 0.3844
Total (g.d. 0-17)
Table XI
Rank Test of Independence - Dinocap (20 mg/kg/d)
Litter 1 - Litter 2 Litter 1 - Litter 3 Litter 2 - Litter 3 Variable
Total Number 22 0.0531
Neonates/ Litter
Number Live 22 0.4716
Neonates/ Litter
Number Dead 22 0.0576
Neonates/ Litter
Survival Rate 22 0.0736
Mean Neonate 21 0.7024
Weight
Number Live 22 0.3418
^|Jeonates/ Litter
Number Dead 22 0.1076
Neonates/ Litter
Survival Rate 22 0.7353
Mean Neonate 20 0.5411
Weight
Dosing 22 0.4670
(g.d. 10-13)
Total 22 0.1498
(g.d. 0-17)
N Significance N Significance
POSTNATAL DAY 1
22 0.3006
22 0.1521
22 0.0248
22 0.01088
22 0.8776
POSTNATAL DAY 3
22 0.9269
22 0.7395
22 0.1555
20 0.9037
MATERNAL WEIGHT GAIN
22 0.5581
22 0.1064
N Significance
22 0.0005
22 0.0100
22 0.0011
22 0.0010
21 0.0275
22 0.2638
22 0.0138
22 0.0077
20 0.0353
22 0.6135
22 0.0030
Table XII
Rank Test of Independence - Dinocap (40 mg/kg/d)
Litter 1 - Litter 2_________Litter 1 - Litter 3 Litter 2 - Litter 3
Variable N Significance N Significance N Significance
POSTNATAL DAY 1
Total Number
Neonates/ Litter
24 0.4041 24 0.04957 24 0.2328
Number Live
Neonates/ Litter
24 0.2883 24 0.02194 24 0.20685
Number Dead
Neonates/ Litter
24 0.2765 24 0.12022 24 0.020165
Survival Rate 24 0.3429 24 0.20596 24 0.01694
Mean Neonate
Weight
24 0.2051 21 0.3769 21 0.94071
POSTNATAL DAY 3
Number Live
Neonates/ Litter
24 0.1743 24 0.00797 24 0.01246
Plumber Dead
Neonates/ Litter
24 0.2376 24 0.006302 24 0.09537
Survival Rate 24 0.3054 24 0.013116 24 0.004886
Mean Neonate
Weight
5 > 0.9999 7 > 0.9999 6 0.9632
MATERNAL WEIGHT GAIN
Dosing (g.d. 10-13)
24 0.01854 24 0.7572 24 0.4334
Total
(g.d. 0-17)
Variable
Table XIII
Rank Test of Independence - Retinoic Acid (10 mg/kg/d)
Litter 1 - Litter 2 Litter 1 - Litter 3
N Significance N Significance
POSTNATAL DAY 1
Litter 2 - Litter 3
N Significance
Total Number
Neonates/ Litter
22 0.1056 22 0.7163 22 0.02930
Number Live
Neonates/ Litter
22 0.006442 22 0.7159 22 0.1567
Number Dead
Neonates/ Litter
22 0.06720 22 0.1593 22 0.0358
Survival Rate 22 0.04825 22 0.1640 22 0.0606
Mean Neonate
Weight
22 0.001710 22 0.4024 22 0.1004
POSTNATAL DAY 3 Number Live
j^eonates/ Litter
22 0.01939 22 0.02724 22 0.001253
w
Number Dead
Neonates/ Litter
22 0.01558 22 0.0705 22 0.008356
Survival Rate 22 0.00367 22 0.0133 22 0.009026
Mean Neonate
Weight
18 0.1752 13 0.7095 14 0.8434
MATERNAL WEIGHT GAIN ͣ ' .-''''
Dosing (g.d. n-13)
22 0.6380 22 0.7954 22 0.0849
Total
(g.d. 0-17)
22 0.07888 22, 0.09992 22 0.004362
Table XIV
Rank Test of Independence - Retinoic Acid (20 mg/kg/d)
Litter 1 - Litter 2 Litter 1 - Litter 3 Litter 2 - Litter 3
Variable N Significance N Significance N Significance
POSTNATAL DAY 1
Total Number
Neonates/ Litter
27 0.3654 28 0.2132 27 0.0008
Number Live
Neonates/ Litter
28 0.0296 28 0.1067 28 0.0936
Number Dead
Neonates/ Litter
27 0.00109 28 0.0103 27 0.1208
Survival Rate 27 0.0005 28 0.0055 27 0.0772
Mean Neonate
Weight
25 0.2829 24 0.6106 24 0.1403
POSTNATAL DAY 3
Number Live
||Ieonates/ Litter
28 0.01082 28 0.0140 28 0.0530
w
Number Dead
Neonates/ Litter
28 0.1451 28 0.1308 28 0.1956
Survival Rate 27 0.01745 28 0.0104 27 0.1348
Mean Neonate
Weight
5 0.9074 5 >0.9999 5 0.9968
MATERNAL WEIGHT GAIN
Dosing (g.d. 11-13)
28 0.2461 28 0.0976 28 0.0094
Total
(g.d. 0-17)
Figure I
RANK TEST OF INDEPENDENCE
Variable
Control
0 mg/kg/d
Dinocap
20 mg/kg/d
Dinocap
40 mg/kg/d
Retinoic Acid
10 mg/kg/d
Retinoic Acid
20 mg/kg/d
Total #/Litter ͣ A A • •
> # Live/Litter ͣ ȋ • A ͣ ͣ
-2
Z
# Dead/Litter ͣ ȋ • A • • • ͣ A
Survival Rate ͣ A • A • • ͣ A
Mean Pup Wgt./Litter A
>
# Live/Litter ͣ A A • ͣ A • ͣ A
< a
# Dead/Litter
ͣ
A»
A ͣ •1 Survival Rate ͣ A • A • ͣ A • ͣ A
Mean Pup Wgt./Litter A
z
Dosing (g.d.10-13) A • ͣ
<
Dosing (g.d. 11-13) A •
Total (g.d. 0-17) ͣ ȋ• • • ͣ A •
I Litter 1 compared to Litter 2 ^^ Litter 1 compared to Litter 3
^^ Litter 2 compared to Litter 3
Markers indicate where the null hypothesis was rejected;
Table XV
Intraclass Correlation Coefficients
variable Control
f ^
Dinocap
20
mg/kg/d
Dinocap
40
mg/kg/d
Retinoic Acid 10
mg/kg/d
Retinoic
Acid 20
mg/kg/d
POSTNATAL DAY 1
Total Number
Neonates/ Litter 0.3999 0.1823 0.1438 0.0760* 0.0896'
Number Live 0.3816 0.1666 0.2310 0.1928 0.3103 Neonates/ Litter
Number Dead 0.1001 0.1645 0.2696
Neonates/ Litter
Survival Rate --- 0.0476 0.1218 0.2950
Mean Neonate 0.2031 __.._^ 0.3223 0.0484
Weight
POSTNATAL DAY3
||Jumber Live 0.3697 0.0247* 0.0866 0.4070 0.2033
TJeonates/ Litter ͣ
t' . ^
Number Dead 0.37 JO ... 0.2741 0.3190 0.1412
Neonates/ Litter
Survival Rate 0.0288 0.1242 0.4072 0.2061
Mean Neonate 0.1994 0.1386 --- 0.2974
Weight (grams)
MATERNAL WEIGHT GAIN
During Dosing 0.4047 0.0440* 0.0040* (g.d. 10-13)
During Dosing 0.2450
---0.0063 0.1224
(g.d. 11-13)
Total (g.d. 0-17) 0.3799 0.1396 0.3050 0.1463 0.4626
APPENDIX - PILOT STUDIES
BACKGROUND
Five chemicals were chosen for the initial study. These chemicals were
dinocap, nitrofen, 2,4,5-trichlorophenoxyacetic acid (2,4,5-T), valproic acid, and all-trans
retinoic acid. All of the chemicals are known developmental toxicants in the mouse.
The first pilot study assessed all five chemicals using four or five treatment groups. Tlie
second pilot study reassessed three of the chemicals using three treatment groups. Dose
levels were selected based upon results of previous studies conducted in the
Environmental Protection Agency's Health Effects Research Laboratory or reported
values in the literature. The dose levels were selected to produce defects that were
readily observable and compatible with neonatal life for at least the first day after birth.
METHODS
Timed pregnant CD-I mice (Charles River) were received on day 3 of
gestation. Day 1 of gestation was recorded upon demonstration of a sperm plug. Each
animal was housed individually and kept in a temperature-controlled (20-24° C) bioclean
room with a 12-h light/dark cycle. They were fed commercial lab diet and water ad libitum. The mice were assigned to dose groups such that the mean weight and variance were similar in all dose groups, with equal animals per group. All chemicals were
administered in 0.2 ml of corn oil by gastric intubation for 3 to 4 days during gestation
days 8 through 13 (see Tables A-I through A-VIII for dosing days and dosage levels for
specific chemicals). Dosing solutions were corrected for chemical purity and prepared
based upon average maternal weight on day 8.
Endpoints were evaluated following an in vivo teratology screening test
(Chernoff and Kavlock, 1982). These endpoints included: maternal body weight gain;
evidence of maternal toxicity; evidence of developmental effects, and offspring viability
and growth through postnatal day 3.
RESULTS AND DISCUSSION
The results of the first and second pilot studies are summarized in Tables A-I
through A-V and A-VI through A-VIII, respectively. Evidence of maternal toxicity was
seen as a decrease in body weight gain for animals treated with three of the chemicals.
This was observed in seven treatment groups as follows: 2,4,5-T at 100, 200, and 400
mg/kg/day for gestation days 10 through 13 (Table A-V); nitrofen at 200 and 250
mg/kg/day for gestation days 8 through 11 (Table A-VI); and dinocap at 60 and 80
mg/kg/day for gestation days 10 through 13 (Table A-VII). Maternal toxicity was also
observed as the death of two dams treated with 80 mg/kg/day dinocap on gestation days
10 through 13 (Table A-VII). '
Maternal treatment with dinocap at 40 mg/kg/day during gestation days 11
through 13 caused an increase in neonatal death and an increase in mean pup weight by
postnatal day 3. No effects were seen at dose levels of 10, 20, and 30 mg/kg/day (Table
I). In the second pilot study, the dosing period was extended to include day 10 of
gestation and the maternal dose was increased. These changes resulted in an increase in
neonatal death per litter on postnatal day 1 (at 40 and 80 mg/kg/day), a decrease in
increase in neonatal death per litter on postnatal day 3 (40, 60, and 80 mg/kg/day)
(Table VII). ^ r
In the first pilot, all-trans retinoic acid given to pregnant CD-I mice on days 11 through 13 of gestation resulted in a decrease in the number of live neonates
observed per litter on postnatal day 3 (25 and 50 mg/kg/day) and, thus, an increase in
the number of dead neonates per litter also on postnatal day 3 (12.5, 25, and 50
mg/kg/day) (Table A-II). Similarily, results from the second pilot study showed a
decrease in neonatal survival for all three treatment groups (12.5, 18.75, and 25 mg/kg/day) (Table A-VIII).
Maternal treatment with valproic acid at 300, 400, 500, and 600 mg/kg/day
during days 11 through 13 of gestation produced no statistically significant differences in
treated compared to control animals (Table A-III).
Nitrofen (250 mg/kg/day) given to dams on days 8 through 11 of gestation in
the first pilot study produced a decrease in the number of live neonates per litter and,
thus, an increase in the number of dead neonates per Utter observed on postnatal day 3
(Table A-IV). In the second pilot study, differences between treated versus control
animals included an increase in the number of dead neonates per litter on postnatal days
1 and 3 (200 mg/kg/day), a decrease in mean pup weight on postnatal days 1 (200 and
225 mg/kg/day), an increase in neonatal death per litter on postnatal day 3 (200, 225,
and 250 mg/kg/day) and a decrease in mean neonate weight on postnatal day 3 (200,
225, and 250 mg/kg/day) (Table A-VT).
The effects of maternal dosing with 2,4,5-T during gestation days 10 through
13 included an increase in mean neonatal weight on postnatal days 1 and 3 in the 200
mg/kg/day treatment group but, a decrease in this parameter on postnatal days 1 and 3 for animals dosed at 400 mg/kg/day. A decrease of neonatal survival as evidenced by a decrease in the number of live neonates per litter and an increase in the number of dead neonates on postnatal day 3 was also observed at the highest dose (400 mg/kg/day)
(Table AV).
-Based upon the results of the two pilot studies, two chemicals were chosen for
further study using the multiple breeding protocol presented in the main text of this
report. These chemicals and associated dosing regimes were dinocap at 20 and 40
mg/kg/day on days 10 through 13 of gestation and all-trans retinoic acid at 10 and 20 mg/kg/day on days 11 through 13 of gestation. The treatment levels were selected to
produce minimal or no maternal toxicity. The two dosage levels per chemical were
chosen such that approximately 25 to 35 percent of the litters would be affected at the
low dose and approximately 50 to 75 percent of the litters would be affected at the high
Parameter 0
Table A-I
Pilot Study I
Maternal and Neonatal Effects of Dinocap Maternal Dose (mg/kg/day)''
10 20 30 40
MATERNAL EFFECTS
Number Pregnant 12 2 3 3 3
Number Not 2 3 2 2 2
Pregnant Maternal Weight Gain (grams) 19.29 + 1.63'' 18.85 + 3.99 15.13 + 3.26 12.50 Jt 3.26 14.10 Jt 3.26 [g.d. 11-17]
1f LITTER EFFECTS - POSTNATAL DAY 1
Live Neonates/ 10.92 Jt 10.50 J: 9.33 Jt 8.00 Jt 8.33 +2.27
Litter 1.14 2.78 2.27 2.27
Dead Neonates/ 0 0 0 0 0
Litter Mean Neonate weight (g) 1.63 _t 0.05 1.62 jf 0.12 LITTER EFFECTS 1.67 J: 0.10
- POSTNATAL DAY 3
1.76 Jt
0.10
1.85 Jt
0.10
Live Neonates/ 10.92 J: 11.00 J: 9.33 i 8.00 Jt 8.00 +
Litter 1.14 2.81 2.29 2.29 2.29
Dead Neonates/ 0 J: 0.06 0± 0.14 0± 0.11 Ojf 0.11 0.33 _f
Litter
0.11 *
Mean Neonate 2.32 J: 2.32 + 2.50 + 2.85 Jt 3.05 Jt
Weight (g) 0.15 0.37 0.30 0.30 0.30 *
^ Dosed days 11 throught 13 of gestation. Values are least squares means (+ S.E.). * Significantly different from controls, p _< 0.05.
Parameter
Table A-II
Pilot Study I
Maternal and Neonatal Effects of All-Trans Retinoic Acid
Maternal Dose (mg/kg/day)^
0 6.25 12.5 25 50
MATERNAL EFFECTS
Number Pregnant 12 1 3 3 1
Number Not 2 4 2 2 4
Pregnant
Maternal Weight 19.29 + 15.90 _t 17.57 +
15.13 Jt 19.80 +
Gain (grams) 1.68" 5.84 3.37 3.37 5.84
[g.d. 11-17]
LITTER EFFECTS POSTNATAL DAY 1
Live Neonates/ 10.92 J: 10.00 Jt 11.33 J: 8.00 jt 9.00 Jt
Litter 1.00 3.46 2.00 2.00 3.46
Dead Neonates/ 0 0 0 0
0
Litter
Mean Neonate 1.63 _+ 1.62 J: 1.60 +
1.67 Jt 1.46 +
Weight (g) 0.05 0.16
LITTER EFFECTS
0.09
- POSTNATAL DAY 3
0.09 0.16
Live Neonates/ 10.92 jt 10.00 J; 10.33 J: 4.33 + Ojt 3.29*
Litter 0.95 3.29
1.90 1.90
Dead Neonates/ Ojh 0.27 0_t 0.94 1.33 + 3.67 Jt 9.00 +
Litter
0.54* 0.54 * 0.94*
Mean Neonate 2.32 J; 2.44 J:
2.45 Jt 2.57 +
Weight (g) 0.11 0.38 0.22
0.22
^ Dosed days 11 throught 13 of gestation.
Values are least squares means (+ S.E.).
Parameter
Table A-TII
Pilot Study I
Maternal and Neonatal Effects of Valproic Acid
Maternal Dose (mg/kg/day)^
0 300 400 500 600
MATERNAL EFFECTS
Number Pregnant 12 3 3 3 3
Number Not
Pregnant
2 2 2 2 2
Maternal Weight Gain (grams) [g.d. 11-17] 19.29 + 1.58*' 16.47 jt 3.15 LI'lJER EFFECTS 17.40 + 3.15 (K- ... ͣ
POSTNATAL DAY 1
15.77 J-3.15 12.57 + 3.15 kive Neonates/ 'itter 10.92 J: 1.06 11.00 + 2.12 12.00 + 2.12 11.33 J: 2.12 8.67 J: 2.12 Dead Neonates/ Litter
0 0 0 0 0
Mean Neonate Weight (g) 1.63 J: 0.04 1.49 _f 0.09 LITTER EFFECTS 1.43 + 0.09
- POSTNATAL DAY 3
1.46 _+ 0.09 1.62 + 2.15 Live Neonates/ Litter 10.92 jh 1.07 10.33 + 2.15 12.00 J: 2.15 11.33 jt 2.15 8.67 J; 2.15 Dead Neonates/ Litter
0± 0.11 0.67 J:
0.22*
0 J: 0.22 OJ: 0.22 OJ: 0.22
Mean Neonate Weight (g) 232 ± 0.10 2.03 _f 0.20 1.89 ± 0.20 2.00 _f 0.20 2.34 _f 0.20*
^ Dosed days 11 throught 13 of gestation.
Values are least squares means (+ S.E.). * Significantly different from controls, p _< 0.05.
Parameter 0
Table A-IV
Pilot Study I
Maternal and Neonatal Effects of Nitrofen
Maternal Dose (mg/kg/day)*
50 160 150 200 250
MATERNAL EFFECTS
Number
Pregnant
12 4 4 3 3 2
Number Not
Pregnant
:2 1 1 2 2 ^3 ͣ '';
Maternal
Weight Gain (grams) [g-d. 8-17]
19.29
J:1.40''
22.48 +
2.43
21.30 jf
2.43
18.17 J:
2.81
23.11 ±
2.81
20.65 ±
3.44
LITTER EFFECTS - POSTNATAL DAY 1
l,ive Neonates/ 10.92 J: 11.75 J: 10.75 + 8.67 + 10.33 J; 9.00^
l,itter 0.94 1.63 1.63 1.88 1.88 2.30
Dead Neonates/ 0 0 0 0 0 0
Litter
Mean Neonate 1.63 + 1.50 J: 1.49 jt 1.52 i 1.52 + 1.59 +
Weight (g) 0.04 0.07 0.07 0.08 0.08 0.10
LITTER EFFECTS - POSTNATAL DAY 3
Live Neonates/ 10.92 J: 11.50 + 10.75 jt 8.33 jh 9.00 jh 4.50 jt
Litter 0.88 1.52 1.52 1.76 1.76 2.15*
Dead Neonates/ 0 + 0.25 jt OJ: 0.67 J: 1.33 J: 4.50^
Litter 0.43 0.74 0.74 0.86 0.86 1.05 *
Mean Neonate 2.32 J: 2.10 -1- 2.20 _f 2.10 jh 2.23 J: 2.24 _+
Weight (g) 0.09 0.16 0.16 0.19 0.19 0.23
'^ Dosed days 8 through 11 of gestation.
Values are least squares means (+ S.E.).
Parameter
[g.d. 10-17]
0
Table A-V
Pilot Study I
Maternal and Neonatal Effects of 2,4,5-T
Maternal Dose (mg/kg/day)^ 50 100 200
MATERNAL EFFECTS
LITTER EFFECTS - POSTNATAL DAY 1
Dosed days 10 through 13 of gestation. Values arc least squares means (_+ S.E.).
Significantly different from controls, p <ͣ 0.05.
300 400
Number : 12 4 3 4 3 3
Pregnant
Number Not 2 1 2 1 2 2
Pregnant
Maternal 19.29 19.07 + . 12.33 13.20 14.57 + 10.43
Weight Gain (g) J: 2.97'' 2.97 ^1.48* J:2.97* 2.97 J;2.57
^ive Neonates/ 10.92 _t 8.50 J: 7.67 _f 7.25 _f 6.00 J: 6.00 J:
Litter 1.13 1.96 ?..?! 1.96 2.27 2.27
Dead Neonates/ Ojh 2.50 + 0± 0 + 2.67 J: 0.33 +
Litter 0.65 1.13 Ul 131 1.31 1.31
Mean Neonate 1.63 J: 1.56 jh 1.79 + 1.82 jh 1.64 jf 1.27 _f
Weight (g) 0.04 0.08 Qjm 0.07* 0.08 0.08*
LITTER EFFECTS - POSTNATAL DAY 3
Live Neonates/ 10.92 J: 8.50 + 7.67 jt 7.25 + 6.00 _f 2.23 jh
Litter 1.11 1.92 2.21 1.92 2.21 2.21*
Dead Neonates/ o_t o± o± OJ: OJ: 3.67 jf
Litter 0.22 0.44 0.44 0.38 0.44 0.44 *
Mean Neonate 2.32 J; 2.08 ± 2.70 J: 2.93 J: 2.55 J: 2.44 jf
Weight (g) 0.09 0.19 0.19 0.16* 0.19 0.33
Table A-VI
Parameter
Number Pregnant Number Not Pregnant Maternal Weight Gain (g) [g.d. 8 -11]
Live Nconalcs/Litter
Dead Neonates/Litter
Mean Neonate Weight
Live Neonates/Litter Dead Neonates/Litter Mean Neonate Weight (g)
Pilot Study II
Maternal and Neonatal Effects of Nitrofen
Maternal Dose (mg/kg/day)^
0 200 225
MATERNAL EFFECTS 11 6 5 7 3 4
10.30 jh 0.90" 6.11 ± 1.22 * 7.32 jh 1-34
LITTER EFFECTS - POSTNATAL DAY 1
8.27 _t 1.19 7.50 jt 1.62 10.40 J; 1.77 0.27 jh 0.40 1.67j;0.54* 1.00 J: 0.60 1.69 jt 0.06 1.38 J; 0.07* 1.42 J: 0.08 *
LITTER EFFECTS - POSTNATAL DAY 3
9.40^ 1.08
OJ: 0.46
2.27 + 0.08
3.83 J: 1.40 * 3.67 jf 0.59 *
1.94 + 0.11 *
6.40 J: 1.53 4.00 jh 0.65 *
1.78 + 0.11 *
250
5
4
4.26 + 1.34 ͣ''
5.60 _f 1.77
0.60 jh 0.60
1.46 + 0.10
6.00 ± 2.00 3.83 jh 0.84 *
1.71 + 0.14 *
^ Dosed days 8 through 11 of gestation.
Parameter
Table A-VII
Pilot Study II
Maternal and Neonatal Effects of Dinocap
Maternal Dose (mg/kg/day)^
0 40 60 80
MATERNAL EFFECTS
Number Pregnant 11 5 6 3 Number Not Pregnant 7 4 3 4
Number Dead 0 0 0 2
Maternal Weight Gain (g) [g.d. 10-13J
10.30 jf 0.93*' 8.54 jh 1.38 5.90 jf 1.25 *
LlllER EFFECTS - POSTNATAL DAY 1
7.00 _f 1.77 *
live Neonates/Litter 8.27 J: 1.31 6.40 jh 1-95 6.33 J; 1.78 5.33 Jh 2.52
W
Dead Neonates/Litter 0.27 _+ 0.60 4.00 J: 0.89 * 1.83 jh 0.81 3.00 ±1.15* Mean Neonate Weight
(g)
1.69 jt 0.04 1.40 jf 0.06 * 1.29 _+ 0.07 *
LllfER EFFECTS - POSTNATAL DAY 3
1.20 i 0.08 *
Live Neonates/Litter Dead Neonates/Litter Mean Neonate Weight (g)
9.40 Jh 0.99 1.80 J: 1.41 * 0.50 jh 1.57 Ojh 0.64 4.60 Jh 0.90* 9.00 jh 1.01 * 2.27 + 0.10 2.09 + 0.23 1.65 + 0.32
Ojh 1.82 *
5.33 + 1.17 *
^ Dosed days 10 through 13 of gestation.
'' Values are least squares means C+ S.E.).
* Significantly different from controls, p _< 0.05.
Parameter
Table A-VIII
Pilot Study II
Maternal and Neonatal Effects of All-trans Retinoic Acid
Maternal Dose (mg/kg/day)^
0 12.5 18.75 25
MATERNAL EFFECTS
Number Pregnant 11 7 8 5
Number Not Pregnant 7 3 1 3 Maternal Weight Gain
(g) [g.d. 11-13]
10.30 J: 0.87*' 11.21 J: 1.09 10.22 J: 1.02 11.28 _+ 1.28
LITTER EFFECTS - POSTNATAL DAY 1
Live Neonates/Litter 8.27 jt 1.15 8.00 J; 1.45 8.38 jh 135 9.40 J: 1.71
Dead Neonates/Litter 0.27 jf 0.46 1.43 jt 0.58 0.88 jt 0.54 0.80 J: 0.69
f
Mean Neonate Weight (g)
1.69 J: 0.05 1.67 J: 0.06 1.61 jt 0.06 1.52 jt 0.07
LITTER EFFECTS - POSTNATAL DAY 3
Live Neonates/Litter Dead Neonates/Litter Mean Neonate weight (g)
9.40 _t 1.08 4.57 jt 1.29 * 3.62 J: 1.21 * 0 J: 0.78 3.43 J; 0.93* 4.75 jf 0.87 *
2.27 + 0.11 2.38 + 0.14 2.16 + 0.15
0.20 J: 1.53 * 9.20 jh 1.10 *
1.60 + 0.36