ACKNOWLEDGEMENTS
I would like to express my sincere appreciation to the following people; Dr. Crawford-Brown and Dr. Willhoit for being readers on my Technical Report committee; my parents, Lynette and John for their lifetime support; and last but not
least, my advisor. Dr. Jim Watson for the academic guidance, patience, and friendship shown me over the past few years.
I. INTRODUCTION. ...4
Overview...4
Purpose and Obj ective...8
II LITERATURE REVIEW... ...10
Performance Characteristics of Charcoal Adsorption Collectors...10
III MATERIALS... . . . ...19
Radon chamber...19
Alpha scintillation Cells...22
Alpha scintillation cell counting system...24
Pylon AB-5 Monitor...26
Charcoal canisters...26
Charcoal canister counting system...28
IV PROCEDURES...31
Alpha scintillation cell sampling and counting equipment-procedures for use...31
Calibration of Pylon AB-5 monitors...33
Programming the Pylon AB-5 Monitors...33
Test of Pylon 1 and 2 Efficiencies with standard Radium/Radon source...34
Pylon calibration factors using alpha cell count rates...35
Canister Performance Testing-Adsorption...36
Canister Performance Testing-Desorption...39
V. RESULTS...45
Canister Adsorption Testing Results...45
Canister Desorption Testing Results...51
Canister with Desiccant Testing Results-Adsorption...56
canister with Desiccant Testing Results-Desorption...58
VI. CONCLUSIONS AND RECOMMENDATIONS...62
REFERENCES...66
APPENDIX I PYLON EFFICIENCY TESTING DATA...67
APPENDIX II CHARCOAL CANISTER ADSORPTION DATA...68
APPENDIX III CHARCOAL CANISTER DESORPTION DATA...7 0 APPENDIX IV CHARCOAL CANISTER WITH DESICCANT ADSORPTION DATA...7 2 APPENDIX V CHARCOAL CANISTER WITH DESICCANT DESORPTION DATA...74
APPENDIX VI DESICCANT AND CHARCOAL WATER ADSORPTION DATA...76 APPENDIX VII ADSORPTION AND DESORPTION CURVES CORRECTED
LIST OF FIGURES
FIGURE 1 RADIUM DECAY CHAIN... 5
2 ANNUAL EFFECTIVE DOSE EQUIVALENT TO US POP.... 7
3 RADON-222 EXPOSURE CHAMBER...20
4 RADON-222 SOURCE...21
5 ALPHA SCINTILLATION CELL...23
6 ALPHA SCINTILLATION CELL COUNTING SYSTEM...25
7 PYLON AB-5 MONITOR...27
8 CHARCOAL CANISTER COUNTING SYSTEM...30
9 ADSORPTION CURVES...46
10 ADSORPTION CURVES: 1" CC...47
11 ADSORPTION CURVES: 1.5" CC...48
12 DESORPTION CURVES : OF & SS...52
13 DESORPTION CURVES: 1" CC...53
14 DESORPTION CURVES: 1.5"...55
15 DESICCANT ADSORPTION CURVES...57
INTRODUCTION OVERVIEW
Radon is a naturally occurring, radioactive, inert gas that is one of the nuclides emitted in the uranium-238 {238U)
radioactive decay series. Upon its decay, radon produces
additional radioactive elements which are referred to as radon
progeny. Present throughout the environment, radon-222 (222Rn)
accounts for 55% of the total radiation dose to the United States
population. Concern has grown over the effects of 222Rn
exposures because of the increased lung cancer potential from breathing radon contaminated air in enclosed living and working
spaces.
Radon gas emanates from soils containing uranium deposits. If the soil under a house, or surrounding the basement of a house, contains uranium deposits, the escaping radon gas may become trapped in houses whose foundations are set in or on the
soil. The concentration of radon in a building depends on the
presence of uranium in the soil at that location, the ability of
the radon to seep through the soil, and the entry routes of radon
into the house from the soil.
Radon-222 is emitted from the natural decay of radium-226
(226 Ra) which is part of the 238U decay series. The emission of
radon is represented by the decay chain shown in Figure 1
beginning with 226Ra. Radon-222 and its progeny, polonium-218
RADIUM DECAY CHAIN
226Ra---> 222Rn---> 218po---> Zli^^---.
1600 y 3.82 d 3.05 m 26.8 m* 4.78 95% 5.49 100% 6.0 100% 0.65 50% 4.60 5% 0.71 40% 0.98 6%
.> 214Bi---> 214po--->210pb
19.7 m 164 us 21 y
1.51 40% 7.69 100%
1.0 23% 3.26 19<?.
Alpha particles have high linear energy transfer, which results
in a large deposit of energy in a small volume. Alpha particles can give a considerable dose to biological tissues. The lungs absorb most of the dose form alpha particles emitted by inhaled radon progeny. Radon concentration is usually expressed as the activity (picocurie) per unit volume, typically a liter (1). One pCl/1 corresponds to 0.037 222Rn atom disintegrations per second
within one liter of air.
The National Council on Radiation Protection and
Measurements estimates the average annual effective dose
equivalent to United States citizens from 222Rn to be 200 mrem of the 360 mrem total annual effective dose equivalent from all
sources as shown in Figure 2 (NCRP 1988). The dose received from radon is the largest percentage of the dose received from
naturally occurring radioactivity, and is approximately three times that of the dose received from man-made sources (NCRP
1987b).
The Environmental Protection Agency (EPA) states that,
second to smoking, the inhalation of radon gas is the leading
cause of cancer in the United States (EPA 1986). The EPA
estimates that between one and five persons out of 100 exposed to
4 pCi/1 of radon for their lifetime will die from 222Rn induced
lung cancer. As the radon concentration increases, the
associated lung cancer risk increases. For this reason, the
radon concentration in an enclosed living or working area should
Figure 2: Annual Effective Dose Equivalent in U.S. Populations (1980-1982) as a
Percentage of 360 mrem
Internal 10%
CD I
Terrestrial 8%
Medical X-ray 11%
•Other <1%
Occupational...0.3%
Faltout...<0.3%
Nuclear Fuel Cycle...0.1%
Cosmic
Radon 55%
Nuclear Medicine 4%
Consumer Products
^ 1%
The determination of the radon concentration in private homes
has become a national concern. Because most individuals
spend at least one third of each day at home, the inhalation of
radon contaminated air in the home can increase lung cancer risk.
To assess the radon concentration of houses in the United States, an inexpensive, durable, fast, efficient, and reliable method of
testing must be available. The charcoal adsorption canister
satisfies these criteria, and several types of charcoal
adsorption canisters are being used to make screening
measurements in houses today. However, because charcoal canister adsorption can be affected by humidity and temperature
fluctuations, diffusion barriers have been added to the canisters
to enhance the performance characteristics, and to extend the
measurement period.
PURPOSE AND OBJECTIVE
The purpose of this thesis was to compare the performance
characteristics of different types of radon diffusion barrier
canisters. The adsorption and desorption characteristics of fourteen different types of diffusion barrier canisters were
compared to each other and to the adsorption and desorption
characteristics of an open face canister. In a separate
experiment, desiccant packs were added to five different
diffusion barrier canisters, and the radon adsorption and
desorption characteristics of the canister types were compared to
each other and to the adsorption and desorption characteristics
tests were conducted in the UNC radon chamber under controlled
conditions.
LITERATURE REVIEW
PERFORMANCE CHARACTERISTICS OF CHARCOAL ADSORPTION COLLECTORS Adsorption of a gas on granular activated carbon is the
process where the individual molecules of the gas adhere to the
carbon grain surface. Atoms of the radioactive gas 222Rn are bound to the granular activated carbon surface by weak Van der
Waals forces (Cohen 1988). The adsorption of gaseous 222Rn on the
activated charcoal (Q) depends on the airborne radon
concentration (C), the adsorption coefficient of the gas (k), and
the mass of the activated charcoal (m), (Cohen 1983). The activity of the gas adsorbed per unit mass on the granular activated charcoal is the parameter that will be used in this study. This parameter is represented by the following equation:
Q (pCi) / m (g) = k (1/g) C (pCi/l). (Cohen 1983) The physical ability of the radioactive gas to adsorb on granular carbon depends on several factors. The carbon grain size, shape, and pore distribution, as well as environmental
temperature and humidity influence the overall gas adsorption on
the surface of the carbon grain (Thomas, 1991). The pores in the
granular activated carbon maximize the surface area presented by
the small size and cubical shape of the carbon granules, which
makes granular carbon an ideal adsorbing medium for radon gas. When activated and placed in a suitable container, granular
activated charcoal is used for measuring radon concentrations in
indoor air.
Radon adsorption decreases as temperature increases (Cohen
1988). As the temperature of a gas rises, the kinetic energy of
the gas molecules increases. The increased kinetic energy of the
radon molecules exceeds the weak binding energy of the Van der Waals forces that bind the radon molecules to the GAC (Cohen
1988), therefore preventing stable radon adsorption on the GAC.
In practice, most laboratories recycle the exposed radon canisters by baking the GAC in an oven at 100 C (Cohen 1986), which takes advantage of the fact that radon desorption from GAC
increases as temperature rises.
Granular activated charcoal is an excellent adsorber for water vapor as well as radon. As the humidity in a testing
location increases, the quantity of radon adsorbed is reduced because the water vapor competes for adsorption sites on the GAC
(Cohen and Nason 1986). Typically, for a given carbon mass at a
constant temperature, twice as much radon can be adsorbed at 25% humidity as at 80% humidity (Cohen 1988). if the water molecules block the normally available binding sites on the GAC, the lower quantity of radon adsorbed will incorrectly indicate a lower
radon concentration in the room.
A radon sampling device used for indoor radon sampling should be durable, inexpensive, simple to operate, easily
analyzed, and mailable to and from the test site (Cohen 1988). The charcoal canister satisfies each of these criteria. The
charcoal is contained in a metal "ointment tin" which can be sealed air tight until the canister is exposed in the sample location, and resealed once the sampling is complete. The
granular activated charcoal is relatively inexpensive, and
recyclable, as is the outside container. As long as an operator follows a few instructions and reseals the canister correctly, the quantity of radon adsorbed during the exposure period can be correctly determined by gamma ray scintillation counting the canister.
The charcoal canister has been used as an adsorption
collector for measuring the radon concentrations in indoor air for more than ten years. First introduced by George in 1981, the radon adsorption canister has undergone relatively few design modifications. The depth of the charcoal bed in the canister as well as the effects of the addition of diffusion barriers and
desiccant packs to the canisters have been studied. When added to the canisters, diffusion barriers and desiccants enhance the performance characteristics of the basic charcoal canister.
The adsorption of radon in a charcoal bed is a function of
charcoal bed depth and exposure time (Cohen 1983). The charcoal canister contains a bed of granular activated charcoal which adsorbs a sample of radon from the air when the canister is
properly exposed at a specific site for a predetermined amount of time. Usually, the diameter of the granular activated charcoal bed (or canister) does not exceed 7 cm because the diameter of most gamma ray detectors does not exceed 7 cm (Cohen 86). The quantity of radon adsorbed on a charcoal bed does not increase as the bed depth is increased beyond 1.5 cm (Cohen 1983).
The diffusion of the radon into the canister is negated by the radioactive decay and diffusion out of the charcoal bed when
the bed depth exceeds 1.5 cm. The diffusion front of the gas is reflected from the container bottom back to the top of the
charcoal bed (Cohen 1983). Deeper charcoal beds also hinder the
performance of the gamma ray counting device by placing the radon
decay products farther from the counting device and absorbing the
liberated gamma rays before they reach the Nal crystal of the
counting device (Cohen 1986).
Open face canisters and diffusion barrier canisters are the two types of charcoal adsorbers that are currently used to
measure radon. The open face canister exposes the granular activated charcoal directly to the testing atmosphere once the canister is opened. The diffusion barrier canister uses a porous material to protect the charcoal from direct contact with the testing space. The radon gas must first diffuse through the
porous material before it can be adsorbed on the surface of the
charcoal in the diffusion barrier canisters.
The open face charcoal adsorber is typically used for radon
testing with two day exposure periods (George and Weber 1990).
The advantage of the open face canister is that it can adsorb large amounts of radon quickly and efficiently. The principle disadvantage of the open face canister is that its radon
adsorption is not indicative of the average concentration when
there are large fluctuations in room radon concentration (Cohen 1988). The radon level in a room is subject to diurnal cycles, in which the radon concentration in the morning is higher than the concentration in the evening (Cohen 1988). Because radon
desorbs from the GAC while it is adsorbing, the open face
canister measurements will represent the radon concentration in
the room during the last few hours of exposure more than that
concentration present during the first few hours of exposure
(Cohen 1988). If the room experiences radon fluctuations
diurnally, the canister result will depend on the time of day the
operator sealed the canister.
Other disadvantages include the succeptability of the GAC in
the open face canister to be influenced by temperature and
humidity effects, as well as decreased effective exposure time in the testing area. Ultimately, the open face canister results represent "grab samples" (Cohen 1988, George and Weber 1990).
This may or may not adequately describe the average radon
concentration profile of the testing location because grab
sampling does not integrate the concentration adsorbed over a
long period of time.
The main objectives of the use of diffusion barrier
canisters are to decrease the amount of water vapor adsorbed by the GAC; reduce the rate of 222Rn adsorption to, and desorption from the GAC inside the canister; reduce the effects of extreme fluctuations in 222Rn concentration; and extend the exposure time of the collector in the testing location (George and Weber 1990). Diffusion barrier canisters are less sensitive to humidity
effects than those of open face canisters (Cohen 1988) because
the diffusion barrier separates the GAC from the actual testing
environment and physically hinders water molecules from rapidly
entering the canister as experienced with open face canisters.
The reduction of water molecules on the surface of the GAC would allow for more radon adsorption on the GAC.
By fitting a diffusion barrier to the opening of a canister, the radon gas flow in and out of the canister is reduced. The
maximum amount of radon that can be adsorbed in diffusion barrier
collectors is about half of that adsorbed in open face canisters
(Cohen 1988). Thus a disadvantage of diffusion barrier canisters
is the amount of radon adsorbed during the exposure period is reduced, but an advantage is the canister is not as succeptable to radon concentration fluctuations that may exist in the testing
area (Cohen 1988). The diffusion barrier slows down the
diffusion of radon in and out of the canister, which allows the GAC to more closely measure the average concentration of radon present in the room (Cohen 1988). The radon concentration in the room may fluctuate, but the diffusion barrier only allows small quantities of radon near the GAC for adsorption and does not
allow desorbing radon to escape to the atmosphere as fast as open face canisters. The physical hindrance of radon adsorption and desorption by the diffusion barrier allows the radon measurement to be averaged over a longer period of time (Cohen 1988,
Nagarajan, et. al. 1990). Typically, diffusion barrier canisters have an integration time constant of 84 hours (Cohen 1988) and are exposed up to seven days (George and Weber 1990).
A humidity correction must be used with open face canister results to determine room radon concentrations. The open face collectors measure radon concentrations accurately up to
approximately 4 days provided the humidity is less than 55-•%
(George and Weber 1990). Empirically determined calibration
factors are used with open face canister calculations. Each open face canister is weighed before and after exposure and the water weight gain is compared with previous experimental data to
determine the correct humidity correction factor that should be
used.
Diffusion barrier canisters, however, are essentially insensitive to humidity effects and determinations of radon
concentrations do not involve humidity calibration factors (Cohen
1988). The physical hindrance of water vapor adsorption by the diffusion barrier allows the omission of the humidity dependent calibration factor in the concentration calculations. As a result, more homes are tested for radon with diffusion barrier canisters than with open face canisters (Cohen 1988.)
An attempt to control the effects of humidity on GAC
adsorption also has been implemented by placing desiccant packs in close proximity to the GAC. In experiments by Cohen and Nason
(1986), desiccant packs were added in different configurations on the charcoal adsorbers. Insertion of the desiccant did not hinder the diffusion of radon into or out of the canister, yet, did not effectively reduce the moisture uptake on the GAC as expected. The most effective method of attaching the desiccant pack to the canister was securing the pack over the canister opening (Cohen and Nason 1986). The desiccant wrapper acted as a diffusion barrier as well (Cohen and Nason 1986).
A recent study of diffusion barrier canisters (George and Weber 1990) concluded that porous stainless steel diffusion
barriers were the most practical diffusion barrier canisters for household radon sampling. Stainless steel diffusion barriers provided an integration time constant of approximately ten days,
and results were accurate within 10% when tested in known radon concentrations (George and Weber 1990). When compared to other popular diffusion barrier materials, the stainless steel
diffusion barriers used in George and Weber's (1990) study did not reduce water uptake by the GAC contained in the stainless steel diffusion barrier canisters any more than the other diffusion barrier materials. The major advantages in using stainless steel diffusion barriers are an extended integration time period and the durability of the stainless steel frits. The other barrier materials tested were usually delicate and required replacement after every testing series because of handling
(George and Weber 1990).
Recent adsorption canister research by Thomas (1991) at UNC supported the study that diffusion barriers extend the
integration time constant of diffusion barrier canisters.
Consistent with George and Weber (1990), Thomas (1991) concluded that the stainless steel diffusion barrier canisters had a longer integration time constant than the other diffusion barrier
canisters tested, but the stainless steel barriers were difficult to assemble and were more expensive than other types of diffusion barrier materials (Thomas 1991). Of the diffusion barrier
materials studied, Thomas concluded that the Whatman #1 diffusion
barrier material was the best material for use in short term
indoor radon screening measurements when sensitivity,
maintenance, assembly and cost were considered (Thomas 1991)
MATERIALS
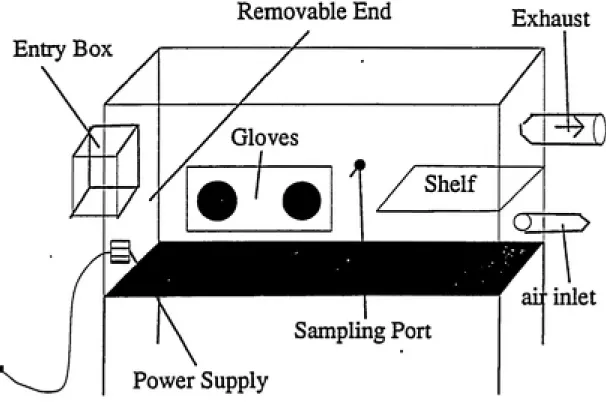
RADON CHAMBER
The Radiological Hygiene Laboratory contains a radon
chamber, shown in Figure 3, that allows the establishment of a constant and isolated radon environment for charcoal canister
experiments and equipment calibration. The radon chamber has
dimensions of 48 x 24 x 62 inches which encompasses a 1000 liter volume. The chamber is constructed of lucite and virtually
eliminates uncontrolled leakage of gases in an out of the
chamber.
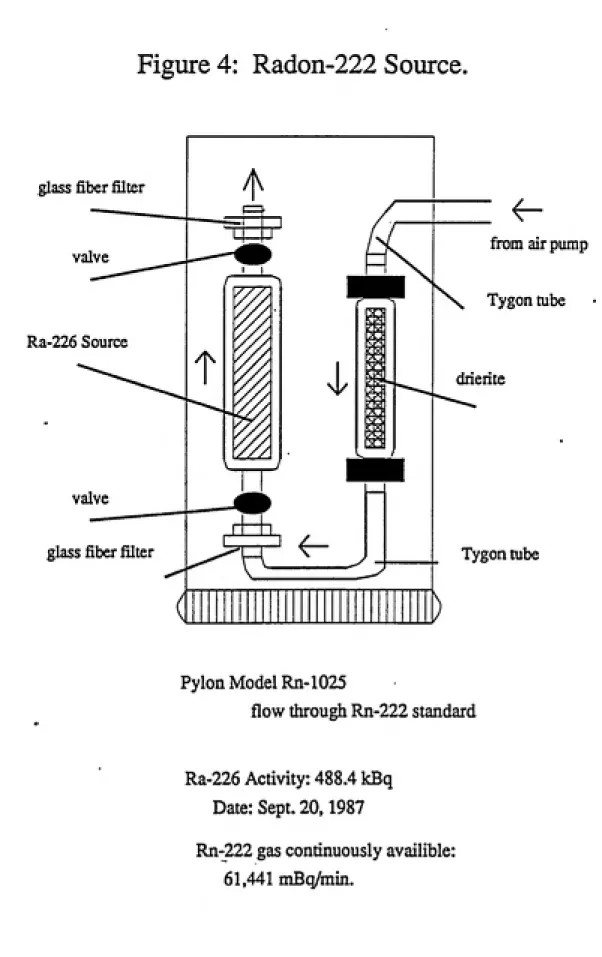
A radon source, manufactured by the Pylon Electronic Development Company, produced radon by forcing air with an
aquarium pump, across a radium source and is shown in Figure 4. A small fan inside the chamber circulated the air in order to
create a homogeneous 222Rn concentration.
The radon concentration inside the chamber was controlled three ways. First, a "tee" joint was added to the top of the source. One side of the "tee" was clamped almost completely shut in order to limit the amount of radon entering the exposure
chamber. Second, a tube was run from the other side of the "tee" to the exhaust which vented the excess radon from the source
directly to the exhaust hood. Finally, the air flow into the chamber was regulated to 40-45 cubic feet per minute. Using
these three equipment adjustments, the radon concentration in the chamber was regulated between 40 and 50 pCi/1.
One end of the radon chamber could be removed and replaced
Figure 3: Radon-222 Exposure Chamber.
Removable End Exhaust
Entry Box
Gloves
Sampling Port
Power Supply
ai]- inlet
Figure 4: Radon-222 Source.
glass fiber filter
valve
Ra-226 Source
valve
glass fiber filter
from air pump
Tygon tube
drierite
Tygon tube
Pylon Model Rn-1025
flow through Rn-222 standard
Ra-226 Activity: 488.4 kBq Date: Sept. 20,1987
Rn-222 gas continuously availible: 61,441 mBq/min.
^pr^P^s^^^ipJP^j'
entry-exit hatch had been built into that same panel which
allowed for the insertion of small equipment and charcoal
canisters without removing the entire panel. Sampling ports were located on the side panel which allowed for grab sampling with alpha scintillation cells. Heavy rubber gloves built into the side of the chamber allowed for equipment manipulation and canister loading and unloading. Inside the chamber, the
temperature and humidity were measured with a thermometer and hygrometer. The temperature and humidity of the chamber
atmosphere remained constant at 25 C and 10 mm Hg, respectively.
ALPHA SCINTILLATION CELLS
Alpha scintillation cells were used to take "grab samples" in order to determine the radon concentration in the radon
chamber. The Randam Electronics Model ASC-125 alpha
scintillation cell shown in Figure 6, was used to determine the radon concentration in the chamber and to determine the Pylon
monitor efficiency.
The ASC-125 alpha scintillation cell has a 0.125 1 volume and has an inside coating of ZnS(Ag), which scintillates with alpha particle interactions. Samples are drawn into the
evacuated cell through the stopcock and nozzle on one end of the cell. The transparent window at the opposite end of the cell permits alpha scintillations to pass through it to a
photomultiplier tube, which is part of the alpha scintillation
Rgure 6: AJpha Scintillation Cell
(Thomas 19911
Stopcock
Quartz Window
Air Inlet
ALPHA SCINTILLATION CELL COUNTING SYSTEM
The alpha scintillation cell counting equipment consists of a light proof black box, photomultiplier tube, power supply,
preamplifier, and timer/counter (Figure 7). The photomultiplier
tube was housed inside the black box in order to keep any external background (outside light) from interacting with the photomultiplier tube. The alpha scintillation counting system was checked and calibrated with a known alpha source before each alpha cell was analyzed. A list of the equipment, manufacturer and settings, as well as a schematic diagram of the counting
system follows. INSTRUMENT Black Box Photomultiplier Tube Preamplifier Counter/Timer Counting Times scaler 7 Power Supply Voltage Amplifier coarse gain fine gain BLR input mode
unipolar output range shaping time constant
differentiate
integrate signal input
signal output
=1 - 60 minutes =In pos =1000 V MANUFACTURER UNC-CH Canberra Industries Model 1405
Tennelec TC 545A
Tennelec TC 910
Ortec Model 450
= 50
= 1 :OUt
=negative/differential
=10 V negative = 2
:OUt
=differential
=unipolar
Rgure 6: Alpha Scintillation Cell Counting System
(ThomMlSSI)
"Block Bo»^'
Power Supply
J"
PH-tube
|--J
J
Counter/Timer
PYLON AB-5 MONITOR
A Pylon AB-5 Portable Radiation Monitor was placed inside the radon chamber to continuously monitor the radon concentration while the canister experiments were run. The Pylon monitor has a built in photomultiplier tube and was used with a PRD-1 Passive
Radon Detector. The PRD-1 detector contains an inner coating of zinc sulfide scintillating material. By programming the internal microprocessor, the Pylon monitor is capable of counting for
specific time intervals as well as storing the collected data and allowing it to be recalled. A diagram of the Pylon monitor is
shown in Figure 5.
CHARCOAL CANISTERS
Two different sized charcoal canisters were used in each of
the experiments. The first canister was 4"in diameter and 1 1/8" deep. Each of these canisters contained 70 grams of granular
activated charcoal (GAC) in the adsorption and desorption
experiments and 68 grams of GAC in the desiccant adsorption and desorption experiments (to allow room for the 2 gram desiccant
packs.) The GAC was held in place by a circular brass screen and
a rubber retaining ring. Each canister was sealed airtight with a strip of electrical tape.
Diffusion barrier canisters were constructed from smaller
canisters available in the Radiological Hygiene laboratory.
These canisters were 3 1/8" in diameter and 15/16" deep. Each
diffusion barrier canister contained either 50 grams of GAC or 48
grams of GAC depending on the use of 2 gram desiccant packs in
Rgure 7: P^on AB-6 Portable Radiation Monitor
(Thomas 1991)
PRD-IAMmCoI
Power
Hr^Min/Sec
II (U> II
QuatiA^onL^ate
Statut 1 Pump
part of the experimentation. Two different size holes of 1" and
1 1/2" inches were punched in the canister's lids by the UNC
School of Public Health's Machine Shop. The diffusion barriers
were attached to the underside of the canister lids with rubber
cement or silicone caulking. All canisters were sealed airtight
with a combination of duct tape and aluminum foil across the
diffusion barrier opening, and electrical tape around the
canister seam until ready for use.
CHARCOAL CANISTER COUNTING SYSTEM
The charcoal canister counting system consisted of a low
background chamber, a Nal crystal attached to a photomultiplier
tube, a high voltage power supply, a preamplifier, amplifier, and
multichannel analyzer. The low background chamber contained the
Nal crystal, photomultiplier tube, and preamplifier, and shielded
the crystal from outside sources of background radiation.
Equipment settings and manufacturers, as well as a schematic
diagram (Figure 11) of the canister counting system follows.
INSTRUMENT
Background chamber
Sodium Iodide Crystal Photomultlplier Tube
Preamplifier
input capacitance = 500 pf
MANUFACTURER
Instrument and Development Products Company Amplifier fine gain coarse gain shaping time BLR delay input out
Ortec Model 113
Ortec Model 571
= 0.7 - 1.2 = 100
= 6 microsec
= auto = out
= negative
= uni
High Voltage Power Supply voltage = 1000 V Multichannel Analyzer
Canberra Model 3102
Tractor Northern Model
TN-1705
gain = 0
LLD = 30
ULD = 1200
amp
= out
offset = 0
conversion gain = 1024
mode = PHA
preset = live
time base = 100 X 6
= 100 X 3
Figure 8: Charcoal Canister Counting System
(Thomas 1991)
Multichannel Analyzer
nnm
Power
Nal Crystal
PM-Tube
Preanplifer Ampiirier
PROCEDURES
ALPHA SCINTILLATION CELL SAMPLING AND ALPHA SCINTILLATION CELL
COUNTING EQUIPMENT-PROCEDURES FOR USE
Alpha scintillation cells and counting equipment were used to determine the radon concentration in the radon chamber and to calibrate the Pylon monitors. Procedures for alpha scintillation cell sampling and counting follow.
1. Turn the MIDIBIN power supply switch to "on" and allow the
equipment to warm up for at least 30 minutes.
2. Press the "reset" button on the counter/timer until the
digital display reads "0."
3. Set the "timer" on the counter/timer for a 10 minute counting period.
4. Turn the voltage on the power supply to 1000 volts.
5. Set the amplifier "coarse gain" on 50 and the "fine gain" on 1.
6. Place the 0.125 1 standard alpha scintillation cell on the
photomultiplier tube inside the black box.
7. Press "count," and the count should begin increasing. The count displayed should be approximately 22,000 at the end of 5 minutes. If not, readjust the fine gain and repeat the ten minute counts until the count is approximately 22,000.
8. Turn the "timer" on the counter/timer to 30 minutes.
9. Take an alpha scintillation cell to the helium source. Turn
the helium source on, and place the helium tube on the nozzle of the alpha cell. Open the stopcock and allow the helium to flow
10. Take the alpha cell to the vacuum. Pull a vacuum on the alpha cell by placing the vacuum hose on the alpha cell nozzle
and opening the stopcock. Allow the vacuum to pull for 30
seconds and close the stopcock.
11. Repeat steps #9 and #10 at least three times.
12. Place the alpha cell on the photomultiplier tube inside the black box.
13. Press the "count" button on the counter/timer. This count
will give you the background counts for the alpha cell.
14. Take the alpha cell to the radon chamber. Place the nozzle
of the alpha scintillation cell inside the tube on the radon chamber sampling port.
15. Open the port valve, and then open the alpha cell stopcock and wait for 30 seconds before closing the stopcock and valve. 16. Pull a vacuum on the alpha cell again as in step #10.
17. Repeat steps #14 and #15 at least three times.
18. Allow the alpha scintillation cells to sit at least four hours before counting on the alpha scintillation cell counting
equipment.
19. Place the alpha scintillation cell on the photomultiplier
tube inside the black box.
20. Press the "count" button on the counter/timer and the counts
should begin increasing.
CALIBRATION OF PYLON AB-5 RADON MONITORS
TWO Pylon AB-5 portable radiation monitors, with the PRD-1 passive diffusion, alpha scintillation cell attachments, were used to measure the radon concentration in the radon testing chamber during the adsorption and desorption canister
experiments. Before testing began, the efficiency of the Pylon
monitors were measured with an alpha emitting standard that
produces alpha disintegrations at a known rate. Then the Pylon monitors were calibrated using alpha scintillation cells with
known efficiencies. Previous Pylon calibrations yielded 1.26 cpm/pci/1 and 1.13 cpm/pCi/1 for Pylons one and two,
respectively.
PROGRAMMING THE PYLON AB-5 MONITORS
Because the Pylon AB-5 monitor is capable of making a variety of radiation measurements, the monitor must be
appropriately programmed to ensure correct radiation measurements integrated over specific increments of time. A sample of Pylon
programming steps follows and should be used for future
reference:
1. Plug the Pylon power cord into an electrical outlet and turn
the "on/off" knob to "on."
2. Turn the "quasi/cont./rate" knob to "cont." and the
"hr/min/sec" knob to "hr."
"Prog./step" button again, to start the pylon monitor's one hour
counting intervals.
TEST OF PYLON 1 AND 2 EFFICIENCIES WITH STANDARD RADIUM/RADON
SOURCE
Each of the Pylon monitors was tested periodically in order to ensure that radiation measurements taken with the monitors
were within certain degrees of error. A protocol for testing the
efficiencies of the Pylon monitors follows:
1. Make sure Pylon is unplugged and turned off so that no digits
or lights are displayed on the panel.
2. Remove the PRD-1 passive radon detector from the face of the Pylon by unscrewing the detector counterclockwise.
3. Attach the sample holster to the face of the Pylon by
screwing the holster clockwise in the threads on the panel until
the holster fits securely.
4. Insert the alpha scintillation cell containing a radium standard in the holster and screw the top on the holster
securely.
5. Plug the Pylon monitor into the electrical outlet and turn
the "On/Off" knob to "On,"
and turn the "hr/min/sec" knob to "min."
6. Press the "prog,/step" button once. Press the "pump" button
until the first of the two digits reads "1." Press the
"start/stop" button until the second of the two digits reads "0."
The program is set for ten-minitue counting intervals.
7. Press the "start/stop" button once and the count should
8. After elapsed time, press "recall" button, and the display should yield "In 01". Press "prog./step" button twice, and the first of the ten minute count results should appear on display. Pressing the "prog./step" button each time thereafter, will
result in the display of successive ten minute count results.
9. Average the results and divide the average count by ten to
obtain counts per minute.
10. Turn the Pylon off and unplug it. Remove the standard from the holster, and seal the holster with the supplied cap.
11. Plug in the Pylon and turn on. Reset the Pylon for ten minute counting intervals and press "start/stop" button. This will measure the background counts.
12. Average the background counts and divide by ten. Subtract this average from the previously obtained count rate.
13. Divide this value by the number of disintegrations per
minute etched on the side of the radium standard. This will give you the efficiency of the pylon.
PYLON CALIBRATION FACTORS USING ALPHA CELL COUNT RATES
Both Pylon AB-5 monitors were calibrated using alpha scintillation cells before the canister exposure experiments began. To calibrate the Pylon monitors the concentration in the radon chamber was monitored with the Pylon monitors during
sampling with the alpha scintillation cells. The parallel
sampling allowed direct comparison between the Pylon monitors and
the alpha cells.
The radon concentration ( pCi/1 ) measured with each alpha cell was determined by dividing the net count rate (cpm) of each alpha cell by the cell's volume (0.125 1) a calibration factor
(4.95 cpm/pCi )(LaVake 1989) and the decay correction factor
{ e'-^t ) .
Eight, one minute counts were made with each Pylon in the
radon chamber. The Pylon count rates were then averaged to give
an average count rate for each of the Pylon monitors. The average Pylon count rates were then divided by the alpha scintillation cell concentrations to produce the calibration
factors (cpm/pCi/1) for each of the Pylon monitors. These values
were then compared to previous calibration factor data.
CANISTER PERFORMANCE TESTING-ADSORPTION
Fourteen different types of diffusion barrier canisters,
along with an open face canister, were chosen to study how 222Rn adsorption varies with time according to the diffusion barrier material and the size of the canister's "opening." Two sizes of canisters were used: The four inch open face canister contained 70 grams of granular activated charcoal as its adsorbent, and the
3 1/2 inch diffusion barrier canisters contained 50 grams of
granular activated charcoal as the adsorbent. The fifteen types of canisters, designated by the type of diffusion barrier, were
as follows:
PORE SIZE
CANISTER OPENING
Open face
Stainless steel 1
Fiberglass Fiberglass Fiberglass Fiberglass Whatman Whatman Whatman Whatman Whatman Whatman Whatman Whatman 1 1 1/2 1 1 1/2 1 1 1/2 1 1 1/2 1 1 1/2 1 1 1/2 0, 0, 1, 1, 2, 2, 6 6 11 11 20-25 20-25 micron micron
At time zero, seven canisters of each type were placed in the radon chamber at 25 C, 10% relative humidity, and a radon concentration of approximately 45 pCi/1. Each day, for seven days, one canister of each type was removed from the chamber and sealed immediately. After allowing the radon progeny to come into equilibrium with the adsorbed radon (at least four hours), each of the canisters was analyzed using the charcoal canister
counting system.
Ten minute background counts were taken on 4 inch and 3 1/2 inch unexposed canisters each day before exposed canisters were counted. These background counts were subtracted from the gross counts obtained from the exposed canisters to give the total net
counts for each of the canisters.
Radon chamber concentrations were continuously measured with the Pylon AB-5 monitor while the canisters were being exposed. The radon concentration in the chamber was integrated over six hour periods and these data were used to obtain the average radon concentration over the exposure period for each set of canisters removed each day. The average concentration measured by the
Pylon was used in calculations to determine the amount of
adsorbed radon on the granular activated charcoal in the canisters per pCi/1 of radon in the chamber.
After counting each of the canisters, the count rate was corrected for radon decay from the time the canisters were
removed from the chamber to the midpoint time of counting. These decay corrected count rates were then used along with the average
radon concentrations in the chamber to determine the amount of radon adsorbed on the granular activated charcoal in the
canisters per pCi/1 of radon in the chamber. After the adsorbed radon per gram of charcoal per pCi/1 of radon in the chamber values were calculated in units of cpm/g/pci/1 , plots of adsorption vs. exposure time were generated for each of the
different types of canisters exposed.
The adsorption plots generated for each canister exposed in
the chamber were used to determine which canister was the most efficient in adsorbing radon over seven days. Sample
calculations used to generate charcoal canister adsorption data
follow.
CANISTER/DAY PREWEIGHT POSTWEIGHT WEIGHT GAIN
CHTy^NEL COUNT RATE 110-201 280-335 TOTAL COUNT RATE
BACKGROUND COUNT RATE NET COUNT RATE
DECAY CORRECTION FACTOR e-'^t
DECAY CORRECTED COUNT RATE RADON CONCENTRATION
ADSORBED RADON
OPEN FACE/1
166 43 g 167 61
1 18 g
1698 4 cpm
+ 504 6
2203 0
- 131 _§.
2071 5 cpm 0 959
2160 1 cpm 42 3 pCi/1
0 730 cpm/g/pCi/1
CANISTER PERFORMANCE TESTING-DESORPTION
Charcoal canister desorption experiments involved placing each of fifteen different types of canisters in the radon chamber
at approximately 45 pCi/1 and 10% relative humidity for seven
days. The fifteen different canister types tested were the same canister types used in the adsorption experiment. All of the canisters were removed from the chamber at the end of seven days. Immediately, one canister of each t3,^e was sealed, and marked as time zero. The remaining canisters were placed in a steel
cabinet and allowed to desorb for specific intervals. The doors of the cabinet were then closed in order to eliminate drafts and circulation that would affect canister desorption rates.
The first set of canisters marked "time zero" was allowed to
sit for at least four hours in order for the radon progeny to
reach equilibrium. Ten minute background counts were taken on blank charcoal canisters before the first set of canisters were
counted on the charcoal canister counting system. The ten minute background counts were subtracted from the gross counts obtained by counting each of the canisters in the first set.
Each day for six days, one canister of each type was removed from the cabinet, sealed, allowed to sit for at least four hours in order for the radon progeny to come into equilibrium with the
radon, and counted on the charcoal canister counting system after
background counts were made.
The time each canister was sealed was recorded and the decay time was determined from the time the canister was removed from the radon chamber to the midpoint of the canister's counting
period. Data were recorded as the adsorbed radon remaining upon
removal from the radon chamber (George and Weber 1990.)
A plot of the desorption rate over seven days was generated for each canister type. A calculation example of the charcoal
canister desorption data follows this section.
CANISTER/DAY
CHANNEL COUNT RATE 110-201 280-335
TOTAL COUNT RATE
BACKGROUND COUNT RATE
NET COUNT RATE
DECAY CORRECTION FACTOR e-'"t
DECAY CORRECTED COUNT RATE RADON CONCENTRATION
ADSORBED RADON REMAINING
OPEN FACE/4 575.3 cpm
+ 175.6 750.9 - 111.9
639.0
0.519
3517.8 cpm 45.5 pCi/1
1.103 cpm/g/pCl/1
CANISTER WITH DESICCANT PERFORMANCE TESTING-ADSORPTION
In a separate experiment, one silica gel desiccant pack was added to each charcoal canister before the canisters were exposed
in order to determine the effects of the desiccant on the overall performance of the charcoal canisters. Theoretically, the
desiccant would remove some of the water vapor from the
atmosphere before it could adsorb on the granular activated charcoal inside the canister. In this experiment, five canister types were evaluated. Each canister contained either 68 grams or 48 grams of granular activated charcoal (depending on the canister size) and a 2 ounce desiccant pack. In addition, one
open face canister without a desiccant pack was used for comparison. The canister types used were as follows:
CANISTER
Open face 4 «
Open face + desiccant 4
No barrier + desiccant 3.5 1.5" opening
Stainless steel + desiccant 3.5 1.5 1.5 Glass + desiccant 3.5 1.5
11 Whatman + desiccant 3.5" 1.5" opening
Before exposure, each desiccant pack was weighed and
assigned to a specific canister. Each canister was then sealed and weighed. Next, all canisters were placed in the radon
chamber that contained a radon concentration of about 45 pCi/1. Each day for seven days, one canister of each type was removed from the chamber. Immediately upon removal from the chamber, the desiccant pack was removed from the canister, weighed and placed back in the canister. The canisters were then weighed and both
weights recorded.
Each canister was allowed to sit at least four hours after
sealing in order for the radon progeny to come into equilibrium
with the adsorbed radon. The canisters were then counted on the
radon canister counting system for ten minutes. The canister data
were recorded and the net counts obtained were corrected for
decay. The amount of radon adsorbed in each canister
(cpm/g/pCi/1) was calculated and a plot of the adsorbed radon versus days of exposure was generated. A sample calculation follows:
CANISTER/DAY OPEN FACE+ DESICCANT/1
DESICCANT PREWEIGHT 2.17 g DESICCANT POSTWEIGHT 2.35 DESICCANT WEIGHT GAIN 0.18 g CANISTER PREWEIGHT 158.98 g CANISTER POSTWEIGHT 169.67 CANISTER WEIGHT GAIN 0.69 g CHANNEL COUNT RATE 110-201 1229.5 cpm
280-335 363.5
TOTAL COUNT RATE 1593.0 cpm
BACKGROUND COUNT RATE - 99.4
NET COUNT RATE 1493.6 cpm
DECAY CORRECTION FACTOR e-'^t 0.769
DECAY CORRECT COUNT RATE 1942.3 cpm
RADON CONCENTRATION 43.6 pCi/1 ADSORBED RADON cpm/g/pCi/1 0.655
CANISTER WITH DESICCANT PERFORMANCE TESTING-DESORPTION
In a separate experiment, one silica gel desiccant pack was added to each charcoal canister before the canisters were exposed
seven days in order to determine the effects of the desiccant on
the overall desorption rates of the charcoal canisters. The canister types tested in this experiment were the same types of canisters tested in the canister with desiccant, adsorption
experiment.
Before exposure, each desiccant pack was weighed and
assigned to a specific canister. Each canister was then sealed
and weighed. All canisters were placed in the radon chamber for
seven days at an average radon concentration of 44.5 pCi/1, and 10% relative humidity. At the end of seven days, all canisters
were removed and one canister of each type was sealed
immediately, marked "time zero" and allowed to sit for at least four hours before counting on the charcoal canister counting equipment. The remaining canisters were placed in a steel
cabinet and allowed to desorb at specific intervals. The doors of the cabinet were kept closed in order to eliminate drafts and circulation that would affect canister desorption rates.
Each day for six days, one canister of each type was removed from the cabinet, sealed, and allowed to sit for at least four
hours before being counted on the charcoal canister counting equipment. Before each canister set was counted, a ten minute background count was taken on an unexposed charcoal canister and the result was subtracted later from the gross counts obtained from counting each of the canisters in each set. The decay time was determined from the time each canister was removed from the chamber to the midpoint of the canister's counting period. The data were recorded as the amount of adsorbed radon remaining upon removal from the radon chamber (George and Weber 1990.) A sample calculation for the determination of the amount of radon
remaining in a charcoal canister follows.
CANISTER/DAY OPEN FACE + DESICCANT/3
CHANNEL COUNT RATE 110-201 847.1 cpm 280-335 + 243.7
TOTAL COUNT RATE 1090.8 BACKGROUND COUNT RATE - 109.2 NET COUNT RATE 981.6
DECAY CORRECTION FACTOR e-"t 0.646
DECAY CORRECTED COUNT RATE 1519.5 cpm
RADON CONCENTRATION 44.5 pCi/1
ADSORBED RADON REMAINING 0.502 cpm/g/pCi/1
CANISTER RECYCLING
The granular activated charcoal used in the canisters was reactivated and stripped of radon and moisture by placing the
charcoal in the canisters in a 200 c oven for at least six hours.
The charcoal was allowed to cool and then placed in airtight
containers (filled to the maximum) until ready for weighing or
use in the laboratory.
Routine diffusion barrier replacement was necessary for the glass filters. This was easily achieved by rubbing the rubber cement from the lid of the canister and replacing the torn barrier with a fresh one.
RESULTS AND DISCUSSION CANISTER ADSORPTION TESTING RESULTS
Adsorption plots of cpm/pCi/1 vs. days of exposure were constructed for the fifteen canister types tested in this
experiment. All canisters were tested at 10% relative humidity and 25 C. Canister exposure began at a radon concentration of 42.3 pCi/1 and ended on day seven at a concentration of 49.4
pCi/1. The radon concentration in the chamber seemed to increase
over the exposure period because of gradual decreases in the airflow into the chamber. Over the seven day exposure period, the airflow dropped about 5 cfm. Also, the granular activated
charcoal in the canisters adsorbed more of the available radon in
the chamber at the beginning of the exposure period than at the
end of the exposure period because of charcoal saturation with
radon and water vapor. Integrated radon concentrations were measured with the Pylon monitors from the beginning of the exposure period to the removal of each canister group. The
adsorbed radon values for each exposure group are printed in the Appendices (II-V). Because of computer limitations and for
simplicity, three separate plots were constructed for the fifteen canister types. Figure 9 contains results for canisters with 1" and 1.5" openings and stainless steel diffusion barriers. Figure 10 contains results for 1" opening diffusion barrier canisters, and Figure 11 contains results for 1.5" diffusion barrier
canisters. Each plot contains an identical open face canister adsorption curve for comparison. A chart of the canister types
used follows:
FIGURE 9: ADSORPTION CURVES 10% RH 26 C
1.400T
I
1.200-
1.000-- 0.800
0.600-0.400
0.200-DAYS O.OOO
T 1.400
-1.200
ͣ
1.000
0.800
-O
Q.
E
a
- 0.600 "
ͣ
-0.400
ͣ
-0.200
0.000
FIGURE 10: ADSORPTION CURVES: 1" CC 10% RH 26 C
I
1.400 T
1.200-1.000
:r 0.800
" 0.600
0.400
0.200
0.000'
-•- 0.3 glass 1 •*- 6 Whatman 1
DAYS
Hi- 1.6 glass 1
-O- 11 Whatman 1
T 1.400
••1.200
ͣ
•1.000
0.800 c; ()
a. o>
g
Q.
0.600 "
• -0.400
ͣ
0.200
0.000
2.6 Whatman 1
FIGURE 11: ADSORPTION CURVES: 1.6" C 10% RH 26 C
1.400 T
1.200 ͣͣ
1.000-ͣ
1.400
!5'
^ ::^ 0.800
w o
a. 1 ^-~ ai
s E
a. o
0.600
0.400 ͣͣ
0.200-0.000
ͣ
1.200
ͣ
1.000
ͣ
0.800 ^
ͣͣ0.600 "
• ^0.400
ͣ
0.200
-•- 0.3 glass 1.6
-*ͣ 11 Whatman 1.5
3 4 DAYS
•1.6 glass 1.6
-©- open face
0.000
CANISTER PORE SIZE
Open face
Stainless s teel
stainless £ teel
Fiberglass 0.3 micron
Fiberglass 0.3 Fiberglass 1.5 Fiberglass 1.5 Whatman 2.5 Whatman 2.5 Whatman 6 Whatman 6 Whatman 11 Whatman 11 Whatman 20-25 Whatman 20-25 OPENING 1 1.5 1 1.5 1 1.5 1 1.5 1 1.5 1 1.5 1 1.5
Figure 9 shows that the 1.5" opening on the stainless steel canisters allows more radon to be adsorbed on the granular
activated charcoal (GAG) than does the 1 inch opening. The open
face canister allows more radon to be adsorbed on the GAG than
either stainless steel diffusion barrier canisters.
The adsorption curves for 1 inch opening diffusion barrier canisters show that the fiberglass diffusion barrier canisters consistently adsorbed more radon than any of the Whatman paper diffusion barrier canisters. On the second day of exposure, the
11 micron Whatman paper canister (1 inch) showed a slight decline
in its adsorption value. The weight gain of this particular canister was similar to the other canisters removed that day.
The occurrence of this low value, therefore, cannot be explained.
Adsorption curves for 1.5 inch diameter opening diffusion barrier canisters (Figure 11) also show that the fiberglass
diffusion barrier canisters consistently adsorbed more radon than
the Whatman paper diffusion barrier canisters. The most striking
result of this plot occurred on the first day of exposure with
the 0.3 micron fiberglass diffusion barrier canister. This spike
in radon adsorption occurred because the diffusion barrier became
separated from the top of the canister, which allowed the radon
to pass directly to the GAC without diffusing through the
barrier. The weight gain of this canister was double the average
of the other diffusion barrier canisters as a result of the
separation.
The plot of the open face canister data shows an adsorption spike at day 5. This occurrence cannot be explained because there is no barrier to separate in this canister, and the other canisters did not show a similar spike in the plot of their data. The open face canister used for reference on the fifth day of
adsorption showed no abnormal weight gain.
The adsorption plots in Figures 10 and 11 show that the
canisters with the 1.5 inch diameter openings adsorbed more radon than the canisters with the 1 inch diameter openings. The open
face canister data consistently showed more radon adsorption than any of the diffusion barrier canisters. All canisters tested
show rapidly increasing adsorption rates followed by gradual
plateaus representing GAC saturation. Between days six and seven of exposure, most canisters showed a slight drop in radon
adsorption.
CANISTER DESORPTION TESTING RESULTS
Desorption plots were created for the fifteen canister types tested in this portion of the experiment. All canisters were tested at 10% relative humidity and 25 C. The canisters were exposed over a seven day period to an average radon concentration of 45.6 pCi/1. Because of computer limitations, and simplicity, the three plots are separated into three categories: (1)
stainless steel 1" and 1.5" diameter opening diffusion barrier
desorption curves; (2) 1" diameter opening diffusion barrier canisters; and (3) 1.5" diameter opening diffusion barrier canisters. Each plot contains an open face canister desorption
curve for comparison.
The stainless steel 1" and 1.5" canister desorption curves (Figure 12) show gradual radon desorption compared to the curve for the open face canister. The slope of the 1.5" stainless
steel canister exceeded the slope of the 1" stainless steel
canister. The "time zero" adsorbed radon remaining value for the
1.5" stainless steel canister, when compared with the 1" canister, showed that the 1.5" canister allowed more radon adsorption than the 1" canister. This is consistent with the
adsorption data previously discussed.
The desorption plots for the 1" diffusion barrier canisters
(Figure 13) illustrate near-linear slopes for each of the canister types. A small spike in the 0.3 micron fiberglass diffusion barrier data for day 2 is the result of a separated
diffusion barrier in that canister. During exposure, the radon would have passed around the barrier directly to the GAC instead
FIGURE 12: DESORPTION CURVES; OF & SS 10*/. RH 25 C
1.200 T
(D I
V5
1.000
0.800
n 0.600
0.400
0.200
T 1.200
0.000
OPEN FACE
3
DAYS
STAINLESS STEEL 1"
ͣ
1.000
ͣ
0.800
a.
ͣ
0.600 o)
E
Q. O
ͣ
0.400
ͣ
0.200
0.000
FIGURE 13: DESORPTION CURVES: 1" CC
10% RH 26 C
(D I
1.200 T
1.000 ͣͣ
0.800ͣ•
o
Q.
oi 0.600
E
a o
0.400 ͣ
0.200ͣ•
o.ooo
1 2 3 DAYS
-•- 0.3 glass 1" ͣm- 1.6 GLASS 1"
ͣ
«- 6 WHATMAN 1" ͣ©- open face
1.200
ͣ
1.000
•0.800
o
Q.
• 0.600 oi
E
n. o
0.400
ͣ
-0.200
0.000
-- 2.6 WHATMAN 1"
of diffusing through the barrier as planned, resulting in a
higher adsorbed radon remaining value.
The desorption curves of the 1.5" diffusion barrier
canisters (Figure 14) show a steeper slope than the 1" canister curves. Three noticeable spikes in the curves occur in the 2.5 and 6 micron whatman canisters at days 1 and 5, respectively, and
a trough in the curve for the 0.3 micron fiberglass canister
occurs at day 3. The trough occurring on day three is a result
of the diffusion barrier becoming separated after the canister's
exposure and removal from the chamber. Barrier separation after exposure during desorption would allow faster radon desorption directly to the atmosphere instead of being inhibited by the diffusion barrier. The spikes would occur if the diffusion barriers became separated from the canister tops before the
canisters were exposed.
The open face canister curve showed a rapid decline in
remaining adsorbed radon followed by a more gradual decline. The 1.5" canister curves illustrated lower radon adsorption than open face adsorption at time zero, which is consistent with earlier adsorption data. The adsorbed radon remaining values for 1.5"
canisters exceeded the values for the open face canisters by the end of the first day of desorption. The slope of the open face canister curve is nearly identical to the slope of the 1.5" canisters after the second day of desorption.
The 1" canisters' radon adsorption at time zero is less than
that of the 1.5" canisters, which is consistent with previous adsorption data. The adsorbed radon remaining values for the 1"
FIGURE 14: DESORPTION CURVES: 1.5" 107. RH 25 C
I
a.
1.200 T
1.000 •
C.800ͣͣ
ra 0.600 ͣ •
E
a. o
0.400 ͣ•
0.200 ͣ
0.000
-•- 0.3 glass 1.6"
-*- 6 WHATMAN
3
DAYS
-m- 1.5 GLASS
-G- open face
T 1.200
•1.000
•0.800
0.400
•0.200
0.000 o
o.
• -0.600 ra
E
a. o
-- 2.5 WHATMAN
canisters exceeded the open face canister values by the second day of desorption. The 1" and 1.5" canister curves intersect at the end of the fifth day of desorption at approximately 0.500
cpm/g/pCi/1, which suggests that the radon desorption data for
all diffusion barrier canisters tested become identical near the
end of the fifth day.
CANISTER WITH DESICCANT TESTING RESULTS-ADSORPTION
Adsorption curves (Figure 15) were constructed for six
different canister types including three 1.5" diameter opening diffusion barrier canisters with desiccants, two open face
canister types (one 4" open face canister and one 3.5" canister with 1.5" diameter openings) with desiccants, and one open face canister without a desiccant pack that was used for comparison.
CANISTER OPENING Open face 4" Open face with desiccant 4
3 1/2" with desiccant 1.5
Stainless Steel with desiccant 1.5 1.5 micron Fiberglass with desiccant 1.5 11 micron Whatman with desiccant 1.5"
All canisters were exposed at 10 % relative humidity and 25 C. The integrated radon concentrations during canister exposure
ranged between 43.6 pCi/1 on day one and 47.8 pCi/1 on day seven.
The effects of the desiccant packs are illustrated in the adsorbed radon curves of the 4" and 3 1/2" desiccant canisters.
The desiccant pack seemed to act as a diffusion barrier for the 4" with desiccant canister by hindering the ability of the radon
FIGURE 15: DESSICANT ADSORPTION CURVES 10% RH 26 C
<^
CD i
o
a.
D) 0.6-•
E
o. o
-•- OPEN FACE -»- SS 1.6 + DESS
3 DAYS -ͣ- 4" + dess
-e- 1.6 GLASS 1.6" + DE
t1.2
•ͣ1.0
ͣ
0.8
o
a
ͣ
•0.6 u)
E
Q. O
•ͣ0.4
ͣ
0.2
0.0
-<- 3 1/2" + dess
to adsorb on the GAC as quickly as on the open face canister. At
the fifth day of exposure, the open face and 4" with desiccant
canister curves intersect which suggests that the GAC in the 4"
with desiccant canister does not become saturated with radon as
quickly as the GAC in the open face canister.
The adsorption curves for the 1.5" diameter opening
diffusion barrier canisters with desiccant when compared to the
3 1/2" with desiccant canisters illustrate that the desiccant packing material in the open face canister acts as a diffusion
barrier for the canisters in this series (Figure 15.) Two spikes
occurred in the 1.5" open face canister curves which resulted
from inefficient sealing of the desiccant packs to the lids of those canisters. If those spikes are overlooked, the 1.5" open
face plus desiccant curve follows the slope of the other 1.5" diffusion barrier plus desiccant canisters.
As seen in earlier adsorption experiments, the 1.5 micron
fiberglass diffusion barrier canisters yield higher adsorbed
radon values than the other 1.5" diffusion barrier canister types tested. All canister types tested in this experiment show rapid
radon adsorption initially, followed by slow but steadily
increasing radon adsorption. The 4" open face canisters adsorbed
more radon than the 3.5" canisters which supports earlier experimental results.
CANISTER WITH DESICCANT TESTING RESULTS-DESORPTION
Desorption curves were created for six canister types tested (Figure 16.) Three 1.5" diameter opening diffusion barrier plus
FIGURE 16: DESICCANT DESORPTION CURVES 10% RH 26 C
V
o
1 a.
0\
D)
NO E
Q. O
1.2001
1.000 ͣͣ
0.800•
ra 0.60O
0.400 •ͣ
0.200
0.000
-•- open face
-*- stainless steel + d
3
DAYS -»ͣ 4" with dess
•©- 1.6 glass + dess
•• 3 1/2" + dess
-H- 11 Whatman + dess
T 1.200
•1.000
ͣ
0.800
o
Ol
ͣ
-0.600 rii
E
a. o
ͣ
-0.400
0.200
desiccant canisters were tested and compared to three open face
canister types.
The desiccant packs contained in the open face plus
desiccant canisters did not seem to have a major effect on the
initial radon adsorption at time zero, or desorption of the radon
from the GAC. The open face canister data were very similar to
the data obtained with the 4" canister with desiccant. The open
face canister data were equal to or exceeded the 4" with
desiccant canister data except on two occasions.
The 3 1/2" with desiccant canister curve exceeded all other
canister adsorption curves at time zero, day one, three, four
five and six. This effect may be a result of failed seals in the
canisters used in this portion of the experiment. A failed seal
would allow the radon to freely adsorb on the GAC without
diffusing through the packing material. The curve for the 3 1/2"
with desiccant canisters seems to approach the same desorption
rates as the other 1.5" canisters at the fifth day of desorption.
The 1.5" opening diffusion barrier with desiccant canisters
seem to desorb at similar rates. The slopes of the desorption
curves for each of the canisters appear to be identical with the
exception of one stainless steel canister desorption value.
The 1.5 micron fiberglass diffusion barrier and the 11 micron
Whatman paper diffusion barrier curves were nearly identical
except at time zero, which supports earlier desorption and
adsorption data. The 1.5" opening canisters tested in this
series seem to become identical to each other between the third
and fourth days of desorption. The initial slope of the open
face canister curve rapidly declines and later falls below, yet
CONCLUSIONS AND RECOMMENDATIONS
The performance characteristics of the different types of
diffusion barrier canisters will be discussed in four sections: 1. Adsorption. 2. Desorption. 3. Adsorption with Desiccant. and 4. Desorption with desiccant.
Diffusion barrier canister adsorption curves (Figures 9-11) show that using 1 1/2" diameter canister openings allows more radon to adsorb on the GAG than with 1" diameter openings.
Therefore, using the 1 1/2" opening diffusion barrier canisters might appear to be better than using the 1" canisters because more radon would be adsorbed on the GAC from the testing site. The fiberglass filter, diffusion barrier canisters consistently had higher count rates per gram of charcoal than the porous
stainless steel or Whatman paper diffusion barrier canisters when exposed to the same radon concentrations. The adsorption of all diffusion barrier canisters, however, was well below the
adsorption of the open face canister.
Diffusion barrier desorption curves (Figures 12-14) show
that desorption occurs faster in 1 1/2" diffusion barrier
canisters than in 1" diffusion barrier canisters, even though the diffusion for each set of diffusion barrier canisters became
nearly identical after five days of desorption. The stainless steel diffusion barrier canisters' desorption is nearly identical to the other diffusion barrier canisters' desorption. The open face canister begins with more radon adsorbed than all the
diffusion barrier canisters, desorbs rapidly, and falls below the
The desiccant wrapper may be used as an effective diffusion barrier when properly sealed across the opening of the lid of the
canister, as shown by the curve in Figure 15. When the desiccant
pack was improperly sealed to the lid of the canister, the 3 1/2" canister with desiccant mimics the open face canister adsorption.
The 4" canister with desiccant did not adsorb as much radon as
the open face canister, but did exceed the radon adsorption of
the diffusion barrier canisters with desiccant that were tested
in this portion of the experiment. The radon adsorption of the
1 1/2" fiberglass diffusion barrier canister with desiccant exceeded the radon adsorption of the stainless steel canister with desiccant and the 11 micron whatman filter canister with
desiccant.
The desorption curves in Figure 16 show that the desiccant
packs may be used as an effective diffusion barrier if properly sealed to the opening of the lid on the canisters. The slope of the 3 1/2" with desiccant canister curve closely resembles the other diffusion barrier curves in the figure, and did not
resemble the slope of the open face canister curve. The 4" with
desiccant canister curve resembles the open face canister curve,
and both undergo rapid desorption during the first three days of
removal from the chamber.
Placing a desiccant in the diffusion barrier canister had some effect on the overall water adsorption experienced by the charcoal in the canister. The desiccant typically adsorbed