Liquid Low Level Radioactive Wastes. (Under the direction of DR.
PHILIP E. HAMRICK AND DR. STEVEN L. SIMON)ABSTRACT
Effluents and residual ash were monitored in order to determine the fate of 35s labelled liquid waste during high temperature incineration. Effluents were monitored using a modified EPA
approved Method 5 isokinetic sampling probe with 3% H2O2 as the
trapping solution. The radioactivity content in the gaseous effluents and residual ash was counted using a liquid scintillation counter
calibrated for 35s. Eleven trial burns of liquid waste with activities
ranging from 199 to 5659 iiCi^ were conducted. An aqueous solution
of 35s labelled Methionine was the source of activity in eight of the
trials and an aqueous solution of 35s labeled sulphate was the source
in the remaining three trials. Percent of the total activity incinerated contained in the effluents and ash was determined.
• ^Conventional Units are used in certain areas of the text in order to be consistent with
licences and finninperinn <;ne>r.ificatinn<5
TABLE OF CONTENTS
Page
TABLE OF CONTENTS ii
LIST OF FIGURES iv
LIST OF TABLES v I. INTRODUCTION 1
A. Purpose 1
B. Literature Review 3 1. Institutional radioactive waste incineration 3
2. Governmental regulation 6
II. MATERIALS AND METHODS 8A. Method of Investigation 8 B. Incinerator Characteristics 8 C. Definition of Isokinetic Sampling 12
D. Sampling System 12
E Characterization of Conditions 17During Incineration
F Radioactivity Sampling 21
1. Sample Preparation 21
2. Effluent Sampling 21
3. Ash Sampling 26
G Analytical Procedure 27
1. Liquid Scintillation calibration 27
2. 35S recovered from effluents 29
K Non-routine sampling 31 1. Biological Oxidizer 31 2 Activated Charcoal 32 3 Refractory swipe test 32 4 Statistics 32
m RESULTS AND DISCUSSION 38
A Results of Hypothesis Testing 38
1. Question Number 1 38 2 Question Number 2 40 3 Question Number 3 41 4. Question Number 4 44 B. Discussion of Variability and Error 45 IV CONCLUSIONS 52LIST OF REFERENCES
APPENDICES
A. Burn Calculations
B. Results of Statistic Calculations
C. T Test Results
D. Burn Calculation Computer Program E Trapping Cocktail
LIST OF FIGURES
Page
1. Diagram of Incinerator Stack 2. Schematic of EPA Method 5 3. Impinger Case
4. Control Panel
5. Stack Velocity Profile 6. Stack Temperature Profile 7. Isokinetic Stack Sampler
8. 35s Quench Curve
9. Pooled Samples Probability Plot of % Ash 10. Pooled Samples Probability Plot of % Gas 11. Methionine Probability Plot % Ash
12. %Activity in Gas and Ash Versus Incinerated activity (methionine)
13. %Activity in Gas and Ash Versus Incinerated Activity (sulphate)
14. %Activity in Gas and Ash Versus Sample Volume (methionine)
15. Ash Concentration Versus Activity Incinerated 16 Gas Concentration Versus Activity Incinerated
10 13 15 16 19 20 25 28 35 36 37 42
42
43
Page
1. Incinerator Specifications 11
2. Sample Characteristics 22
3. Results of Trial Burns 39
I would like to thank. Dr. Philip E. Hamrick for his guidance and support throughout the research project. Dr. Steven L. Simon for his assistance in the statistical analysis and editorial skills, and Todd Ivey for his help with equipment and incinerator operation throughout the project.
The study was supported by the National Institute of
Purpose
The National Institute of Environmental Health Sciences (NTEHS)
located at Research Triangle Park, North Carolina, is the principle
Federal biomedical research laboratory investigating the effects of
chemical and biological agents in the environment As is common
with similar facilities, the Institute uses radioactive material
primarily as a tracer in various research projects. The use of
radioactive material is accompanied by the production of radioactive
waste.
The increased costs and restrictions of shallow land burial
disposal persuaded many facilities to begin incinerating low level
radioactive waste. By implementing incineration, the radioactive
material in the waste is concentrated in the residual ash, released in
the effluents or precipitated on the refractory (inside stack) surface,
thereby significantly reducing the volume of waste. Recent
developments in incineration design demonstrate a waste volume
reduction of up to 90% (Cook 1984). Many studies have been
conducted which advocate incineration of low level wastes as an
economical and safe alternative to shallow land burial disposal
(Machis 1952, Glauberman 1964, WoUen 1971, Parker 1981, Cook
1984).
In 1969 NIEHS began incinerating its low level radioactive waste,
above, the principle of radioactive waste incineration is based on the
assumption that the radionuclide is either released in the effluents
during incineration, retained in the residual ash or precipitatedalong
the refractory. In order to investigate this assumption, the Institute
conducted two studies. In 1983, Michael Parker investigated the fate
of ^H and ^^C during incineration by monitoring the gaseous effluents
and particulates. The study was carried further in 1984 by Steven
Knapp. Similar to Parkers study, Knapp monitored the effluents
released during the incineration of ^H and l^c labeled waste. Unlike
Parker, Knapp also investigated the ash to confirm the effluent data.
Neither study investigated 35s
The original objective of this project was to develop a method for
the determination of the fate of sulphur-35 during the incineration
of radioactive waste. This rather broad topic was narrowed as the
project progressed, resulting in the identification of more specific
objectives. From this objective the following four "a-priori" questions
were formulated and investigated during the course of the project:
1) What is the proportion of the total activity incinerated recovered from the ash and from the effluents?
2)Does the relationship between the
proportion in the effluents and in the ash depend on the chemical form of the incinerated waste?
volume of activity incinerated?
4) Is it a valid assumption that the activity can be accounted for in either the ash or the gas?
Review of Literature
Institutional Radioactive Waste Incineration in Chronological Order
Johns Hopkins University published the results of a study in 1952
which addressed the use of incineration as a method for disposal of
its institutional waste (Machis 1952). Waste, with known activities
of 32p ranging from 100 to 2000 |i,Ci, were incinerated at several
different incinerator locations. Ash, effluents and incinerator
refractory were sampled to determine the radioactivity contents. A
large fraction of the activity was recovered from the ash, (20 to
100%), with as much as 32% precipitating on the stack wall. Their
results indicate the effluents rarely registered activity above
background.
In 1964 a study of several waste incinerators, with load capacities
of 20 to 2000 pounds per hour, was contracted by the Atomic Energy
Commission (AEC). Areas investigated included total volume of
reduction of radioactive waste, cost effectiveness of incineration, and
of the activity by the ash ranged from 95 to 100%. The specific
nuclides studied and method of detection were not reported.
A study was conducted at the University of Minnesota,
Minneapolis, from January 1965 through December 1969 to
investigate the use of incineration for the disposal of low level
radioactive waste generated by the university. Animal carcasses and
combustible solid lab waste were incinerated. Based on average
stack gas flow rate and maximum permissible concentration (MPC)
data listed in table 2, Appendix B, 10 CFR 20, the maximum allowable
activity that could be incinerated was calculated for various
radionuclides (Wollan 1971). No report of effluent or ash
radioactivity was made.
Bush and Hundal reported ash retention results for twenty seven
radionuclides incinerated by the University of Birmingham,
Birmingham, England (Bush 1973). The results ranged from 0.02
percent retention for ^^C and 125i to 100% for 22Na and 137Cs. The
results for 35s ranged from 39.6 to 77.2% depending on the chemical
form. The 77.2% retention corresponded to an aqueous solution of
sodium sulphate. No mention was made about radioactivity counting
techniques or effluent sampling of 35s.
The Purdue University School of Veterinary Medicine conducted
a study of the incineration of animal carcasses containing plastic
coated radioactive microspheres labelled with 46sc (Landalt 1983).
An EPA Method 5 approved sampling system was used to monitor
the stack effluents during the 48 minute sampling period. The
amount of activity recovered from the ash were reported to be 97.9
Katsikis et. al (1984) reported on the licensing, design and use of a low level radioactive waste incinerator in North Carolina. The authors speculated that complete combustion of the waste would result in effluents consisting of CO2, H2O, and SO2, with very little activity remaining in the ash. A dual chamber, controlled air incinerator operating at 1850oF in the lower chamber and 2000oF in the upper chamber, was used in the study. No activity was found in the ash; therefore, it was concluded that all the activity was released
into the effluents.
In 1985, Purdue University published data concerning the release of effluent radioactivity during the incineration of animal carcasses
containing microspheres (Brekke 1985). Tin-113,153Gd, 57Co, 95Nb,
and 103ru were the nuclides studied. The report concludes that less
than 17% of the incinerated radioactivity was released to the effluents for all nuclides tested.
The solubility of seventeen radionuclides in ash, which resulted from the incineration of animal carcasses, was investigated at the Mayo Clinic in 1985 (Classic 1985). Twenty aliquots of ash, each weighing 0.1 gram, were placed into 5 ml of distilled water. After a period of one hour, samples were removed and counted using either a gamma or liquid scintillation counter. The percent retention of
radioactivity in the ash for 35s was reported as 0.0%.
An investigation of the fate of l^C and ^H during the incineration
of liquid, low level radioactive waste, conducted at the National Institute of Environmental Health Sciences (NIEHS), reported a mean
percent retention in the ash of less than 0.01% (Hamrick 1986).
above background. The result of that effluent sampling suggested that most of the activity incinerated was released into the
atmosphere as tritiated water vapor or l^C-labeled carbon dioxide.
The literature search identified various papers concerning the incineration of low level radioactive waste. The majority of the papers, however, addressed the topic of incineration as an economic feasibility study, rather than a scientific investigation into the fate of the incinerated radionuclides. The search did identify some
documentation investigating the fate of the incinerated nuclides (^^C
and 3h), but it produced no published experimental data relating the
activity in the effluents and residual ash during the incineration of
35 s labeled radioactive waste. The previous studies which
investigated incineration of 35s made the assumption that the activity is either released in the effluents or retained by the ash. Therefore, only the ash was sampled as an attempt to assess the fate of the radioactivity. The studies in the literature reported retention values ranging from 0 to 90%. One purpose of this study was to investigate the range of ash retention values.
Governmental Regulations
Two Federal agencies are responsible for regulating low-level radioactive waste incineration; The Nuclear Regulatory Commission
(NRC) and the Environmental Protection Agency (EPA). The Code of Federal Regulations (10 CFR 20) contains the NRC regulations for allowed effluent radionuclide concentration. The EPA regulations
concerning nonradioactive emissions are found in 40 CFR 60. The
Environmental Management Commission under Article 21B, Chapter
143. The Nuclear Regulatory Commission also issued a license to
Method of Investigation
A modified EPA Method 5 isokinetic stack sampling system was used to monitor the gaseous effluents released during the
incineration of 35s labeled liquid waste. The residual ash also was
sampled in order to confirm the effluent data for each trial burn. A total of eleven trial burns were conducted. During eight of the trial
bums, samples of 35s labeled methionine with known activities were
incinerated. Aqueous solutions of 35s labeled sulphates were
incinerated in the remaining three burns.
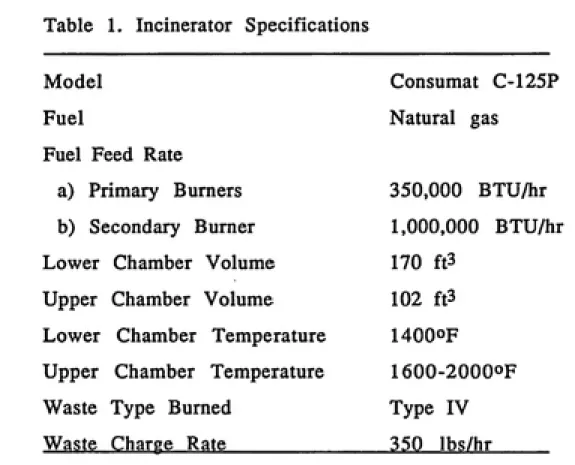
Incinerator Characteristics
A modified, dual chamber, pathological waste incinerator is used by the National Institute of Environmental Health Sciences (NIEHS) to combust type IV (pathological) waste. The incinerator (Consumate Systems INC., Richmond, Virginia) which is fired by four natural gas
burners in the lower chamber and one burner in the upper chamber, is a controlled air incinerator licensed by the state of North Carolina.
The license limits the charge rate to 350 pounds of type IV waste per hour. NIEHS elects to limit the charge rate to 200 pounds per hour.
Waste is loaded into the primary chamber by means of a
hydraulic ram loader. In the primary chamber, the waste is ignited
in a starved air atmosphere by four natural gas burners which
some burners will shut down. Due to the starved air environment,
the oxygen concentration is held below the stoichiometric point (McRee 1986). This condition results in only partial oxidation of the
incinerated waste (Koenig 1986).
The waste gas passes into the secondary chamber where excess air is introduced. The elevated oxygen concentration and high temperature (1600OF) maintained by the upper burner allows for complete oxidation of the waste gas. Under optimal operating conditions, carbon dioxide and water are the major products of combustion (McRee 1986). As the effluents ascend the exhaust stack, additional air is introduced through the air induction collar, thus cooling and diluting the gas before it is released into the
environment.
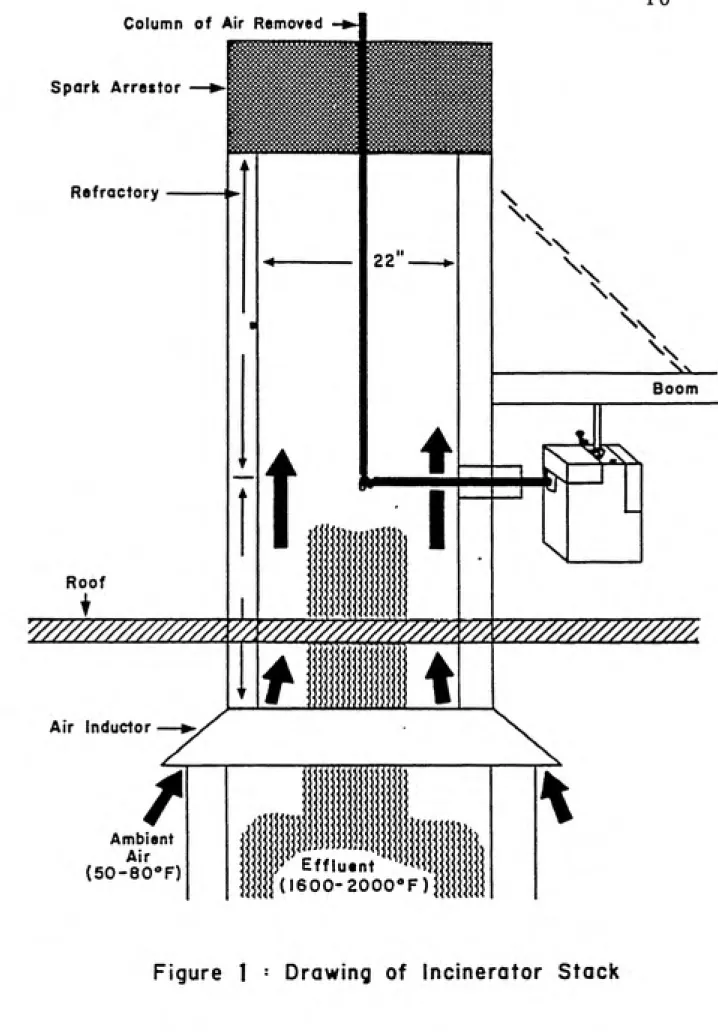
The pathological incinerator has been fitted with two sampling
ports situated ninety degrees apart. The sampling ports are
constructed from 4 inch diameter pipe and are flush mounted to the
inside surface of the 22 inch inside diameter refractory. The ports
are located 42 inches above the roof and 66 inches above the air induction collar. This configuration of sampling ports (Fig. 1) allowssampling in accordance with Environmental Protection Agency
guidelines specified in Appendix A of 40 CFR 60 (USEPA 1985).
The incinerator has a one hour warm-up period which insures
proper chamber temperature. After the final charging, an automatic
five hour burn down cycle is initiated. Table 1 lists some incinerator
Column of Air Removed
Spark Arrettor —ͨ«
Refractory
Boom
Roof
Effluent
(I600-2000*F)?35"55«
Air Inductor
Ambient
Air
(SO-eCF)
Table 1. Incinerator Specifications
Model Fuel
Fuel Feed Rate
a) Primary Burners b) Secondary Burner
Lower Chamber Volume
Upper Chamber Volume
Lower Chamber Temperature Upper Chamber Temperature Waste Type Burned
Waste Charge Rate___________
Consumat C-125P Natural gas
350,000 BTU/hr 1,000,000 BTU/hr 170 ft3
102 ft3
1400OF
Definition of Isokinetic Sampling
Isokinetic sampling is an equal, uniform sampling of particulates and gases in motion within the stack (USEPA 1979a). It provides an unbiased analysis of pollutants being emitted from the source and closely evaluates the various parameters that exists during the sampling interval. Isokinetic conditions are met when the velocity, Vn, of the gas stream entering the nozzle equals the velocity of the gas ascending the stack, Vg. If Vn is not equal to Vg the particulate concentration data derived from the sampling process will be biased, either positively or negatively depending on the relationship of Vq and Vs. Although the focus of this project was not directed towards particulate emissions determination, an isokinetic sampling system was selected because it allows for reliable effluent monitoring.
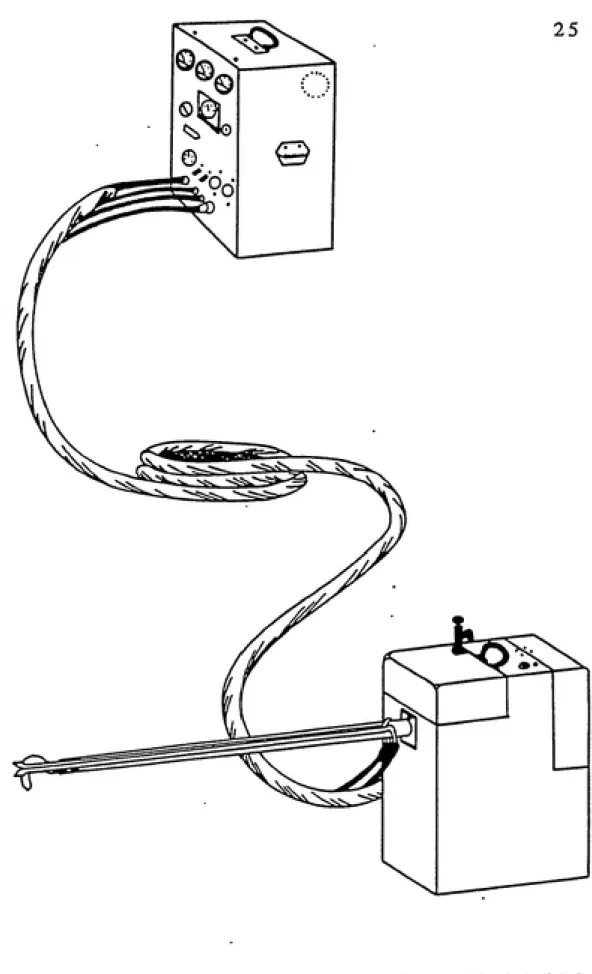
Sampling System
An EPA Method 5 approved stack sampler (Nutech Corporation; Durham, North Carolina, Model 201, Serial No,93-39) was chosen for stack sampling. The sampling train (Fig. 2) is organized into three different components: an in-stack sampling probe, an out of stack
sample case and a meter console.
The sampling probe consists of a sampling nozzle, a S-type pilot
Figure 2- Schematic of EPA Method 5
4
mb^
w]?b
11^
14
^=^u^
1. Sampling nozzle
2. Sampling probe sheath 3. Heated sample probe liner
4. Filter compartment thermometer
5. Out of stack filter assembly 6. Heated filter compartment 7. Impinger cose (ice both) 8. First impinger
9. Second impinger 10. Third impinger 11. Fourth impinger
12. Impinger exit gcs thermometer
13. Check valve to prevent back pressure
14. Vacuum line
15. Pressure gauge
16. Coarse adjustment valve
17. Leak free vacuum pump 18. By-pass valve
19. Dry gas meter with thermometer
20. Orifice meter with manometer 21. Type S pitot tube with manometer
The heated probe liner prevents condensation from occurring as the
sample gas passes through the sampling probe.
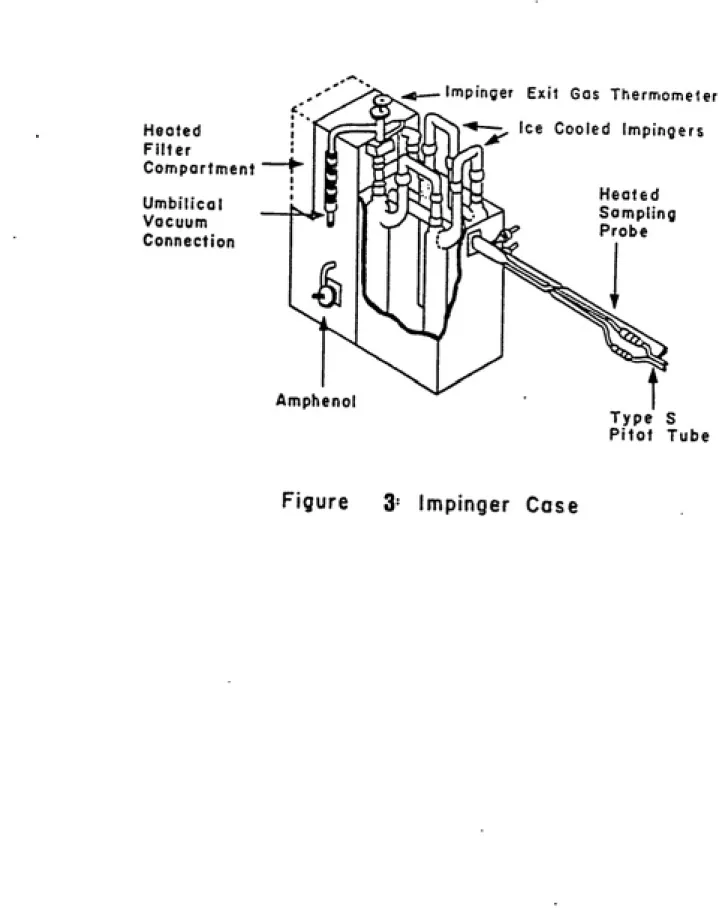
The sample case (Fig. 3) consists of two chambers. A heated
chamber houses a filter bell and an ice cooled chamber houses the
sampling impingers. Gas from the sampling probe enters the sample case in the heated filter compartment and is cooled as it passes through the ice cooled impinger compartment.
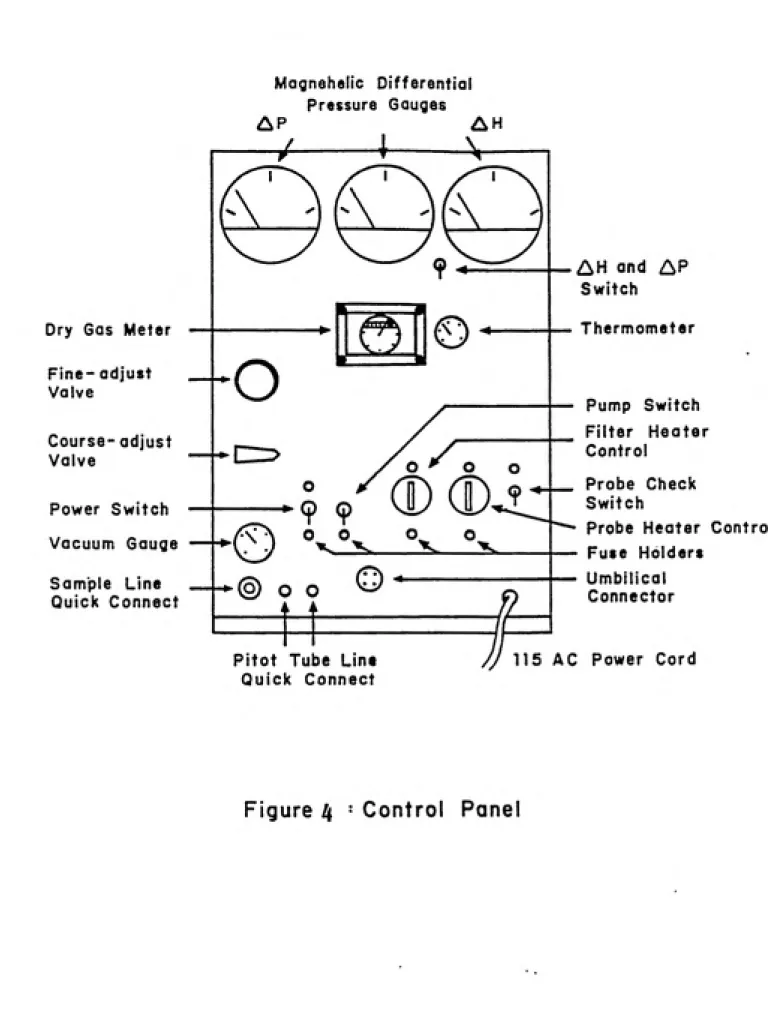
The meter console (Fig. 4) houses the orifice meter, dry gas meter, thermometer, vacuum pump and magnehelic differential gauges. The meter console is connected to the sampling probe and sampling
Heoted
Filter
Compartment
Umbilical
Vacuum
Connection
Ampheno
Impinger Exit Gas Thermome'er
ice Cooled Impingers
Heated
Sompiing
Probe
&
Type S
Pilot Tube
Dry Gas Meter
Fine- adjust
Valve
Course- adjust
Valve
Power Switch
Vacuum Gauge
Sample Line
Quick Connect
Magnehelic Differential
Pressure Gauges
^P ^H
4---V
\
\
o
Pitot Tube Line Quick Connect
AH and AP
Switch
Thermometer
Pump Switch
Filter Heater
Control
Probe Check
Switch
Probe Heater Control
Fuse Holders
Umbilical
Connector
115 AC Power Cord
Characterization of Conditions During Incineration
Using the Nutech sampling system, a traverse across the diameter of the stack was completed following the methodology described in 40 CFR 60 Method 1 (USEPA 1985). Data on stack gas temperature, velocity pressure and pressure differential across the orifice were collected. Using the following equations and the data described above, the velocity, flow rate and temperature were calculated.
(Eq. 1) Vs = Kp Cp-S^ p ^ ^^ g(Va7)
avwhere:Vs = velocity of the stack gas Kp = dimensional constant
Cp = pitot tube calibration coefficient
Ts = absolute temperature of the stack gas Ps = absolute pressure of stack gas
Ms = apparent molecular weight of stack gas Ap = average velocity pressure
=K^^f'^^
(Eq. 2) Cin ='^n,-\/ P„ M„
where :Qm = volumetric flow rate
AH = pressure differential across the orifice
Pm = absolute pressure inches Hg
Tm = absolute temperature at the meter Km = proportionality factor
20 30 40
DISTANCE (cm)
Figure 5. Stack Velocity Profile
ui
oc 3
I-<
DC UI a
s
ui
1500
1400
-
1300-
1100-—I—
20 30
DISTANCE (cm)
—T"
40 50
H TEMPERATURE
Figure 6. Stack Temperature Profile
Radioactivity Sampling
Sample Preparation
During the data collection phase of the project, eleven trial burns
were conducted. Each trial consisted of the following steps. The ^^S
labeled waste was equally distributed among six separate samples.
The volume of each sample was recorded and 1/2 ml aliquots were
taken from each sample in order to determine the total activity. The
activity was quantified by liquid scintillation counting. The activity
was recorded and the samples were poured into individual, 3.78
liter, plastic waste jugs. Each waste jug was placed into a 1.89 x 10^
cm-^ cardboard box lined with a 0.3 mm thick plastic bag. During
incineration, the boxes were loaded in series spaced by a seven
minute interval. The radioactive sulphur was in a methionine
complex in eight of the bums and as a sulphate ion in the remaining
three. During the first four trials, lab waste was the source of the
incinerated ^-^S- In the remaining seven burns the incinerated
solution was made from commercially available source of ^^S,
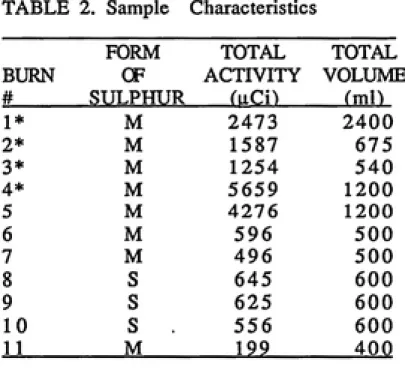
(Amersham/Searle Corporation, Arlington Heights, Illinois). Table 2
lists the chemical form, activity and volume for the eleven trail
burns. Both the effluents and ash residue were sampled for ^^S
content.
Effluent Sampling
TABLE 2. Sample Characteristics
FORM TOTAL TOTAL
BURN CF ACTIVITY VOLUME
# SULPHUR (vlCA) rmn
1* M 2473 2400
2* M 1587 675
3* M 1254 540
4* M 5659 1200
5 M 4276 1200
6 M 596 500
7 M 496 500
8 S 645 600
9 S 625 600
10 S 556 600
11 M 199 400
* Indicates sample made from lab waste
temperature traverse. Under ideal conditions, sulphur dioxide is the
major sulphur combustion product when 35s is incinerated (McRee
1986). Therefore, the contents of the four impingers were selected
for optimal SO2 absorption. During the initial trail burn, the
impinger contents closely followed those outlined in EPA Method 5
(USEPA 1985).
The particulates were removed from the gas stream by a 9.0 cm
glass wool filter (Whatman Limited, England) housed in a filter bell
which was maintained at 250OF. The filter had been desiccated and
weighed prior to the burn. The gas stream was desiccated in the first
impinger which contained 200 grams Silica gel in the form of of 6-16
mesh (Fisher Scientific Company, Pittsburgh, Pennsylvania). Both the
second and third impingers contained 200 milliliters of liquid
scintillation cocktail designed for trapping sulphur dioxide
(Rauschenbach 1974). This cocktail was mixed in the lab based on
methods specified in Appendix E. The fourth impinger contained 200
grams of 8 mesh Drieritte (W. A. Hammond Drieritte Company; Xenia,
Ohio) desiccant. The desiccant removed excess water vapor, thus
protecting the dry gas meter and vacuum pump. The four impingers
were weighed before and after each trial in order to determine the
amount of water vapor condensed and desiccated in the silica gel and
dessicant. During the sampling interval, the four impingers were
cooled in an ice bath.
After the initial trial burn, this sampling configuration was
evaluated and rejected because scintillation analysis showed that
essentially all of the sulphur dioxide had been trapped by the silica
cocktail in the second and third impingers had degenerated resulting
from evaporation caused by the high temperature of the stack gas.
Based on published methods for sulphur dioxide collection (Katz
1977, USEPA 1985, Cheminoff 1978 Landalt 1983, Kusumo 1969), a
new impinger configuration was designed.
A 3% hydrogen peroxide solution (3% H2O2) was made by diluting
100 milliliters of 30% H2O2 reagent with 900 milliliters of deionized,
distilled H2O (EPA 40 CFR 60 Appendix A Method 8). The silica gel in
the first impinger was replaced by 200 to 250 milliliters of 3% H2O2
solution. The second and third impingers also contained dilute H2O2
of the same concentration and volume. In order to protect the
vacuum pump and dry gas meter, 250 grams of 6-16 mesh silica gel
were added to the fourth impinger replacing the 8 mesh Drierite
desiccant used in the initial trial. The four impingers were weighed
and placed into the sampling case. Ice was packed around the
impingers before sampling began. The sampling train schematic is
illustrated in Fig. 7. As the gas sample passed thorough the sampling
train, particulates were removed by a glass filter housed in the filter
bell. The filter paper had been desiccated and weighed prior to the
trial burn. After particulates were removed, the gas passed into the
series of impingers where the sulphur dioxide reacted with the dilute
hydrogen peroxide to form H2SO4, thus trapping the 35s.
Effluent monitoring began ten minutes prior to the loading of the
first box and continued ten minutes after loading the final box. The
boxes were incinerated in series at seven minute intervals. During
temperature, temperature at the meter, and dry gas temperature data were recorded every five minutes. Dry gas volume and
sampling time were also recorded. These data were used to quantify
the volume of the effluents that were pulled through the sampling train (Appendix A). Upon completion of each trial bum, the masses of the impingers and their contents were determined. The change in mass for each impinger was recorded. The filter paper was removed from the filter bell, desiccated and weighed. These data were used in the determination of particulate concentration in the effluents (Appendix A).
Ash Sampling
In order to properly determine the fate of the 3 5s during
incineration, the ash was monitored for radioactivity content. To
ensure that the activity remaining after the burn was due to the 35s,
the incinerator was cleaned by manually sweeping the refractory before each trial burn. After the trial burn was completed and the incinerator had cooled, the refractory was swept again to collect the ash residue. The mass of the ash was determined using a Metier analytical balance. Ten 200 milligram samples of ash were weighed and counted using the Packard Tricarb 4530 liquid scintillation
counter. This instrument had previously been calibrated for 35s
Analytical Procedure
Liquid Scintillation Counting
Sulphur-35 is a pure beta emitter with a maximum energy of 167
keV and average energy of 55 keV. Liquid scintillation was selected
as the method to asses the activity of 35s because it is a simple and
reliable procedure for quantifying beta activity. The Tricarb liquid
scintillation counter (Model 4530 Packard Instrument Company,
Downer Grove, Illinois,) allows for the determination of
disintegrations per minute (DPM) and chemiluminesence correction
by the external source method. By counting samples with a known
activity and variable quench, this technique generates an efficiency
curve specific for a desired radionuclide. Samples were made from a
commercially available 35s standard (Amersham Corp) and varying
amounts of CCI4 which served as a quenching agent. Originally ash
was used as the source of quench, but it was determined that ash did
not provide a wide range of quench values. The SIE values for the
CCI4 and Ash quench curves corresponded to similar efficiencies
(Appendix F). The samples were counted and the data stored in the
memory of the counter and used to determine disintegrations per
minute by dividing the count rate by the efficiency determined from
the quench curve. Figure 8 illustrates the calibration curve for 35s.
The quench curve is specific to the radionuclide as well as the
liquid scintillation cocktail. Because different counting cocktails have
different efficiencies, the scintillation cocktail used to generate the
>ͣ
o z Uj O
iZ ti.
ui
Polynomia
200
T---'---\---'---r
300 400 500
QUENCH (SIE)
Figure 8. S-35 Quench Curve
Q Efficiency (CCI4)
-- - Efficieny %(Ash)
size and shape of the counting vial should also remain constant, thus
avoiding any changes in counting geometry associated with the vial
(Stanely 1974). NEN formula 989 (New England Nuclear) liquid
scintillation cocktail and Packard 7ml plastic vials were used throughout the project.
35s In Effluents
In order to quantify the activity collected from the gaseous effluents, the volume of solution in each impinger is needed. By
utilizing the mass and the density of the solution, the volume of
solution in each impinger was calculated. Five one milliliter aliquots of trapping solution were pipetted from each of the three impingers and decanted into individual 7 ml liquid scintillation counting vials. Six milliliters of NEN formula 989 counting cocktail were added to
each vial. To ensure a homogeneous solution, the samples were
mixed using a test tube vortex. The activity per milliliter then was
determined by counting each sample for a ten minute interval on the
calibrated liquid scintillation counter. From these data, a mean value
of DPM/ml was calculated for each impinger. By multiplying the
mean DPM/ml by the volume of liquid in each impinger, the
disintegrations per minute per impinger were determined. Using
standard conversion factors (2.22x10^ ~^), the DPM values were
converted into microcuries.
The filter paper and silica gel also were counted for radioactivity
samples from the silica gel were weighed and counted using the
liquid scintillation counter. The total activity in the silica gel was
determined by multiplying the total mass of the silica gel by the
activity per gram. To eliminate possible problems with
chemilluminesence due to the silica gel (Stanley 1974), a second
method was developed.
In the second method, the mass of the silica gel first was
determined. Distilled water then was added until saturation was
exceeded. Since the density of water is about equal to 1, the change
in the mass of the silica gel was used as the value for the volume of
water added. One milliliter samples were removed and counted to
determine the activity per milliliter of solution. By multiplying the
concentration of the activity by the total volume of water, the total
activity of the silica gel was determined.
To determine the activity on the filter paper, the paper was cut
into six sections, placed into liquid scintillation counting vials and
counted using the liquid scintillation counter. The activity per
section was summed and used as the value of activity associated
with the filter paper. The activity recovered in the impinger solution,
the silica gel and the filter paper were used to determine the
proportion of the total incinerated activity recovered from the
effluents. This calculation is expressed in more detail in Appendix A.
35s In The Ash
After each trail burn, the ash and residue were collected from the
lower chamber of the incinerator and placed in a plastic bag of a
The change in mass was assumed be the mass of the ash. The
activity remaining in the ash was determined in a manner similar to
the method previously described.
Five 250 milligram samples of ash were weighed and placed into
individual counting vials. The samples were chosen from five
different areas of the ash to try and obtain a representative sample.
Six milliliters of NEN formula 989 counting cocktail were added, and
the samples were counted using the liquid scintillation counter. A
mean value of DPM/250 mg was calculated and multiplied by the
mass of the ash in order to determine the total activity remaining in
the ash. This value was used to calculate the proportion of the total
activity incinerated remaining in the ash.
Non-Routine Sampling
In order to further investigate the fate of 35s during incineration
of radioactive waste at the facility, several non-routine sampling
procedures were performed.
Biological Oxidizer
During trial burn number ten, the gas that was exhausted from
the meter console was collected in two plastic sampling bags with
volumes of about 425 liters. Gas from the first sample bag was
passed through a biological Material Oxidizer (Beckman Instrument,
Inc. Fullerton, California 92634). By applying a vacuum, the sample
gas was drawn into the combustion chamber where it was mixed
would completely oxidize any sulphur compound to the SO2 form.
The off gas was bubbled through two impingers containing 15
milliliters of a 3% H2O2 solution. The SO2 reacts with H2O2 to form
H2SO4, trapping the 35s in solution. The solution was analyzed for
radioactivity by liquid scintillation.
Activated Charcoal
The second bag of gas collected in trial burn number ten was
passed through a sample tube containing activated charcoal. Using a
vacuum pump, the gas was pulled through the charcoal where the
3 5s was trapped. Five 250 milligram samples of charcoal were
weighed and counted using the liquid scintillation detection system.
Refractory Swipe Test
A swipe test was taken from the interior of the upper and lower
chambers of the incinerator as well as the interior of the smoke
stack. Filter discs, (4.25 cm) were inserted through the sampling
port and swipes were made of the area immediately below the port.
This procedure was intended to provide data for estimating the
amount of activity plated out of the gaseous effluents onto the
interior surface of the stack.
Statistical Analysis
Basic statistical calculations were performed on eighteen variables
which had been recorded or calculated from the burn using Systat
(Systat Inc. Evanston, Illinois) software package and a personal
calculated and the minimum, maximum, and the total number of
observations were determined. The calculations were performed on
all of the data from the 11 trial burns as well as the data subdividedinto methionine or sulphate. Pearson correlation coefficients were
calculated and Students t test statistics were determined, for several hypotheses (Appendices B, and C).
The Students t test allows for hypothesis testing by comparing the
variability around the means of two sample populations. A test
statistic is calculated from the following equation which utilizes the
two samples means, standard deviation and number of cases in each
population.
Student's Test
xi - X2 Statistic: t =
#3
\ ni n2The test statistic can be used as guide in decision making. By
comparing the test statistic to a predetermined critical value, the null
hypothesis is either accepted or rejected. The critical region is
dependent on the degrees of freedom of the sample and the size of
the confidence interval (Remington 1985).
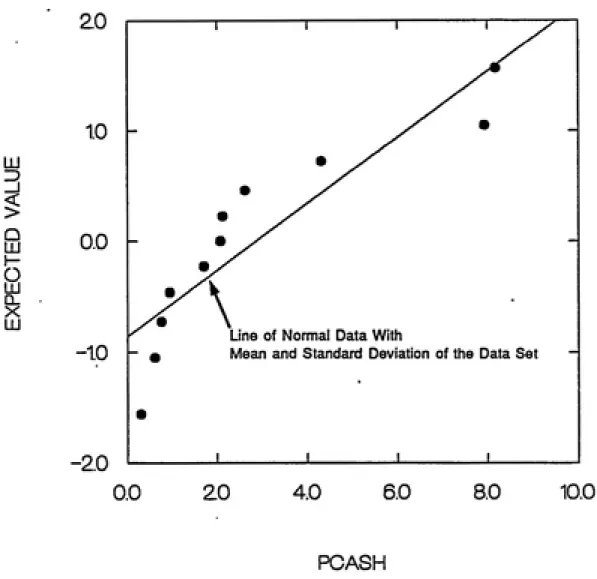
The Students t test assumes that the sample populations follow
normal distributions, however, moderate departures from normality
do not seriously affect results. A probability plot was generated to
recovered from the ash (PCASH) for all eleven trial bums. Figure 10
similarly depicts the deviation from normality of the activity
LU
>
Q
IJJ
H-a
D-X LJJ
2.0
1.0
-0.0
-1.0
-2.0
Line of Normal Data With
Mean and Standard Deviation of the Data Set
0.0 20 4.0 6.0 8.0 10.0
PCASH
Figure 9. Pooled Samples Probability Plot % Ash
HI
Q
LJJ
I
LJJ
2.0
1.0
0.0
-1.0
-2.0
Line of Normal Data With
Mean and Standard Deviation of the Data Set
0.0 50.0 100.0 150.0
PCGAS
Figure 10. Pooled Samples Probability Plot % Gas
2.0
LU ID
_J
<
> Q LU
o
LU
CL X LU
1.0
0.0
1.0
--2.0
1 i 1
•
Vine of Normal Data With
Mean and Standard Deviation of the Data Set
^
•
-•
1 1 1
0.0 20 4.0 6.0 8.0
PCASH
Figure 11. Methionine Probability Plot % Ash
Results of Hypothesis Testing
The results of the four "a-priori" questions discussed in the introduction are discussed in the following paragraphs
Question One
The first question deals with the original objective of the study,
which was to determine the fate of the 35§ during incineration. By
utilizing the computer program in Appendix D, the ash and effluent recovery efficiencies were calculated. The results of the burn calculations listed in Appendix A are summarized in Table 3. The
percent effluent data represents activity trapped by the hydrogen
peroxide solutions, filter paper and silica gel. The ash retention data was computed from the analysis of the ash residue which was
recovered from the lower chamber of the incinerator.
The recovery efficiency (percent of total activity recovered) of the ash ranged from 8.2% to 0.29% with a mean value of 2.9% while the recovery efficiency for the gas ranged from 103% to 26.8% with a
mean of 72.2%. The standard deviations of the ash and gas
recoveries were 2.8 and 27.65%, respectively. When the total population is treated as two distinct groups of Methionine and
Sulphate, the mean effluent recovery efficiencies are 87.02 and
Table 3: Results of Trial Burns
BURN FORM ACTIVITY PERCENT PERCENT CF IN IN IN # SULPHUR uCi EFFLUENT ASH
TOTAL PERCENT RECOVERED
1 M 2473 103.77 0.29 104.1
2 M 1587 83.59 7.93 91.5
3 M 1254 99.76 2.07 101.8
4 M 5659 92.9 0.94 93.8
5 M 4276 63.6 0.75 64.4
6 M 596 87.57 1.70 89.3
7 M 496 84.67 0.61 85.3
8 S 645 26.76 8.18 34.9
9 S 625 38.32 2.12 40.4
10 s 556 32.75 2.62 35.4
11 M 199 80.33 4.31 84.6
Question Two
The question, "does the proportion of the total activity incinerated recovered from the ash and the effluents depend on the chemical form of the activity incinerated?" can be written in the form of the following null hypothesis (Ho).
Ho: Proportion of Total = Proportionof Total
Activity in Ash siiphate Activity in Ash ivfethionine
The value of the computed Students t test statistic for the percent of the activity recovered from the ash for the two chemical forms of sulphur was 1.050. Based on the data and the value of the test statistic, there is insufficient evidence to reject the above null hypothesis (p>0.05). This suggests that the proportion of activity remaining in the ash does not depend on the chemical form of the material incinerated. This is an important finding because from data reported by Bush (1973), we had previously believed that the proportion remaining in the ash for sulphates would be larger than
for methionine.
The above null hypothesis can also be written to investigate the proportion in the gas by substituting "Ash" with "Gas". The test statistic for the gas, 7.095, falls in the critical region of the distribution and therefore there is sufficient evidence to reject the null hypothesis that the proportion of the total activity in the effluents for methionine equals that for sulphates. The values of % effluent recovery listed in Table 3 further support these two
Question Three
Figures 12 and 13 show the relationship between the percent of the total activity recovered from the gas and ash as a function of the total incinerated activity for methionine and sulphate samples separately. Figure 14 in a similar manner depicts the percentage of total incinerated activity which was recovered from the gas and ash as a function of sample volume. There appears not to be a significant relationship for the methionine recovery in the gas and the ash either as a function of total incinerated activity or volume of the sample. The sulphate data are less conclusive since there were only three trial burns using this compound.
The results from the Pearson Correlation values for percent recovered from the gas and ash versus activity for methionine were -.100 and -.332, respectively. For sulphates, the Pearson Correlations in the same category were -.234 and 0.617. When the correlation was calculated for percent recovery from the gas and ash versus sample volume, the results were .366 and .402 for methionine. The correlation of sulphate recovery and sample volume was not
calculated since the volume remained constant in all three trials.
These correlation values indicate that there is no significant linear relationship between these variables. In other words, the change in sample volume or total uCi incinerated appears to have no significant
effect on percentage of activity recovered from the gas or from the
X
C/) <
Q Z < <
^
120
Methionine
Q % IN GAS
• % IN ASH
"-...MEAN % GAS
...MEAN % ASH
0 1000 jjQ 2000 3000 Figure 12: %Activity in Gas and Ash Vs Activity Incinerated
ifu ͣ;
ͤ
X '""""•Er*"""""*""""""
0)
< 30^
Q Q
z
<
CO 20: <
o z
in
-s?
A
u i|-T-i-i-r-T-i I 1 I 1 1 1 1 1 1 1 1 1 1 1 1 1
540 560 580 600 620 640 660
uCi
Figure 13.%Activity in Gas and Ash Vs Activity Incinerated
SULPHATE
Q % IN GAS
• % IN ASH
...MEAN % GAS
<
Q Z
<
<
^u
00
-... .CI. ...
Q
ͤ
-80 -
J^
60-Q
4020
-._-.»W*-.-— —t^m —• — —i ^ ^
0 H ^ -1---*^^=—'------1--- " ͣ
METHIONINE
H % IN GAS
% IN ASH
...MEAN % GAS
---MEAN % ASH
1000 2000
VOLUME OF SAMPLE (ml)
Rgure 14. %Activity in Gas and Ash Vs Sample Volume
Based on the insufficient Pearson Correlation values and scatter
diagrams, it maybe concluded that for those data the percentages recovered from the ash and gas were independent of the volume of sample incinerated and total activity incinerated.
Question Four
The final question addressed the assumption that the activity incinerated could be accounted for in either the ash or the effluents. Stated in the following form the hypothesis is:
PROPORTION OF + PROPORTION OF = 1
TOTAL ACTIVITIY ASH TOTAL ACTIVITY gas
In order to evaluate this question the above formula was rewritten as the following null hypothesis.
Ho: (% IN EFFLUENTS) = (100 - %ASH)
This null hypothesis was used for the sulphate and methionine data separately, as well as the combined sample population. The Students t test statistic for each group is reported in Appendix C
The t value of 2.447 for the methionine data is not in the critical
region defined by the 95% confidence interval. Therefore, there is not sufficient evidence to reject the null hypothesis. The value of the test statistic for the sulphate population, which was 35.720, falls in the critical region. Based on this value and a 95% confidence interval, there is sufficient evidence to reject the null hypothesis.
for methionine was not rejected, it was on the boarder line at the 95% confidence interval and, therefore, it too should be investigated
further.
Discussion of Variability and Error
The fluctuation in the recovery efficiency and the results of the Students t tests data indicate that further investigation to determine the source of variation is needed. Although the data for the ash recovery had a higher deviation when compared to its mean, the
effluent deviation was the area which created more concern.
An obvious explanation for the fluctuating effluent recovery could be a malfunction of the sampling system. A leak in the sampling train, for example, could be responsible for spurious results. This explanation, however, was rejected by the results of leak tests which were performed on the sampling train before and after each trial burn. Pearson correlation coefficients calculated on the dry gas volume versus time, and flow rate versus dry gas volume, suggest a strong, positive correlation, thus indicating that the system was functioning properly. A second hypothesis to explain the variability of recovery was that there was incomplete oxidation of the incinerated samples resulting in an increase in the SO3 proportion of the waste gas (Koenig 1986, McRee 1986). As mentioned earlier, the sampling solutions of H2O2 are designed for SO2 trapping. During the first eight trial burns, the activity recovered from the effluents was
isopropanol solution as an attempt to trap SO3 (Cheminoff 1978, Katz 1977). This sampling modification was utilized in burns nine through eleven. In each case, however, no activity above background was detected. In addition to the SO3 modification, during trial burn ten the exhaust gas was collected in two plastic air sampling bags as it exited the sampling train via the vacuum pump. Analysis of the gas by biological oxidation and activated charcoal also resulted in no measurable activity.
In a further attempt to explain the recovery efficiency discrepancies, swipe tests were taken from the lower and upper chambers of the incinerator as well as the stack. Although the lower and upper chambers indicated no activity, the stack swipe test
picked up 35s activity recording 150-200 CPM above background.
These data seem to indicate that some activity had plated out along the refractory wall of the stack. The lack of measurable activity in the upper and lower chambers may be explained by the high temperatures associated with these areas. As the effluents ascend the stack, air is introduced through the air induction collar. The effluents, therefore, are much cooler than the same effluents located in the upper and lower chambers, thus increasing the potential for plating onto the interior stack surfaces.
The variation of the effluent recovery efficiency data can be explained to some degree by treating the total sample population (all eleven burns) as two discrete populations. The standard deviations of the effluent recovery efficiency for methionine and sulphate are
much smaller than the standard deviation in effluent recovery
listed in Table 4, it is evident that the fluctuation in the effluent recovery efficiency can be attributed to the consistently low values of the sulphate samples. This evidence, along with the results of analyzing question number two, indicates a fluctuation in effluent recovery efficiency due to chemical form.
Another factor that must be considered is the possibility of error resulting from the ash data. The Pearson correlation values for ash concentration and gas concentration versus total incinerated activity are 0.488 and 0.966, respectively. The value of 0.966 for the gas concentration indicates a significant positive correlation exists (p=0.95). If the amount of activity incinerated increases then the concentration of the activity in the gas increases. The value of 0.488 for the ash concentration suggests that there is not sufficient evidence to establish a relationship between concentration in ash and activity incinerated. Figures 15 and 16 further illustrate this idea. These results are important. The source of the ash (cardboard boxes and plastic jugs and bags) was consistent in all eleven trial burns. With the source of the ash held constant, one would expect the activity concentration in the ash, and total activity incinerated, to have a linear relationship. This was not shown conclusively to be the case, which implies that there could be a source of error in the ash quantification. Figure 15 shows that two points in particular are outliers outside the 95% confidence interval. Without these points the relationship of ash concentration and total incinerated activity would
Table 4. Mean and Standard Deviation of Recovery Data
STANDARD
MEAN(%) DEVIATION(%) Methionine (M)
ash 2.325 2.599
gas 87.02 12.459
Sulphate (S)
ash 4.307 3.364
gas 32.61 5.781
M and S Data Pooled
ash 2.866 2.802
O
z
o o
X CO
<
0.4
0.3
0.2
0.1
-0.0
1
95%
1 1 1 / 1
Confidence Interval /
- /
x/.
Possible
/
s
Outlier /
^.^
ͣ
^
95% Confidence Intervalm
/
__ra. .________^
s\
m
.^-''''^ ~~ -~^^^^
m ^y 1 1 1 i"'^---^
0.0 1000.0 2000.0 3000.0 4000.0 5000.0 6000.0
UCI
O
z
o
o I
<
40
3.0
2.0
1.0
-0.0
1 1 1 1 1
/ m
95% Confidence Interval ,
/
^//
^/m
-//^
T^/y^^^lc Confidence Interval
/^ ^/ /
y^A 1 1
ͣ
1 10.0 1000.0 2000.0 3000.0 4000.0 5000.0 6000.0
UCI
Figure 16, which plots the activity concentration in the gas versus
activity incinerated, shows that there is a significant linear
relationship.
This investigation showed that the monitoring of 35s during incineration is not a simple task. The fact that the swipe test of the stack indicated activity plating out can be used to explain, to some degree, the fluctuating recovery efficiencies. The data presented here also indicate that the effluent recovery efficiency is dependent on the chemical form of the incinerated material. The plot of percent activity recovered from the gas versus activity for the two chemical forms (Figs. 12 and 13) further supports this conclusion. It seems that the sulphate form has a higher affinity for plating out onto the interior surfaces of the incinerator stack. Further investigation into this matter is necessary in order to determine whether or not this is an attribute of the sulphates.
The result of the exhaust gas analysis implies that the sampling
system satisfactorily trapped the 35$ in the effluents. Therefore the
fluctuation of the recovery efficiency data can not be attributed to poor trapping efficiency of the 3% H2O2 solution.
LIST OF REFERENCES
Brekke D D., Landolt R R., and Zimmerman N J., "Measurement of Effluent Radioactivity during the Incineration of Carcasses Containing Radioactive Microspheres", Health Physics. Vol. 48 No. 3, pp 339-341, 1985
Bush D. and Hundal R.S., "The Fate of Radioactive Materials Burned in an Institutional Incinerator", Health Physics .Vol. 24, No. 5,
pp 564-568,1973
Cheminoff P.N. and Morresi A.C., Air Pollution Sampling and Analysis Deskbook. 1st. ed.. Vol. 1, Ann Arbor Science, Ann Arbor, 1978,
p 707
Cook F.C.,Jr. and Richard M.L., "Incineration of Low-Level Radiactive Wastes A Planning Approach", Proceedings Industrial Waste Conference. 38th, pp. 251-260,1984
Classic K., Gross G. and Vetter R.J., "Solubility of Radionuclides in Ash from the Incineration of Animals", Health Physics. Vol. 49, No. 6, pp 1270-1271,1985
Glauberman H. and Loysen P., "The Use of Commercial Incinerators for the Volume Reduction of Radioactively Contaminated
Combustible Wastes", Health Phvsics. Vol 10, pp237-241,1964
Hamrick P.E., Knapp S.J., Parker M.G. and Watson J.E., "Incineration
and Monitoring of Low Level ^H and ^^C Wastes at a Biological
Research Institution", Health Phvsics. Vol. 51, No. 4, pp 469-478,
Katsikis E.P,, Worrell L.E. and Lainhurt M.S./'Incineration of Low
Level Radioactive Waste and Scintillation Vials Under Resource
Conservation and Recovery Act", Radiation Risk. Protection Int. Congr.. 6th Vol. 3. pp 1397-1400, 1984
Katz M., ed.. Methods of Air Sampling and Analysis. 2nd ed., Vol.1, American Public Health Association, Washington D.C., 1977 P 707
Knapp S. J., "Monitoring the High Temperature Incineration of ^H
and 14c Liquid Scintillation Wastes," Health and Safety of
Report, National Institute of Environmental Health Sciences, Research Triangle Park, North Carolina, 1984
Koenig R.A. and Vauruska J.S., "Incinerators used for Radvi^aste", Preliminary Program. Incineration Basics Course. Incineration of Low Level and Mixed Wastes: Charlotte, North Carolina April 22-25, 1986
Kusuno K., Shimada S., Jomoto Y., Kanayoma Y., Otabe S., Yasunaga M., Ichijima I. and Isshiki H., "Study on the Behavior of Fuel Oil
Sulphur in Blast Furnace by Radioisotope 35S", Iron and Steel Institute Japan-Trans. Vol.9 No.4, pp 297-305, 1969
Landolt R.R., Barton T.P., Bom G.S., Morris V.R., Vetter R.J. and
Zimmerman N.J., "Evaluation of a Small, Inexpensive Incinerator for Institutional Radioactive Waste", Health Physics. Vol. 44, No.6, pp. 671-675, 1983
Machis A. and Geyer J.L., "Burning Radioactive Wastes in Institutional Incinerators", American Industrial Hygiene Association
Ouarterlv. Vol. 13, pp 199-205, 1952
McRee R.E., "Combustion", Preliminary Program. Incineration Basics
Course. Incineration of Low Level and Mixed Wastes: Charlotte
North Carolina April 22-25, 1986
Rauschenbach P. and Simon H., "Sample Preparation with an Automated Oxygen Flask Combustion Apparatus for Liquid
Scintillation Counting of ^H, l^c and/or 35s Labelled Material",
Liquid Scintillation Counting. Vol. Date 3 ppl58-163, 1973Remington R. D. and Schork M. A., "Hypothesis Testing", Statistics with Applications to the Biological and Health Sciences.
2nd. ed. Prentice-Hall,Inc., New Jresey, 1985, pp. 165-204
Stanley P.F.and Scoggin B.A., ed. " Choice of Counting Vial For Liquid Scintillation : A Review ", Liquid Scintillation Counting. Recent Developments, 1st. ed., Vol. 1, Academic Press, New York, 1974, pp 431-446
USEPA 1979a United States Environmental Protection Agency, Source Sampling for Particulate Pollutants: Student Manual for
APTI Course 450. EPA 450/2-79-006, 1979.
USEPA 1979b United States Environmental Protection Agency,
Source Sampling for Particulate Pollutants: Student Workbook to APTI Course 450. EPA 450/2-79-007,1979
USEPA 1985 United States Environmental Protection Agency, Code of Federal Regulations, Title 40, Part 60, 1985
Wollen R.O., Staiger J.W. and Boge R.J. "Disposal of Low Level
Radioactive Waste at A Large University Incinerator", American Industrial Hygiene Association Journal. Vol. 32, No. 9,
APPENDIX A
EQUATIONS FOR BURN CALCULATIONS
Eq. 1: DRY GAS VOLUME MEASURED BY THE DRY GAS METER CORRECTED TO
STANDARD CONDITIONS Vmstd (ft3)
Vmstd= (VmHTstdVPbar+(H/13.6))
(Tm)(Pstd)
Where:
Vm =Dry gas volume measured by Dry Gas meter in (Ft.3)
Tstd =Standard absolute temperature (5280R, or=of+460)
Pbar =Barometric pressure drop at dry gas meter (in. Hg)
H =Mean Pressure drop across orifice meter in (in. Hg)
Tm =Absolute average dry gas temperature (°R)
Pstd =Standard absolute pressure (29.92 in. Hg)
Eq.2: PROPORTION OF WATER VAPOR IN THE STACK GAS STREAM
B ws
Bws= Vwc(std) + VwdCstd)_____________ Vwc(std) + Vwd(std) + Vm(std)
Where:
Vwc(std)=Volume of Water condensed at standard conditions
Vwd(std)=Volume of water dessicated at standard conditions
Vm(std)=From equation 1
Eq.3: DRY GAS MOLECULAR WEIGH OF STACK GAS
Md
Md=0.44(%CO2)+0.32(%O2)+0.28(%CO+%N2)
Where:
%C02 =percent CO2 by volume, (1.2%) %C)2 =percent O2 by volume, (17.8%) %C0 =percent CO by volume,.(0.1%) %N2 =percent N2 by volume, (80.9%)
0.28 =molecular weight of CO and N2 divided by 200
Eq.4: WET MOLECULAR WEIGHT OF STACK GAS
Ms
Ms=Md( 1-B ws)+l 8(B ws)
Where:
Md =Dry molecular weight of stack gas Bws=Proportion of water vapor is stack gas 1 8 =Molecular weight of water
Eq. 5: AVERAGE STACK GAS VELOCITY Vs (ft/s)
Vs=(0.7473)(Kp)(Cp)^^^^VaS
avWhere:
Kp=85.49 Cp=0.85
Ts=Absolute average temperature of the stack gas corrected (oR)
Ap=Average velocity pressure (in. water) Ps=Absolute pressure of the stack gas (in. Hg) Ms=Wet molecular weight of the stack gas (Eq. 4) 0.7473=Velocity correction factor based on velocity
profile
Eq.6: DRY VOLUMETRIC STACK GAS FLOW RATE AT STD
Ostd=3600n-Bws)rVs')('A)(TstdHPs)
(Ts)(Pstd)
Where:
Bws=From equation 2
Vs= Average Stack gas velocity (Eq 5) A=Cross sectional area of stack (2.906Ft.2)
Ts=Absolute average corrected stack gas temperature based on temperature profile
Pstd=29.92 Eq. 7: PERCENT EXCESS AIR
%EA= %O9-0.5(%CO^ X 100
0.264(%N2)-(%O2)+0.5(%CO) Where:
% 02=percent O2 by volume % CO=percent CO by volume %N2=percent N2 by volume
0.5=ratio of O2 to CO correcting for incomplete
oxidation
0.264=ratio of O2 to N2 in air by volume
Eq.8: PERCENT ISOKINETIC VARIATION
%I=rTs¥(Vlc¥K>+(Vm/TmKPbar+H/13.6^) XlOO
(60)(ei)(An)(Vs)(Ps)
Where:
Ts=Absolute average stack temperature (oR)
Vlc=Total volume of liquid collected in impingers (ml) K=Conversion Factor (0.002669in-Hg-Ft3/ml-oR)
Vm=Dry gas volume measured at meter (dcf) Tm=Absolute average dry gas temperature Pbar=Barometric pressure (in. Hg)
H=Average pressure drop across the orifice meter (in Hg)
®l=Total sampling time (min.)
An=Cross sectional area of nozzle (0.000716 ft.2) Vs=Average stack gas velocity (ft/S)
Ps=Absolute stack gas pressure (in Hg) 13.6=Specific gravity of mercury
Eq. 9: PARTICULATE EMISSION CONCENTRATION CORRECTED TO 12
%CQ2
Csl2 (g/dscdf)
Csl2=12(Mn)/(Vmstd)(%CO2)=2.3xl0-4 g/ft3 Where:
Mn=Mass of particulates collected (grams) Vmstd= From equation 1
12=correction factor
%C02=percent CO2 by volume from waste
Eq. 10 DRY STACK GAS VOLUME RELEASED DURING SAMPLING
AT STANDARD CONDITION
Vq=(Qsd)(02)=ft3
Where:
Qsd=Dry volumetric stack gas flow rate at standard Conditions
02=Total sampling time in Hrs.
Eq. 11 TOTAL MONITORED ACTIVITY
Am=(Ac)(Vq)/Vmstd Where:
Vq=Dry stack gas volume released at standard conditions
Ac=Activity collected during sampling, (|iCi)
Vmstd=Dry gas volume measured by dry gas meter
Eq.l2: ACTIVITY RECOVERED IN THE ASH
Aa=(}iCi/g)(mass of ash collected)
Where:
|j.Ci=Micro curies collected per gram of ash
Eq. 13: Recovery efficiency A) In Effluent Collection
Reg=Am/Ai XI00 Where:
Am=total activity from the gas (|iCi) Ai=total activity incinerated (iiCi) B) In Ash Collection
Rea=Aa/Ai X 100
Where:
Aa=Activity of ash Ai=Activity Incinerated C) Total
Ret=(Am+Aa)/Ai XI00 Where:
APPENDIX B
RESULTS OF SIMPLE STATISTICAL CALCULATIONS
Table 1: Methionine Data
VARIABLE NUMBER MIN MAX MEAN STANDARD CF
CASES DEVIATION
Gas Vol 8 31.25 54.90 35.93 7.78
Ap 8 0.11 0.13 0.12 0.01
AH 8 2.86 4.08 3.27 0.44
Pbar 8 28.92 30.90 29.72 0.69
Tm 8 500.29 589.00 534.16 27.13
Ts 8 1258.90 1494.83 1363.53 83.02 Ai* 8 199.40 5659.80 2067.68 1962.69
% in Ash 8 0.29 7.93 2.33 2.59
% in Gas 8 63.60 103.77 87.02 12.47 %Isokinetic 8 106.75 148.85 121.37 13.04
Flow rate 8 0.51 0.65 0.59 0.04
Ash Cone 8 1.16 32.36 12.79 13.05
Gas Cone 8 467.32 16015.70 5018.43 5058.12
Table 2: Sulphate Data
VARIABLE NUMBER MIN MAX MEAN STANDARD OF
CASES DEVIATION
Gas Vol 3 32.51 34.63 33.62 1.07
Ap 3 0.12 0.14 0.13 0.01
AH 3 2.90 3.50 3.26 0.32
Pbar 3 29.80 30.22 29.99 0.21
Tm 3 539.90 551.58 545.83 5.84
Ts 3 1419.00 1493.25 1458.01 37.27
Ai* 3 556.40 645.18 608.94 43.58
% in Ash 3 2.12 8.18 4.31 3.37
% in Gas 3 26.76 38.32 32.61 5.78
%Isokinet 3 117.89 119.51 118.61 0.86
Flow rate 3 0.57 0.62 0.59 0.03
Ash Cone 3 3.69 21.89 10.26 10.11
APPENDIX C
STUDENT'S T TEST RESULTS
I. Methionine Data: 8 Cases
A) Paired Samples t-test on :%Gas Vs% Ash l)Mean difference = 84.699
2)Standard deviation difference = 13.149 3)T = 18.219
4)Degrees of freedom = 7 5)Prob = 0.000
B) Paired Samples t-Test On: %Gas Vs (100-%Ash) l)Mean Difference = -10.651
2)Standard Deviation Difference = 12.311 3)T = 2.447
4)Degrees of Freedom = 7
5)PR0B = .044
11 Sulphate Data: 3 Cases
A) Paired Samples t-test on % Gas Vs % Ash l)Mean Difference = 28.303
2)Standard deviation difference = 8.951 3)T = 5.477
5)Prob. = .032
B) Paired Samples t-Test On %Gas Vs (100-%Ash) l)Mean Difference = -63.083
2)Standard Deviation Difference = 3.059 3)T = 35.720
4)Degrees of Freedom = 2 5)Prob = .001
III Pooled Data : 11 Cases
A)Paired Samples t-test on: %Gas Vs %Ash l)Mean Difference = 69.318
2)Standard Deviation Difference = 28.826 3)T = 7.975
4)Degrees of Freedom = 10 5)Prob. =0.000
B)Independent Samples t-Test On: %Ash
GROUP N MEAN________SD
m 8 2.325 2.599 s 3 4.307 3.364
l)Separate Variances
a)T = 922
b)DF = 3.0 c)Prob = .454 2)Pooled Variances
a)T = 1.050
b)DF = 9
c)Prob = .321
C)Independent Samples t-Test On: %gas
GROUP N MEAN________SD
m 8 87.024 12.469
s 3 32.610 5.781
l)Separate Variances a)T = 9.841
b)DF = 8.1
c)Prob. =0.000
2)Pooled Variances
a)T = 7.095
b)DF = 9
APPENDIX D
Stack Sampling Computer Program
* type s-35
10 REM. 20 REM 30 REM 40 REM 50 REM 60 REM 70 REM 72 OPEN 80 PRINT ' 90 PRINT ' 95 PRINT 100 PRINT 110 PRINT 120 PRINT 130 PRINT 140 PRINT 150 PRINT 160 REM 162 PRINT 164 PRINT 170 INPUT ISO INPUT 150 INPUT 200 INPUT 210 INPUT 220 INPUT 230 INPUT 240 INPUT 250 INPUT 260 INPUT 270 INPUT 2S0 INPUT 250 INPUT
30 0 INPUT
310 INPUT 320 INPUT 330 REM 340 REM 350 REM 360 PRINT 370 INPUT
380 IF A* 330 PRINT 40 0 PRINT
410 PRINT 420 PRINT 430 PRINT 440 PRINT 450 PRINT has
PROGRAM TO PERFORM BURN CALCULATIONS
PROGRAM INCLUDES THE INPUT OF
NINETEEN ^^ARIABLES AND OUTPUTS
DATA TO THE FILE BURNDATA.DAT
BURNDATA.DAT" FOR OUTPUT AS FILE #1
"THIS PROGRAM PERFORMS THE CALCULATIONS FOR SOME" "STACK SAMPLING."
YOU NILL BE PROMPTED TO
COMPLETION OF THE INPUT
LIST THE DATA AND
EXIST."
ENTER YOUR DATA AND UPON"
, YOU NILL HAUE A CHANCE TO'
CHANGE ANY MISTAKES THAT MIGHT"
REQUEST FOR INPUT FOLLOWS
"PLEASE INPUT VALUES FOR THE FOLLOWING"
DRY GAS »v^OLUME ? UM = " ; VM
BAROMETRIC PRESSURE ? PBAR ="; PBAR MEAN PRESSURE DROP ? H = ";H
DRY GAS METER TEMPERATURE IN DEG. R ? TM = ";TM VOLUME OF WATER CONDENSED IN ML ? ^.'WC(STD) = " jVWC VOLUME OF WATER DESSICATED IN ML ? VWD(STD) = ";UWD
PERCENT OF C02,02,C0,N2 (SEPARATE BY COMMAS) - ";C02,QJ
ABSOLUTE AVG TEMP OF STACK GAS,. DEG. R ? TS = " ;TS AVERAGE VELOCITY PRESSURE,P ? VP = ";VP
CC
TOTAL VOL. OF LIQUID COLLECTED IN
TOTAL SAMPLING TIME IN MIN. ? 01 = "
MASS OF PARTICULATES COLLECTED, IN G
ACTIVITY COLLECTED IN TRAPS IN MICRO
MA?
IMPINGERS
" ; 01
? MN =
CI
VIC = ";V1C
;MN
AC = ";AC OF ASH COLLECTED ^ MASS = ";MASS
DISINTEGRATIONS PER MINUTE IN ASH ' DPM
ACTIVITY INCINERATED IN MICRO CI ? AI =
OPTION TO LIST THE DATA
DPM
lAI
WOULD YOU
"VM = ' "PBAR = " H = " II -p[^,i _ I "VWC = "VWD = "C02 = LIKE GOTO THEN " ;VM
= " ;PBAR
;H " ;TM
;VWC ;VWD ; C02
TO LIST THE DATA? 350 ELSE GOTO 600
![Figure 2- Schematic of EPA Method 5 4 mb^ w]?b 11 ^ 14 ^=^u^ 1. Sampling nozzle](https://thumb-us.123doks.com/thumbv2/123dok_us/8336527.2213047/19.931.183.887.66.1116/figure-schematic-epa-method-mb-w-sampling-nozzle.webp)