ASSESSING THE STRATEGIES FOR
INCREASING MODERATE TO VIGOROUS PHYSICAL ACTIVITY
IN CHILDREN BIRTH TO 5 YEARS OF AGE IN THE PREVENTION OF OBESITY: SYSTEMATIC REVIEW OF THE LITERATURE
By
Sonia Cotto-Moreno
A Master’s Paper submitted to the faculty of the University of North Carolina at Chapel Hill
In partial fulfillment of the requirements for the degree of Master of Public Health in
the Public Health Leadership Program.
Chapel Hill
2010
___________________________
ABSTRACT
Purpose: A systematic review of the literature was conducted to identify the most current
research studies describing the impact of increasing physical activity in children ages birth to
five years for the prevention of childhood overweight/obesity.
Background: From 1980 to 2001 researchers found an increased prevalenceof being overweight
from 6.3% to 10.0% and increased at-risk-for-overweight from 11.1% to 14.4% in children
including infants less than 6 monthsof age. Studies have shown children who were ever
overweight during the ages 24, 36, or 54 months were more than five times as likely to be
overweight at age 12 years compared to those not overweight at all three referenced ages. The
recently released 2008 Physical Activity Guidelines for Americans only targets people greater
than 6 years of age. Currently, the 2002 National Association for Sport and Physical Education
guidelines is currently the only source that specifies the types of physical activity for infants,
toddlers and preschoolers. The research behind the NASPE guidelines extend from 1985 to 2000,
nonetheless they were a utilized as a reference for recommended physical activity levels in
young children in this systematic review of the literature.
Methods: The literature review began on July 2009 and concluded in January 2010 with
searches in PubMed, CINAHL and PsycHe. The search criteria included: publication date
January 2000 through December 2009, English language, and children (from infancy through 5
years of age). The Medical Subject Headings Terms (MeSH) included health promotion,
well-being, active living, physical activity, exercise, and childhood in order to expand the number of
qualitative and quantitative research projects conducted in the target population. The exclusion
literature review included insufficient research on physical activity in the selected age group and
use of different methodology across studies.
Conclusion: Of the 37 journal articles included in this review, only one study stated definitively
that physical activity predicts future body fat. Only six articles (16%) identified physical activity
as a successful weight loss intervention when combined with nutrition education, counseling and
long term trials involving entire families. However, studies involving older children and
adolescents indicate correlations between the built environment, reduced physical activity and
childhood obesity. The factors most influential in young children’s physical activity levels were:
gender, age, social-economic status, race, ethnicity, parental or caregiver’s weight status, infant
prematurity, maternal education and mental health and extended family health beliefs.
Caregiver/teacher training on developmentally appropriate physical activity practices influences
children’s motor skill development confidence, which impacts activity levels. There were seven
distinct observational instruments/physical activity assessment tools validated for use in the
target population to assist researchers in developing evidence-based strategies. These tools
should facilitate further studies essential for policy makers supporting consistent physical
activity and screen time regulations for young children and reliable quality child care indicators.
Although the Healthy People 2020 goals have yet to be established, there should be sufficient
support for addressing the lack of physical activity guidelines for children birth through five
INTRODUCTION
Background
Community based and primary care practitioners are searching for evidence-to-practice
based strategies to address one of the world’s major public health issues—overweight, obesity
and its co-morbidities. Although social ecological frameworks are shedding light on the multiple
intervention levels required to promote healthy lifestyle behaviors, researchers and expert
committees are finally looking to early childhood as an effective target population to aim
prevention. Caregivers (relationship) and environments (community and society) are part of the
framework and their influence is one consistently agreed upon in research findings. The
guardianship of very young children in family child care homes and in child care settings is
hindered by social-economic status; inconsistent national and state child care policies;
inappropriate developmental practices and built environments limiting physical activity. These
concerns when combined with the growing number of children in child care settings at younger
ages, with the insufficient research and data collection in children birth to 5 years of age threaten
the limited resources of the U.S. public health system. Childhood obesity will decrease the
quality of life of millions of children, will overburden health care costs related to associated
co-morbidities, and negatively impacts children’s social-emotional development .
The Overweight/Obesity Epidemic
The rates of overweight and obesity in children continues to alarm many public health
practitioners, health care providers and researchers. In infants less than six monthsthrough five
years of age the prevalence of being overweight increased from 6.3% to 10.0% from 1980 to
2001 and being at-risk-for-overweight increased from 11.1% to 14.4% (3). A body mass index
percentile is overweight in children over two years of age based on the 2000 Centers for Disease
Control’s (CDC) gender-specific growth charts. In children less than two years o f age the 2000
CDC clinical growth charts are utilized to assess growth patterns using the same percentile
ranges based on weight to length/height parameters (4).
Data collection for children birth through five years of age is beginning to progress,
especially for minorities. The CDC Pediatric Nutrition Surveillance System (PedNSS) compiles
state and local level overweight/obesity data for low-income, infants, toddlers and preschool
children participating in federally funded health and nutrition programs (5). This includes 85% of
the reported data originating from the Special Supplemental Nutrition Program for Women,
Infants, and Children (WIC) and 15% from non-WIC programs, i.e., the Early and Periodic
Screening, Diagnosis, and Treatment (EPSDT) Program and Title V Maternal and Child Health
Program. Results of the 2007 PedNSS, indicate prevalence of obesity among preschool children
aged 2–5 years was 14.9%, up from 12.2% in 1998. The highest obesity rates were reported
among American Indian or Alaskan Native (19.5%) and Hispanic (18.2%) children; the lowest
rates were among white (12.4%), black (11.9%), and Asian or Pacific Islander (10.8%) children.
No contributor to the PedNSS met the Healthy People 2010 obesity objective aimed at
reducing the percentage of overweight children and adolescents ages 6-19 years to five percent.
There was no weight or physical activity related HP 2010 goal specific for infants, toddlers and
preschool children under six years of age (5,6). Studies have shown children who were ever
overweight equal to or greater than one time at ages 24, 36, or 54 months during this period were
more than five times as likely to be overweight at age 12 years compared to those below the 85th
percentile for BMI at all three referenced preschool ages (7). In spite of these findings, only
approaches (2). The geographic patterns for overweight/obesity in low-income, preschool-aged
children from 2006-2008 varied significantly by county and within a state. Overall, obesity
prevalence is highest in western and southern California, southern Texas, the central and north
eastern seaboard, and some Appalachian states. Nearly all counties on the West Coast have
prevalence above 15%, whereas many of the counties in the Rocky Mountains have rates below
10% (5). The majority of the referenced regions/states do not have regulations specifying the
amount or length of time required to meet the indoor or outdoor recommended physical activity
guidelines for young children in center or home based child care settings.
Pediatric Data
The 2007 PedNSS data represent records from 42% Hispanic children; 32%
non-Hispanic white; 20% non-non-Hispanic black; 3% Asian or Pacific Islander; 1% American Indian or
Alaska Native; and 2% from children of all other or unspecified races and ethnicities. From 1998
through 2007, the proportion of records submitted to PedNSS for Hispanic children increased
from approximately 27% to 41%, respectively. During the same period, the proportion of records
for non-Hispanic and black children declined. Most PedNSS records (62%) were from children
aged 1–5 years; 38% were from infants aged less than 1 year. The current data may not be an
adequate representation of the total population since it is reflective of children receiving social
Child Care Participation Rates
The number of children in child care settings continues to increase at all income levels.
The percentage of kindergartners enrolled in full-day programs increased from 28% in 1977 to
65% in 2003. In the year 2000, half the children under 1 year of age and two-thirds of children
less than 3 years of age were in child care and the number continues to rise (8). The statistics are
somewhat skewed as the Census Bureau’s analysis on which they are based, indicate that
minorities and young children were missed at higher rates than other people in the 2000 Census.
However these figures still identify opportunities to evaluate policies and interventions in these
settings. The number of children ages 3-, 4- and 5 years who are cared for in center-based
programs (e.g., child care centers, Head Start programs, publicly funded prekindergarten and
private child care) has further increased to an estimated 7.5 million—roughly one-third of the
child population (9). These figures do not include care by family members or residential child
care, or children less than 3 years of age, only early childhood education programs.
Center-based programs also referred to as "nursery school" and "preschool" include any and all entities
providing educational experiences for children during the years preceding kindergarten. The data
reported for 2003 show differences by race and ethnicity are worth noting. Non-Hispanic black
kindergartners were much more likely to be enrolled in full-day programs at 80% compared to
68% American Indian; 64% non-Hispanic white; 57% Hispanic; and 59% Asian or Pacific
Islander. There are regional differences as well, with kindergartners in the South more than twice
as likely than those in the West to be enrolled in full-day kindergarten (85% versus 41%,
respectively, in 2003). Kindergartners in the Northeast and Midwest fell in the middle at 63%
and 59%, in that order for the same time period. Additional differences were reported based on
be enrolled in full-day programs. For example, in 2003, 71% of kindergartners with household
incomes between $15,000 and $29,000 were enrolled in full-day programs, compared to 58%
with household incomes of $75,000 or greater. Lastly the hours in care by children five years of
age also differed by school type: 72% of kindergartners in private school were enrolled in
full-day programs, compared with 63% in public school (10).
Child Development
Extensive research has shown that social economic indicators affect a child’s cognitive
development. A recent report indicated 13,241,000 (19%) of children 0-17 years of age are living
in poverty and given the most recent recession that number threatens to rise (10). Blacks,
American Indian and Hispanic children have the highest child poverty rates at 34%, 31% and
28% respectively. The Hispanic child population percentage increased from 9% to 19% between
1980 and 2004, and is expected to continue rising to 24% by 2020. The minority adult population
caring for these children also has one of the highest rates of diabetes, cardiovascular disease,
hypertension, cancer and obesity rates in the nation. Compounding the challenge, children in low
income working families are those most often exposed to experiences in lower quality child care
(10). Early childhood education programs and child care settings are effective public venues
where children can eat healthy and meet their requirements for physical activity to prevent
further increases in obesity (2).
Physical Activity in Young Children
In 2008 the United States (U.S.) Department of Health and Human Services marked the
first ever release of Physical Activity Guidelines for Americans (11). The guidelines are based
on the 2007 Physical Activity Guidelines Committee Report which ―conducted an extensive
1996 Surgeon General’s Report on Physical Activity and Health‖ (12). However, the guidelines
do not include children less than 6 years of age. The Community Evidence-Based Strategies for
Obesity Prevention released in 2009 by the CDC did not address physical activity in early
childhood development programs, including family, private or subsidized child care, or
prekindergarten (13). In 2002 the National Association for Sport and Physical Education
(NASPE) released guidelines for all age groups categorized by infants (birth to 12 months old),
toddlers (12 to 36 months old), and preschoolers (ages 3 to 5 years) and based on research
studies of motor development, movement, and exercise physiology specialists (14). The NASPE
guidelines recommend 120 minutes per day of total physical activity (60 minutes of structured
and 60 minutes unstructured activities). Details are provided describing the kind of physical
activity, as well as the environment, and individuals responsible for facilitating these activities in
each age group. This information has not translated into consistent physical activity requirements
in national child care licensing regulations and/or early childhood development settings.
Factors Influencing Physical Activity
Child care settings offer an important venue to focus on obesity and overweight
prevention strategies. Recent studies have indicated the need for caregivers to monitor young
children at early ages to begin identifying motor skill performance as a factor influencing their
future physical activity levels (15). Studies underscore several causes to low activity levels,
including lack of teacher enthusiasm (16). Nonetheless a healthy balance of sedentary behavior
with optimum levels of moderate to vigorous physical activity (MVPA) is required for normal
healthy development. Children require a specific measure of sedentary time to facilitate their
cognitive capacities (e.g., learning to read or problem-solve), fine motor skills (e.g., writing) and
describing ―physical inactivity‖ versus sedentary behavior; both have lower levels of energy
expenditure, however these terms do not adequately reflect the behaviors associated with bouts
of inactivity leading to overweight and/or obesity, i.e., eating while watching a TV, video, and
playing computer games. Having valid assessment tools for this population would provide more
insight into what children are actually doing while they are sedentary or inactive (17).
Child Care Licensing Regulations
The lack of consistent child care regulations across the U.S. limiting the amount of screen
time, a term used to describe time children should spend watching television or computer
screens, or mandating appropriate indoor and outdoor activities for young children in child care
is a concern. A recent study examining maternal education, income status, home environments
and TV screen time on weight status, revealed exposure to TV even as background noise, is a
higher predictor of overweight status regardless of whether children are engaged in other
activities (18). Researchers indicate child care licensing regulations should support early
childhood educators becoming informed about children’s physical activity requirements because
many settings are not encouraging appropriate levels. A recent observational study revealed that
children 3-5 years of age are not very active spending as much as 89% of their day in sedentary
activity, 8% in light activity, and as little as 3% to 5% in MVPA (16). The study recommends the
need to work with caregivers and parents to monitor motor skill development which appears to
be a strong predictor of physical activity levels.
Facilitating Physical Activity
Adults require a greater understanding on the elements which facilitate physical activity
in young children. Teachers, caregivers and parents need guidance on how to help foster
children (15). A child’s self-esteem and weight may further inhibit physical activity levels,
negatively affecting their future weight status which as reported increases the likelihood of
adolescent and adult onset obesity and its co-morbidities (19,20). There are also social and
environmental factors influencing physical activity levels in young children that may negatively
impact the amount of time spent in MVPA outdoors versus indoors (15). Adult initiated
structured activities outdoors limits the amount of time children are active compared to
intentional structured indoor activities which significantly contributes to a child’s MVPA.
Additionally, parents/guardians also influence their child’s physical activity by the type of indoor
and outdoor play rules, family recreation activities, and by prompting a child to be more active
(21). Early childhood development programs and child care settings are poised to be an effective
public health partner in advocating for increasing MVPA and reducing TV screen time in young
children to meet the requirements of two hours for children over two years of age and zero for
younger children. Although limited, current research supports the need for policy makers to
implement licensing regulation that favor environmental practices promoting healthy lifestyles in
early childhood development centers/schools and child care settings.
Two studies have been conducted to date reviewing U.S. state regulations for child care.
The evidenced revealed that most states had few regulations related to the prevention of
childhood obesity (2,22). These were the first comprehensive review of nutrition and physical
activity regulations in the U.S. related to childhood obesity for child care facilities, emphasizing
the need for additional research on this topic. The focus on classifying and categorizing state
level policy related to physical education and nutrition services has been in school settings
(children ages 6 to 18 years), but researchers have not extended their review to include state
Assessment Tools
A randomized controlled study was conducted in North Carolina using the Nutrition and
Physical Activity Self-Assessment for Child Care (NAP SACC). In this study a sample of child
care health consultants and centers utilized the NAP SACC in an effort to create a single set of
comprehensive guidelines for physical activity for child care centers. The NAP SACC tool
mainly addresses the inter-personal and organizational levels of the social ecological model
aimed at ―child care policy, practice and environmental influences on nutrition and physical
activity behaviors in young children‖ (23). These best-practice guidelines may need additional
modification by a panel of experts and/or committee review. Reducing childhood obesity will
require effective prevention strategies that focus on environments and policies promoting
physical activity, as well as healthy lifestyles for families, child care centers, and communities.
In addition to fine-tuning a valid child care self-assessment tool, it may also be important to
make a distinction between the terms related to a child’s healthy development: motor skills,
physical activity, exercise and physical fitness.
The aforementioned terms are sometimes used interchangeably, yet they have distinct
meanings. The following definitions have been identified by the President’s Council of Physical
Fitness and Sports (24):
―Motor skills are non-fitness abilities that improve with practice (learning) and relate to
one's ability to perform specific sports and other motor tasks.”
“Physical activity is a bodily movement that is produced by the contraction of skeletal
muscle and that substantially increases energy expenditure.” Physical activity can be
activity such as exercise, sports, and dance (among others) are considered as
sub-categories of physical activity.” In young children, physical activity is observed for the
most part during play an integral part of children’s social-emotional and cognitive
development.
“Exercise is leisure time physical activity conducted with the intention of developing
physical fitness.” It is considered a subset of physical activity which is planned,
structured, repetitive, and conducted to with the goal of achieving physical fitness.
Physical fitness is the outcome of participating in physical activity, including exercise
which leads to “improved body composition, muscle strength, endurance and/or
flexibility, and cardio-respiratory fitness.”
Developmental screening assessment tools, i.e., Early Learning Accomplishment Profile
(E-LAP), used in early childhood programs and clinical examination of preschool age children in
primary care settings are performed with the intention of identifying healthy growth and
development (23). A caregiver’s comprehension of normal healthy development is essential in
implementing and modifying environments to promote the right balance of activities for healthy
SYSTEMATIC REVIEW OF THE LITERATURE
Rationale
The purpose for conducting this systematic review of the literature was to identify
existing evidence-based strategies in the prevention of overweight infants, toddlers and preschool
children. The articles were reviewed in the context of the benefits of play in increasing moderate
to vigorous physical activity in children age five or younger. The process included formulating a
series of questions to guide the review of the literature, gathering and classifying the research
studies, critically appraising each article, and summarizing the evidence. The following research
questions were posed as a framework to conduct the review of the articles:
1. Is physical activity an effective means of preventing and treating childhood obesity?
2. What impact does incorporating physical activity in early childhood development
programs have on cognitive development?
3. What assessment tools are available to assess young children’s physical activity
levels in child care settings?
4. What influences physical activity levels in early childhood?
Methods
The literature review began on July 2009 and concluded in January 2010 with searches in
PubMed and CINAHL. The search criteria included: publication date January 2000 through
December 2009, English language, and children (infants through 5 years of age). The Medical
Subject Headings Terms (MeSH) were modified to include health promotion, well-being, active
living, physical activity, exercise, and childhood in order to expand the number of qualitative and
quantitative research projects conducted in this population. Additional key words included:
management programs. The exclusion criteria were: any disability, Prader Willi syndrome and
diabetes (Figure 1). The term ―motor skills‖ was not included, since it is associated with
developmental concerns not childhood overweight.
Findings
The initial database search in PubMed began July 2009 and concluded in January 2010
yielded 4135 studies and CINAHL 7. Of those, 127 were available and only 37 met all of the
aforementioned criteria (Figure 1). The most rigorous scientific method preferred is randomized
clinical trials (RCT) over other sampling methods. Searches conducted in PsycHE yielded no
results matching the review search criteria.
Figure 1 – Results of Systematic Literature Review
A total of 37 articles were identified and used for this review. Five (14%) of the selected
articles were systematic reviews and meta-analyses, but were included because of the large
of age (22, 25-28). Due to the small number of studies limited to this age group, 11 articles
(30%) were reviewed that also included children over five years of age (25-35). All of the studies
discussed their limitations which were mostly related to sampling methods, sample size, short
interventions, short follow-ups, insufficient data, etc.
Many studies on the target population (birth to five years) included adults, since
caregivers, teachers and parents have a significant influence on children’s development and
support for physical activity. Of those reviewed, 18 studies (49%) focused on adults to identify
the challenges of increasing MVPA in the homes, WIC clinics and child care settings (2,15,16,
22,-23, 25-29, 32, 35-44). Adults participated in focus groups, interviews, surveys, nutrition
education and weight management interventions; provided demographic data; and monitored
mechanical devices, such as accelerometers worn by children.
According to Issel there are three salient characteristics of an ideal design: (1) a control
group comparable to the experimental group, (2) baseline and intervention measurements of
outcome variables, and (3) minimal bias affecting generalizations to other populations or the
ability to determine interventions effectiveness (45). Ranking studies using these criteria may be
challenging due to the limited number of well controlled trials that meet all these elements.
Randomized controlled trials exemplify the gold standard for research design, which typically
meet most of these criteria. The articles included in this review were categorized according to the
type of study design described by the authors and were grouped following four major categories
(Tables 1-4). Several studies did not match the stringent definition for types of design.
Nonetheless, these categories helped classify a wide range of studies, and identify the strength of
the conclusion which is highly related to the strength of the study design. Table 1 lists the
observational studies, Table 3 contains qualitative studies with focus groups and interviews and
Table 4 presents systematic reviews or meta-analyses. The tables summarize the sample sizes,
age for the target sample, study timeline, demographics/location, physical activity measures,
diet/weight status, environmental assessments and brief results.
A total of 10 articles listed on Table 1 were identified as quantitative (27%),
quasi-experimental (n= 3), longitudinal (n= 3) or randomized control trials (n=4). Most of the articles
under this category concentrated more on the influences of MVPA, such as demographics,
parents and included more assessments of diet and weight status in children. These articles
reaffirm what previous research has shown in other age groups regarding the influences of
parents on physical activity and the amount of screen time. There were only two longitudinal
studies included in the systematic review listed in Table 1. One of these includes second and
third generation cohorts from the Framingham Children’s Study conducted by Moore et al. This
study began in 1987, however the article is dated 2003. The other longitudinal study by Lumeng
et al associated behavioral problems with screen time in excess of two hours and for children 36
months of age higher risk of overweight simply by being in a room with a television on in excess
of two hours (18, 35). One specific article made reference to the effect that prematurity has on
levels of physical activity (49).
Table 2 summarizes a total of 17 articles considered qualitative and observational studies.
One of the articles was a review of child care and family child care regulations, 14 were
observational with four also considered cross-sectional. Except for the review article, all were
conducted in southern states. Nine of the articles on Table 2 assessed the validity of
observational instruments in identifying the contextual data for evaluating MVPA in young
validated the use of two instruments, an Observational System for Recording Physical Activity in
Preschoolers (OSRAC preschool and home version) and the second Nutrition and Physical
Activity Self-Assessment for Child Care (NAP SACC) (16, 23,37,43,48,51-53). Six studies used mechanical devices, i.e., accelerometer or pedometer to evaluate MVPA (15,32,39,43,47,49). In
two studies the revised Early Childhood Environment Rating Scale (ECERS-R) and the
Environmental and the Policy Assessment and Observation Instrument (EPAO) were the tools
utilized to evaluate environmental barriers to children’s physical activity levels (23, 49). These
assessment and observational tools were validated for use in the target population and should aid
future research in developing evidence-based strategies. Only one study actually measured the
activity level of a three-month old baby. The researcher concluded that caregiver’s handling of
an infant is an important element along when measuring infant’s physical activity levels (39).
The majority of the studies in Table 2 were conducted in faith-based, Head Start (federally
funded) and private child care centers.
Six qualitative studies conducted using focus groups or interviews are listed on Table 3.
These studies highlight parent’s perceived barriers to physical activity, identifying their children
as overweight, lack of control and to getting adequate nutrition information in primary care
settings. Except for one study conducted in the mid-west (Colorado), the remaining five were
conducted in the northeast (32,36,40,42,44,55).
A total of three systematic reviews and a meta-analysis are summarized on Table 4. The
reviews included studies that extended as far back as 1960 to 2005. Two of the articles indicated
the inclusion of international studies (27,28). The most salient points from the meta-analyses was
that trials lasting over six months reported lower sedentary levels, lower BMIs and notable
validity review reported evaluation difficulties due to inconsistent and insufficient information
on intervention and control participants, outcome measures, as well as trial adaptations (27).
In general there were other notable data omissions in the articles. Not all of the studies
reported mean ages of the target population. The youngest age included in a study was three
months old with an average range from one to 19 years of age; with 5 (14%) studies reporting
estimated mean ages between 8 to 11 (see Tables 1-4). Four studies (11%) used the term
―preschool‖ without specifying the age of the target population; typically that term is defined as
children between the ages of three and six (22,40,42,51). Eight studies reported the predominant
group was of Hispanics or Latino origin, eight African Americans, five White and 22 (59%) did
not include demographic information. Four specifically chose WIC participants who may be low
income or have poor nutritional status; three studies indicated their target group was of low
social economic status (SES), however 90% of the children who attend Head Start programs are
below the federal poverty level and 9 studies were conducted in Head Start centers. Low income
and minorities were well represented in this systematic review.
Another issue worth noting is that MVPA levels outdoors is affected by the seasons
whether at home or in child care settings. There were 16 (43%) studies that did not indicate what
time of year their observations and/or interventions were conducted (29,32,37,39,40-43,47-50).
Knowing the time of year when an assessment or observation is implemented is important
background data required to evaluate interventions.
Weight status was not part of the data collection in 16 (43%) of the studies (16,22,
23,28,36-40,42,51-53,62). Dietary recalls and/or food frequency was obtained in only 6 (16%) of
the interventions and one of these was self-reported. Calorie restriction is not a recommended
physical activity and reducing screen time. On the other hand, food choices in young children
should include a wide variety of nutrient rich foods, in age appropriate quantities, and with
limited amounts of the so-called empty calories such as those rich in sugars and fat. Weight
measurements will help identify if the children were are at risk for overweight or obesity. Dietary
recalls or food frequencies are important in evaluating the evidence behind the selected strategies
in the prevention of overweight and obesity in young children.
Only two studies utilized geographic information systems, an objective measure
assessing built environments facilitation of physical activity (25, 34). Last of all, 17 studies
(46%) were conducted in private, faith-based child care and Head Start, a federally funded child
development program (2,15,16,23,38,40,43,46-54,56). Nine (24%) studies surveyed home and
community environments to assess physical activity and screen time. Family child care (FCC)
which represents a significant number of children was not represented in any of the studies. This
alternative day care option is used by many families; they participate in child nutrition programs
and are licensed when they serve more than 5 children. Future interventions need to engage
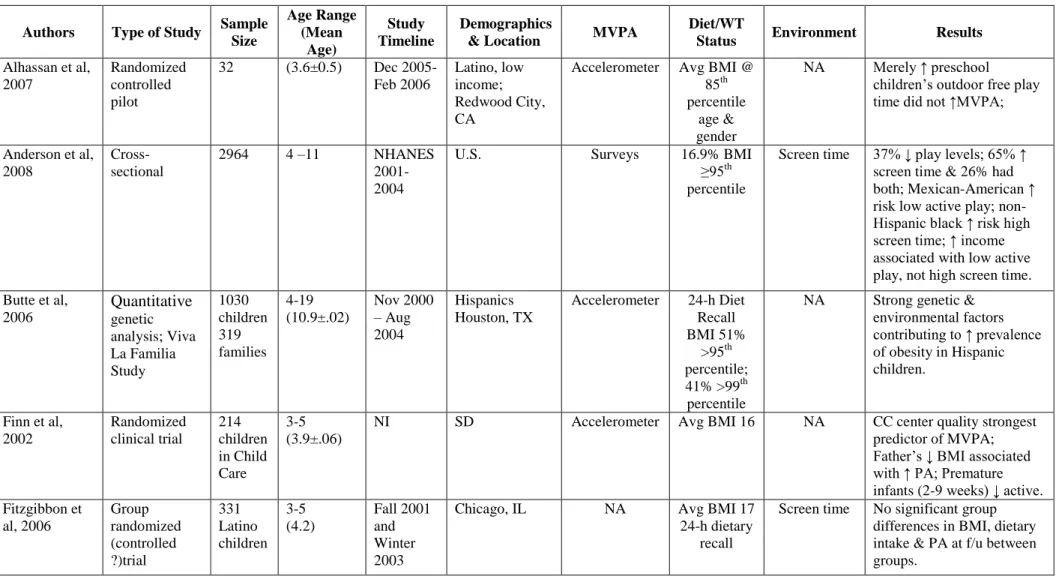
Table 1 – Summary of quantitative studies, quasi-experimental and randomized controlled trials assessing benefits of play in increasing moderate to vigorous physical activity (MVPA) in children (birth to 5 years), 2010.
Authors Type of Study Sample Size Age Range (Mean Age) Study Timeline Demographics
& Location MVPA
Diet/WT
Status Environment Results
Alhassan et al, 2007
Randomized controlled pilot
32 (3.6±0.5) Dec 2005- Feb 2006
Latino, low income; Redwood City, CA
Accelerometer Avg BMI @ 85th percentile
age & gender
NA Merely ↑ preschool children’s outdoor free play time did not ↑MVPA;
Anderson et al, 2008
Cross-sectional
2964 4 –11 NHANES 2001-2004
U.S. Surveys 16.9% BMI
≥95th percentile
Screen time 37% ↓ play levels; 65% ↑ screen time & 26% had both; Mexican-American ↑ risk low active play; non-Hispanic black ↑ risk high screen time; ↑ income associated with low active play, not high screen time. Butte et al,
2006 Quantitative genetic analysis; Viva La Familia Study 1030 children 319 families 4-19 (10.9±.02) Nov 2000 – Aug 2004 Hispanics Houston, TX
Accelerometer 24-h Diet Recall BMI 51%
>95th percentile; 41% >99th percentile
NA Strong genetic & environmental factors contributing to ↑ prevalence of obesity in Hispanic children.
Finn et al, 2002 Randomized clinical trial 214 children in Child Care 3-5 (3.9±.06)
NI SD Accelerometer Avg BMI 16 NA CC center quality strongest predictor of MVPA; Father’s ↓ BMI associated with ↑ PA; Premature infants (2-9 weeks) ↓ active. Fitzgibbon et al, 2006 Group randomized (controlled ?)trial 331 Latino children 3-5 (4.2) Fall 2001 and Winter 2003
Chicago, IL NA Avg BMI 17 24-h dietary
recall
Authors Type of Study Sample Size Age Range (Mean Age) Study Timeline Demographics
& Location MVPA
Diet/WT
Status Environment Results
Kaphingst et at, 2009 Quantitative content analysis 51 states
3-5 2006 NA
*State Child Care Regulations
State CC regulations vary widely regarding meals, physical activity & screen time.
Klohe-Lehman et al, 2007
Convenience sample; one-group, pre-test/post-test study 91 mothers 87 children 1-3 (2.1)
NI African American Hispanic White Austin, TX Pedometers (mothers) TBAQ+
<1 yo @69th percentile for WT/HT;
2-3 yo Avg BMI @ 62nd percentile for WT/HT; 24-h dietary
recalls
NA PA levels of both mother & child ↑overall but not in mother-child pairs; Boys >active than girls;1 year-olds & overweight at risk children ↑ PA.
Lumeng et al, 2006 Cross-sectional longitudinal analysis, random sampling 1016 children
3-4.5 Families recruited in 1991
10 U.S. cities: AK, CA, KS, NC, MA, VA, WA, WI, Pittsburgh & Philadelphia, PA;
NA 5.5% BMI >95th percentile
Screen time; HOME Scale
At age 36 mos being in a room awake with a TV on for >2 hrs associated with ↑ risk of overweight; children watching >2 hrs screen time had ↑behavior problems; Mothers with >depressive symptoms & less stimulating home environments↑ risk of overweight; At 54 mos. maternal education most powerful predictor of overweight risk. Moore et al,
2003 Longitudinal data analysis Framingham Children’s Study 103 children & their parents 4-11 (4) 1987 to 1995
MS Accelerometer Skinfold Avg BMI
@16.2 3-day diet
records
Screen time Preschool children PA levels predict total body fat in early adolescent boys & girls. Roemmich et al, 2006 Cross-sectional analysis longitudinal study
59 4-7 (6) Summer 2003 – Winter 2004 Erie County, NY
Accelerometer Avg BMI @19
GIS Screen time
Abbreviations: NI: Not Indicated NA: Not Applicable
*Reviewed this data in the context of state child care regulations BMI: Body Mass Index
TBAQ: Toddler Behavior Assessment Questionnaire
HOME: Home Observation for Measurement of the Environment GIS: Geographic Information System
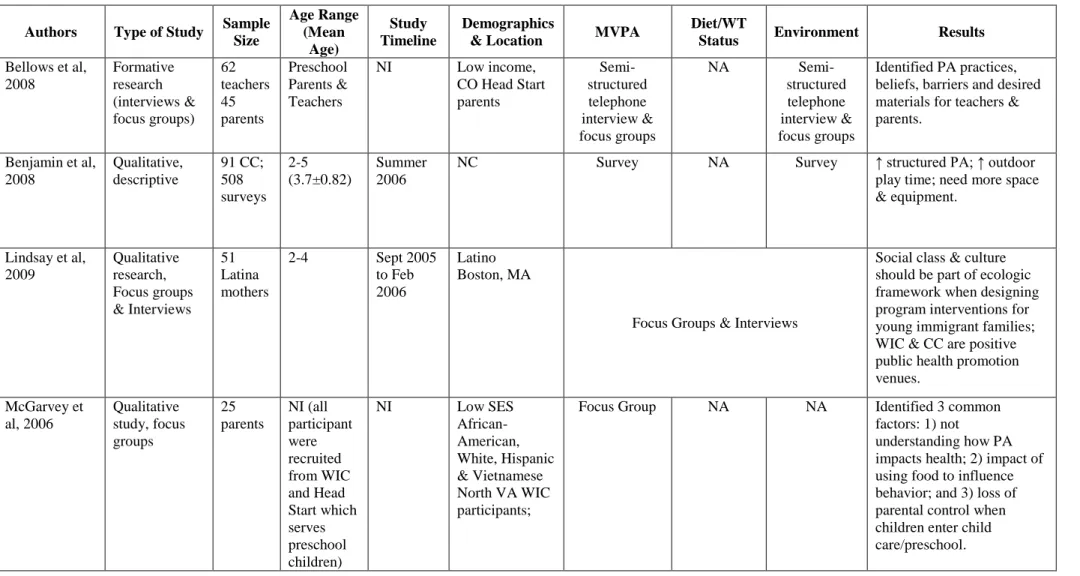
Table 2 – Summary of qualitative and observational studies assessing benefits of play in increasing moderate to vigorous physical activity (MVPA) in children (birth to 5 years), 2010.
Authors Type of Study Sample Size Age Range(Me an Age) Study Timeline Demographics
& Location MVPA
Diet/WT
Status Environment Results
Benjamin et al, 2008
Review 50 US States & DC
Preschool Jan – Aug 2007
U.S. NA NA Screen time Few regulations related to obesity in CC centers & FCC homes.
Brown et al, 2006
Observational 3 children
3-5 Spring & Fall 2006
SC OSRAC-P* NA OSRAC-P* OSRAC-p allows for
improved uniformed assessment of social & nonsocial factors related to children’s PA levels in CC, home & community environments. Brown et al,
2009 Quasi-experimental, observational 5 children 6 teachers
4 Summer
& Fall 2006; Fall 2007
Columbia, SC OSRAP* NA OSRAP* Preschool children not meeting daily MVPA goals in CC settings; Need bouts of 5 min intentional activity prompts to ↑MVPA. Brown et al,
2009
Observational, cross-sectional
476 children
3-5 2005-2007
SC OSRAC-P* NA OSRAC-P* 87% of observations
recorded indoors;
Authors Type of Study Sample Size Age Range(Me an Age) Study Timeline Demographics
& Location MVPA
Diet/WT
Status Environment Results
equipment; 26% ball & object use; 10% socio-dramatic props & 14% wheel toys.
Butte et al, 2006 Cross-sectional assessment 897 children 4-19 (10.8±3.8) Nov 2000 – Aug 2004 Hispanics Houston, TX
Accelerometer Overweight Avg BMI @30; Non-overweight Avg BMI @19.7
Survey 87% of 4 to 8 yr olds had 60 min MVPA daily;
Types & levels of PA ↓ with age & by gender: ↑boys ↓ girls & ↓ with higher BMI; ↑screen time associated with ↑BMI.
Dowda et al, 2009 Cross-sectional observational Interviews 299 children 3-5 (4)
NI SC Accelerometer Avg BMI
@16.6
ECERS-R^ Preschool children spent > time in MVPA in centers with ↑ ECERS score; MVPA ↑ in CC centers with less fixed & > portable equipment. Drummond et al, 2009 Pilot Intervention 1876 children
Preschool 2005-2008
Yuma County, AZ
NAP SACC** NA NAPSACC** Training and use of NAPSACC ↑ nutrition & PA best practices in CC centers. McCormick et al, 2008 Observation, two-group; retrospective, matched-control 48 children 3.6-14/ (10.1±2.6) June 2007 to December 2007
Galveston, TX NA Avg BMI @25
NA Community based weight management program including nutrition education, PA, & gift card incentives, have positive impact on ↓ weight status. McIver et al,
2009
Observation 13 families with children
3-6/ (4.5±0.9)
NI White, African-American and Asian/Pacific Islander SC OSRAC-P OSRAC-H
NA OSRAC-P
OSRAC-H
Authors Type of Study Sample Size Age Range(Me an Age) Study Timeline Demographics
& Location MVPA
Diet/WT
Status Environment Results
McWilliams et al, 2009 Observation, convenience sample 96 CC centers
3-5 Fall 2005 NC NAP SACC* NA EPAO NAP SACC is supported by
existing guidelines, research evidence & expert review favoring opportunities to be active, i.e., portable play equipment, varied fixed equipment, ↓ sedentary opportunities; MVPA ↑ with environments & policies promoting PA along with staff training on integrating PA in preschool settings. Pate et al,
2008 Observational study; stratified random selection 438 children 3-5 (4.2±0.7)
NI Columbia, SC Black & White
OSRAC-P Avg BMI @16.5
OSRAC-P Children in child care engaged in MVPA <3% of time during observations & were sedentary 80% of the time; Boys >likely than girls to be active; 3-year old boys >than 4-5 year old boys; child care environments impact PA levels. Pate et al,
2004 Observational study 247 children 3-5 (4)
NI Columbia, SC Black & White
Accelerometer BMI NI Child care environments stronger predictor than personal demographics on PA levels; Black children had ↑levels of VPA, boys >MVPA than girls. Topp et al,
2009 Observational study, single group, pre-test/post-test 33 children and their parents 5-10 (8±1.82)
NI African American KY
Fitness testing Avg BMI @21 Hip-to-waist
ratios Skinfolds; FF Interview
NA The pilot study improved cardiovascular fitness levels & improved muscle mass & dietary habits.
Trost et al, 2003 Cross-sectional study 245 children and their 3-5 (4)
NI 60% African American Columbia, SC
OSRAP Accelerometer
Overweight BMI @ 23;
Non-overweight
Authors Type of Study Sample Size Age Range(Me an Age) Study Timeline Demographics
& Location MVPA
Diet/WT
Status Environment Results
parents BMI@ 17.8 Overweight children 3-6
times> likely to have at least one obese parent/ caregiver; parental influences of PA was not a strong indicator of child’s weight status. Williams et al,
2009 Pilot observational Study 270 children and 32 teachers
3-5(4.6) Spring 2003
74% Hispanic NM
Teacher surveys
NA NA The motor skill curriculum increased PA to 47 minutes/week; Teachers reported activities DAP, children enjoyed activities & motor skills appeared to improve;
Williams et al, 2008 Observational study 198 children 3-4 (4.2±.05) Aug 2004 to Jan 2006 54% African-American SC Accelerometer CHAMPS CMSP Avg BMI @16.2
NA Children spent 55% of day (7 hrs) in sedentary
behaviors & 12% of day (90 min) in MVPA; Children with ↑motor skills spent > time in MVPA.
Worobey et al, 2009 Observational study 1 baby & mother
3 mo old baby & mother
NI NI Motionlogger NA NA PA measure for infants under 6 months of age need to include monitoring of caregiver’s handling of the infant and also measure their activity levels. Abbreviations - OSRAP: Observational System for Recording Physical Activity in Preschoolers; OSRAC-P: Observational System for Recording Physical Activity in
Children-Preschool Version; OSRAC-H: Observational System for Recording Physical Activity in Children-Home Version NAP SACC: Nutrition and Physical Activity Self-Assessment for Child Care
ECERS-R: Early Childhood Environment Rating Scale-Revised
Table 3 – Summary of qualitative studies with focus groups and interviews assessing benefits of play in increasing moderate to vigorous physical activity (MVPA) in children (birth to 5 years), 2010.
Authors Type of Study Sample Size Age Range (Mean Age) Study Timeline Demographics
& Location MVPA
Diet/WT
Status Environment Results
Bellows et al, 2008 Formative research (interviews & focus groups) 62 teachers 45 parents Preschool Parents & Teachers
NI Low income, CO Head Start parents Semi-structured telephone interview & focus groups
NA
Semi-structured telephone interview & focus groups
Identified PA practices, beliefs, barriers and desired materials for teachers & parents.
Benjamin et al, 2008 Qualitative, descriptive 91 CC; 508 surveys 2-5 (3.7±0.82) Summer 2006
NC Survey NA Survey ↑ structured PA; ↑ outdoor
play time; need more space & equipment.
Lindsay et al, 2009 Qualitative research, Focus groups & Interviews 51 Latina mothers
2-4 Sept 2005 to Feb 2006
Latino Boston, MA
Focus Groups & Interviews
Social class & culture should be part of ecologic framework when designing program interventions for young immigrant families; WIC & CC are positive public health promotion venues. McGarvey et al, 2006 Qualitative study, focus groups 25 parents NI (all participant were recruited from WIC and Head Start which serves preschool children)
NI Low SES
African- American, White, Hispanic & Vietnamese North VA WIC participants;
Focus Group NA NA Identified 3 common factors: 1) not
Authors Type of Study Sample Size Age Range (Mean Age) Study Timeline Demographics
& Location MVPA
Diet/WT
Status Environment Results
Sherman et al, 2001 Qualitative study, focus groups 18 children and their mothers
26 to 56 month old/ 44 months old
Nov-Dec 1999
Black and non-Hispanic White WIC Clinic Cincinnati, OH
Focus Group 83% BMI >95th percentile
NA 10 major themes including growth charts do not determine health; consider children overweight if they are inactive or lazy or teased about their weight or ate well; mother’s beliefs determine perception of their child’s weight status; home life influences eating & activity habits; mothers report difficulty controlling child’s eating habits; food used as a reward. Taveras et al,
2008 Cross-sectional survey, telephone interview 446 parents & their children 2-12 (7±2.8)
NI Boston, MA Questionnaire Avg BMI @ 94th percentile
Table 4 – Summary of systematic reviews assessing benefits of play in increasing moderate to vigorous physical activity (MVPA) in children (birth to 5 years), 2010.
Authors Type of Study Sample Size Age Range Mean Age Study Timeline Demographics
& Location MVPA
Diet/WT
Status Environment Results Dunton et al,
2009
Systematic review
15 articles
3-18 Reviews published after 1/1/06
NA NA BMI GIS
Parent & child self-reports
Obesity & environment associations differ by gender, age, SES & population density. Kamath et al,
2008
Systematic review of RCT & meta-analysis
34 RCTs
2-18 Database inception to Feb 2006
NA Self Reported
or Accelerometer Self Reported or Dietary Recall
NA Trials with young children ↓ sedentary activity (SA) > than in adolescents; trials lasting >6 mos had ↓SA levels & ↓ BMI. Klesges et al,
2008
External validity review
19 RCTs
0-18 years 1980-2004
US & International
NA BMI NA Studies lacked
comprehensive description of eligible & non
participants; lacked reporting of contextual factors in controlled intervention trials, cost estimates, impact measures & adaptations to
interventions. Pugliese et al,
2007 Meta-analysis review (30 studies) 23,310 (aggreg ate sample size)
2-18 1960-2005 AZ (Studies included U.S. and non-U.S. countries) Self-Report Mechanical/ electrical device
Discussion
This systematic review of the literature was successful in identifying studies assessing
strategies for increasing moderate to vigorous physical activity in the prevention of overweight
infants, toddlers and preschool children. Table 5 presents a list containing the citations used to
answer the proposed research questions in this paper. The first question referred to the
effectiveness of increasing physical activity as a means to prevent and treat childhood obesity.
Of the 37 journal articles included in this review, a solitary study conducted by Moore, et al
concluded that physical activity levels in early childhood predicts future body fat (35). However,
23 (65%) studies identified physical activity as a preventive measure and as a successful weight
loss intervention when combined with nutrition education, counseling and long term trials
involving entire families (29, 31).
The second question referred to the impact of physical activity on cognitive growth in
child development programs. Eight (22%) of the articles reviewed, demonstrated a positive effect
on language development, dramatic play and enhancing comprehension of preschool learning
concepts. Integrating physical activity also promotes socialization, as well as healthy gross and
fine motor development required for building effective cognition.
The third question was identifying the assessment tools available to evaluate young
children’s physical activity levels in child care settings. Validity studies were conducted on two
observational instruments, OSRAC-P and NAP SACC, both of which promise to be helpful tools
in obtaining the contextual data required to more aptly describe the types of activities influencing
sedentary and MVPA in child care settings and homes. This data is needed to support training
requirements for caregivers/parents in support of young children’s physical activity levels
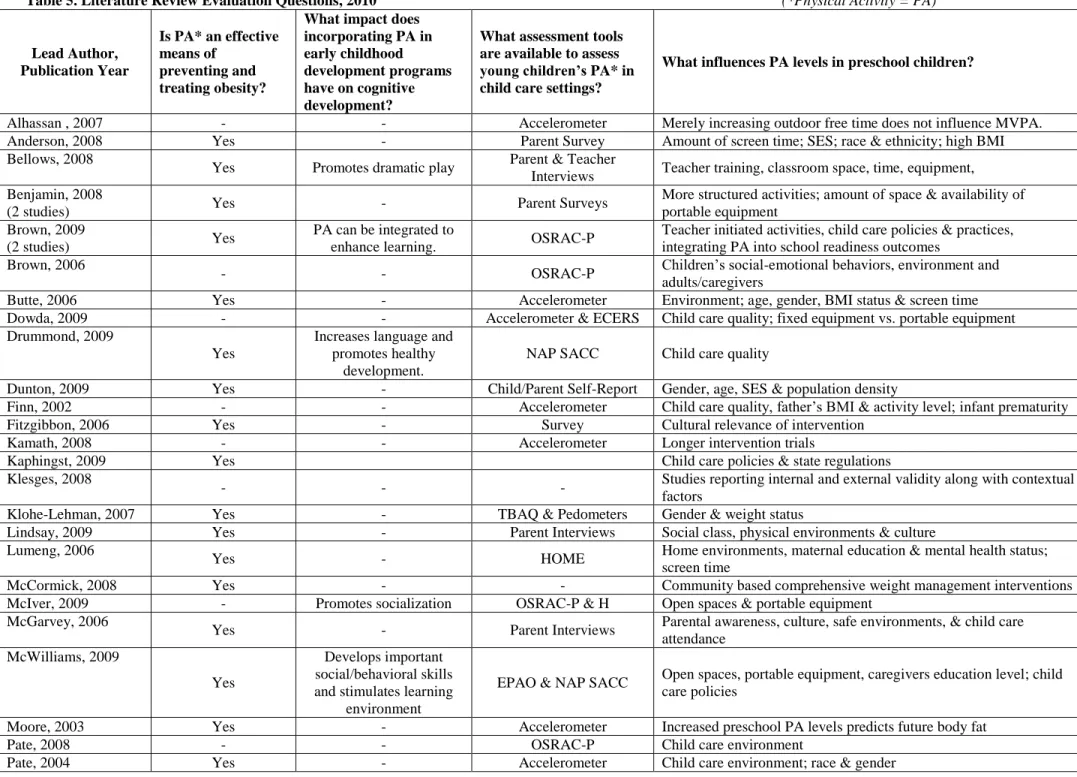
Table 5. Literature Review Evaluation Questions, 2010 (*Physical Activity = PA)
Lead Author, Publication Year
Is PA* an effective means of
preventing and treating obesity?
What impact does incorporating PA in early childhood development programs have on cognitive development?
What assessment tools are available to assess young children’s PA* in child care settings?
What influences PA levels in preschool children?
Alhassan , 2007 - - Accelerometer Merely increasing outdoor free time does not influence MVPA. Anderson, 2008 Yes - Parent Survey Amount of screen time; SES; race & ethnicity; high BMI Bellows, 2008
Yes Promotes dramatic play Parent & Teacher
Interviews Teacher training, classroom space, time, equipment, Benjamin, 2008
(2 studies) Yes - Parent Surveys
More structured activities; amount of space & availability of portable equipment
Brown, 2009
(2 studies) Yes
PA can be integrated to
enhance learning. OSRAC-P
Teacher initiated activities, child care policies & practices, integrating PA into school readiness outcomes
Brown, 2006
- - OSRAC-P Children’s social-emotional behaviors, environment and adults/caregivers
Butte, 2006 Yes - Accelerometer Environment; age, gender, BMI status & screen time Dowda, 2009 - - Accelerometer & ECERS Child care quality; fixed equipment vs. portable equipment Drummond, 2009
Yes
Increases language and promotes healthy
development.
NAP SACC Child care quality
Dunton, 2009 Yes - Child/Parent Self-Report Gender, age, SES & population density
Finn, 2002 - - Accelerometer Child care quality, father’s BMI & activity level; infant prematurity
Fitzgibbon, 2006 Yes - Survey Cultural relevance of intervention
Kamath, 2008 - - Accelerometer Longer intervention trials
Kaphingst, 2009 Yes Child care policies & state regulations
Klesges, 2008
- - - Studies reporting internal and external validity along with contextual factors
Klohe-Lehman, 2007 Yes - TBAQ & Pedometers Gender & weight status
Lindsay, 2009 Yes - Parent Interviews Social class, physical environments & culture Lumeng, 2006
Yes - HOME Home environments, maternal education & mental health status; screen time
McCormick, 2008 Yes - - Community based comprehensive weight management interventions
McIver, 2009 - Promotes socialization OSRAC-P & H Open spaces & portable equipment McGarvey, 2006
Yes - Parent Interviews Parental awareness, culture, safe environments, & child care attendance
McWilliams, 2009
Yes
Develops important social/behavioral skills and stimulates learning
environment
EPAO & NAP SACC Open spaces, portable equipment, caregivers education level; child care policies
Moore, 2003 Yes - Accelerometer Increased preschool PA levels predicts future body fat
Pate, 2008 - - OSRAC-P Child care environment
Lead Author, Publication Year
Is PA* an effective means of
preventing and treating obesity?
What impact does incorporating PA in early childhood development programs have on cognitive development?
What assessment tools are available to assess young children’s PA* in child care settings?
What influences PA levels in preschool children?
Pugliese, 2007 - - Accelerometer Parental socialization behavior
Roemmich, 2006 Yes - Accelerometer Built Environment; proximity to parks
Sherman, 2001 Yes - Parent Interviews Parental awareness & behavior; weight status; heredity Taveras, 2008
Yes - Parent Interviews Parent’s education & weight status; time spent with primary care physicians & their ability or time to counsel on PA
Topp, 2009
Yes
Increased nutrition education and dietary
habits
Fitness testing Community based comprehensive culturally relevant weight management interventions
Trost, 2003 Yes - OSRAC-P Parent and child’s weight status; gender
Williams C, 2009
Yes
Promotes gross motor skill development; enhances comprehension
of preschool learning concepts
PA Surveys Motor skill development; teacher training
Williams HG, 2008
Yes Promotes locomotor and object control skills
Accelerometer &
CHAMPS CMSP; Motor skill performance
The aforementioned instruments and accelerometers are currently the most effective tools to
assess activities in child care settings. The ECERS, EPAO, HOME and TBAQ instruments have
also been validated for use in identifying the environmental and social-ecological factors
influencing children’s MVPA (18,49,23,41).
The last question examined the factors influencing physical activity levels in early
childhood. Culturally adapting programs to meet the needs of the target population is one of the
primary features of a successful intervention (29,30,42,54). Similar to other health behaviors,
parental educational and lifestyles impact the physical activity levels of young children.
Interventions that take into account levels of acculturation of minorities and include culturally
relevant strategies are more effective (55). Moreover, studies have also demonstrated a
correlation between built environments, space, availability of supplies i.e., balls, rope, etc.,
amount of time spent outdoors, reduced physical activity and childhood obesity with older
children and adolescents (21, 25, 56).
Implications for Further Research and Policy
The fine tuning and development of additional physical activity assessment tools for
preschool children should hasten the support for continued research. A total of 7 reviews
included were cross-sectional studies which do not allow for cause and effect conclusions. Future
studies should be longitudinal and prospective, the preferred methods in determining
evidence-based strategies and stratified to include a representative number of preschool children. The
systematic literature review identified assessment and observational instruments developed under
rigorous scrutiny which will help capture contextual data. This information is needed to identify
which interventions are the most cost-effective and best supports MVPA in young children (55).
and settings that are most suitable for promoting physical activity in young children. These tools
should facilitate further studies essential for policy makers to develop consistent physical activity
and screen time regulations and reliable quality child care indicators.
Researchers recognized the complex social ecological framework and determinants of
health challenging young children meeting the NASPE daily guidelines of 60 minutes structured
and 60 minutes unstructured physical activity. The most common factors negatively influencing
children’s physical activity levels are: gender, age, social-economic status, race, ethnicity,
parental/caregiver’s weight status, infant prematurity, maternal education and mental health and
extended family health beliefs. Moreover, the findings are consistent with other researchers,
Baranowski et al, Franzini et al, Roberts, and Epstein, et al related to built environments,
topography, neighborhoods, quality of child care settings, availability of fixed vs. portable
equipment, teacher’s physical activity training and enthusiasm also influence a child’s
confidence and safety in their motor skill development (56-59). Nevertheless, efforts to maintain
a healthy weight should start early in childhood and continue throughout adulthood, as this is
likely to be more successful than efforts to lose substantial amounts of weight and maintain
weight loss once obesity is established. The future health care and public health costs associated
with the co-morbidities stemming from childhood overweight/obesity, i.e., high blood pressure,
high cholesterol, type 2 diabetes, heart disease, stroke, gallbladder disease, arthritis, sleep
disturbances, and certain types of cancers threatens to overburden already limited resources (4).
Although the Healthy People 2020 goals have yet to be established, increasing physical
activity levels is a promising public health policy which should reduce the concomitant risks of
the childhood overweight/obesity epidemic (60). The proposed Healthy People 2020 goals
currently under evaluation include objectives related to screen time, physical activity, as well as
the research cited in this systematic literature review will garner the necessary support for their
inclusion to expand data collection and evidence based strategies to children of younger ages.
Conclusions
At the start of this review, state child care regulators and policy makers had yet to
capitalize on the existing research cited herein. Some states are on their way to adopting
consistent regulations. One example is the Texans Care for Children Policy Briefing Paper which
outlines their support for physical activity levels and screen time restrictions for children birth to
five years of age in child care settings (61). Even though only one study in the U.S. correlated
future body fat to physical activity in young children, given the childhood obesity epidemic,
further U.S. studies are desperately needed. This is no more evident than in minority populations
(American Indian, Hispanics and African-Americans) who consistently demonstrate multiple risk
factors associated with existing health disparities.
This systematic literature review clearly establishes the need for additional carefully
designed, scientifically rigorous research, preferably RCTs, to initiate proactive approaches to
primary prevention strategies to combat childhood obesity. This is evidenced by the lack of data
available for this age group and the ability of this review to ascertain the impact of incorporating
physical activity in children’s cognitive development. Expanding search criteria to include
cognition and physical activity might have yielded additional evidence. In reviewing these
findings several important limitations need to be considered. There were a limited number of
randomized controlled trials, the majority of the studies used convenience sampling methods
which affects the ability to generalize their findings to other populations or whether to
conclusively state that the interventions made a difference in the physical activity levels of young
children (45). According to Pugliese et al, convenience sampling is inclined to show larger effect
review was that it only provides a descriptive summary of the findings instead of a
meta-analysis. Finally, studies conducted abroad or including children with disabilities or conditions
which would preclude physical activity were excluded.
The recent emphasis in early childhood development settings on school readiness
requires reframing to integrate physical activity into children’s learning outcomes. Promoting
children’s health and well being changes the focus to enhancements that develop language,
self-regulation, motor skill competency and socialization (62). This positive approach is more readily
understood by parents who do not agree with the conventional methods of allied health
professionals descriptions of causes and consequences of childhood obesity in their very young
References
1. Barlow SE; Expert Committee. Expert committee recommendations regarding the prevention, assessment, and treatment of child and adolescent overweight and obesity: summary report. Pediatrics. 2007 Dec;120 Suppl 4:S164-92.
2. Kaphingst KM, Story M. Child care as an untapped setting for obesity prevention: state child care licensing regulations related to nutrition, physical activity, and media use for preschool-aged children in the United States. Prev Chronic Dis. 2009 Jan;6(1):A11. Epub 2008 Dec 15. http://www.cdc.gov/pcd/issues/2009/jan/07_0240.htm. Accessed 1/5/2009
3. Kim J, Peterson KE, Scanlon KS, Fitzmaurice GM, Must A, Oken E, Rifas-Shiman SL, Rich-Edwards JW, Gillman MW. Trends in Overweight from 1980 through 2001 among Preschool-Aged Children Enrolled in a Health Maintenance Organization. Obesity 14, 1107-1112 (30 June 2006). Brief Report.
4. 2000 CDC Growth Charts for the United States: Methods and Development. Vital and Health Statistics.Series 11, Number 246 May 2002
5. Morbidity and Mortality Weekly Report. July 24, 2009;58(28); 769-773.
6. U.S. Department of Health and Human Services. Healthy People 2010: Understanding and Improving Health. 2nd ed. Washington, DC: U.S. Government Printing Office, November 2000. http://www.healthypeople.gov/data/2010prog/focus19/2004fa19.htm accessed 1-23-2010
7. Nader PR, O’Brien M, Houts R, Bradley R, Belsky J, Crosnoe R, Friedman S, Mei Z, Susman EJ; National Institute of Child Health and Human Development Early Child Care Research Network. Pediatrics. 2006 Sepl118(3):e594-601. Erratum in: Pediatrics. 2006 Nov;118(5):2270.
8. Phillips D and Adams G. Child Care and Our Youngest Children The Future of Children, Vol. 11, No. 1, Caring for Infants and Toddlers (Spring - Summer, 2001), pp. 35-51 Published by: Princeton University Stable URL: http://www.jstor.org/stable/1602808).
9. America’s Children in Brief: Key National Indicators of Well-Being, 2008; www.childstats.gov/pdf/ac2008/ac_08.pdf Accessed 1/6/2010.
10.The Annie E. Casey Foundation (AECF). 2008 Kids Count Data Book State; Profiles of Child Well Being.
http://www.aecf.org/~/media/Pubs/Topics/Juvenile%20Justice/Detention%20Reform/200 8KIDSCOUNTDataBookStateProfilesofChildWell/AEC178%202008KCDB.pdf
11.Physical Activity Guidelines Advisory Committee. Physical Activity Guidelines Advisory Committee Report, 2008. Washington, DC: U.S. Department of Health and Human Services, 2008.
12.2008 Physical Activity Guidelines. Washington, DC: U.S. Department of Health and Human Services. ODPHP Publication No. U0036 October 2008
13.Morbidity and Mortality Weekly Report. July 24, 2009; 58(RR07):1-26.
14.National Association for Sport and Physical Education. Active Start: A Statement of Physical Activity Guidelines for Children Birth to Five Years. Reston, VA: National Association for Sport and Physical Education Publications, 2002.
15.Williams HG, Pfeiffer KA, O’Neill JR, Dowda M, McIver KL, Brown WH and Pate RR. Motor Skill Performance and Physical Activity in Preschool Children. Obesity (2008) 16, 1421–1426.
16.Brown WH, Pfeiffer KA, McIver KL, Dowda M, Addy CL, Pate RR. Social and Environmental Factors Associated With Preschoolers' Nonsedentary Physical Activity; Child Development 2009; 80(1): 45-58.
17.Dwyer G, Baur L, Higgs J, Hardy L. Promoting Children’s Health and Well-Being: Broadening the Therapy Perspective. Physical & Occupational Therapy in Pediatrics, 2009; 29(1):27-40.
18.Lumeng JC, Rahnama S, Appugliese D, Kaciroti N, Bradley RH. Television Exposure and Overweight Risk in Preschoolers. Arch Pediatr Adolesc Med. 2006;160:417-422.
19.Davison KK and Birch LL. Weight Status, Parent Reaction, and Self-Concept in Five-Year-Old Girls. Pediatrics 107.1 (Jan 2001): p46.
20.Faith MS, Leone MA, Ayers TS, Heo M, Pietrobelli A. Weight criticism during physical activity, coping skills, and reported physical activity in children. Pediatrics. 2002
Aug;110(2 Pt 1):e23.
21.Sallis J, Prochaska J, Taylor W. A review of correlates of physical activity of children and adolescents. Med Sci Sports Exercise. 2000;32:963-75.
22.Benjamin SE, Cradock A, Walker EM, Slining M, Gillman MW. Obesity prevention in child care: a review of U.S. state regulations. BMC Public Health. 2008 May 30;8:188.
23.McWilliams C, Ball SC Benjamin SE, Hales D, Vaughn A and Ward SD. Best-Practice Guidelines for Physical Activity at Child Care. Pediatrics 2009;124:1650-1659