Analysis of Disaster Preparedness and Response in North Carolina with a focus on the State Medical Assistance Team Program
By Daniel Willner
A Master’s Paper submitted to the faculty of the University of North Carolina at Chapel Hill in
partial fulfillment of the requirements for the degree of Master of Public Health in the Public
Health Leadership Program Chapel Hill
2012
______________________________________ Advisor ______________________________________
Date
______________________________________
Second Reader
i
Abstract
Hazards threaten North Carolina every day and have the potential to harm people and disrupt vital health care infrastructure. North Carolina developed the State Medical Assistance Team (SMAT) program to make the state better equipped to prepare for, and respond to, these potential hazards. The SMAT program is a combination of local, regional, state, and federal resources. The majority of funding is provided by the Hospital Preparedness Program (HPP), a federal grant program managed by the U.S. Department of Health and Human Services (HHS). Oversight and guidance are provided by the North Carolina Office of EMS (NC OEMS), North Carolina’s 8 Regional Advisory Committees (RAC), and the 8 Lead Trauma Centers. Team
personnel are volunteers with backgrounds in health care and various support areas and are employed by local EMS agencies and fire departments, counties, hospitals and health care organizations (HCO), private businesses, and nongovernmental organizations.
ii
Acknowledgements
Thank you to the SMAT personnel for thoughtfully and enthusiastically responding to my questionnaire, for donating your time and skills to the SMAT program, and for caring for your fellow citizens when they are in need. Thank you to Dr. Roy Alson, Debbie Gilbert, Dale Hill, Randy Hoffman, Sarah Seiler, Chris Starbuck, and Jessica Thompson for taking the time to speak with me. Your knowledge and enthusiasm about disaster preparedness and the SMAT program provided me with invaluable information and insights and pushed me to produce a paper that will, hopefully, be of some benefit to each of you. Thank you to the personnel at the North Carolina Office of EMS, in particular Mary Beth Skarote, for helping distribute the questionnaire. I know that the NC OEMS has many obligations and appreciate you taking the time to help me with the project.
iii
Table of Contents
Abstract . . . i
Acknowledgements . . . ii
Table of Contents . . . iii
List of Tables and Figures . . . iv
Introduction . . . 1
Methods . . . 12
Results . . . 17
Discussion . . . 28
Conclusion . . . 38
References . . . 40
Interviews . . . 42
Appendix A: Systematic Review . . . 43
Appendix B: Regional Advisory Committee (RAC) . . . 47
Appendix C: North Carolina Emergency Operations Plan (NC EOP) . . . 48
Appendix D: Federal Agencies, Laws & Regulations . . . 50
Appendix E: North Carolina Hazards, Laws, and Regulations . . . 54
Appendix F: Interview Protocol . . . 57
iv
List of Tables and Figures
1. Table 1. Missions, Capacity, and Capabilities of the 3 SMAT Tiers. . . 5
2. Table 2. Lead Trauma Center by RAC . . . 7
3. Table 3. Partial List of SMAT Responses. . . 11
4. Table 4. Demographic Characteristics. . . 18
5. Figure 1. Age Distribution of Respondents. . . 18
6. Figure 2. Education Level of Respondents. . . 18
7. Table 5. Affiliations . . . 19
8. Figure 3. SMAT Affiliation of Respondents . . . 19
9. Figure 4. RAC Affiliation of Respondents . . . 19
10. Table 6. Years of SMAT Experience . . . . . . 19
11. Figure 5. Total Years of SMAT Experience . . . 19
12. Table 7. Familiarity with Team Members by Years of SMAT Experience . . . 20
13. Figure 6. Linear Regression of Familiarity by Years of SMAT Experience . . . 20
14. Table 8. Method of Recruitment of Respondents . . . 21
15. Table 9. Employment Information . . . 21
16. Table 10. Continuous to Ordinal Value Conversion for Training Effectiveness . . . 22
17. Table 11. Training Effectiveness on Continuous Scale . . . 22
18. Table 12. Training Effectiveness by RAC (Mean±SD) . . . . . . . 23
19. Table 13. Training Frequency and Average Training Score . . . 23
20. Table 14. Frequency that Training is Offered by RAC . . . 23
21. Table 15. Frequency that Training is Should be Offered by RAC . . . 24
22. Table 16. Frequency that Training is Attended by RAC . . . 24
23. Table 17. Percentage of Respondents that have Deployed . . . 25
24. Table 18. Probability of Deployment by Years of Experience . . . 25
25. Table 19. Difference in the Probability of Deploying by Years of Experience . . . . 25
26. Table 20. Overall and Response-Specific Preparedness and Domains to Improve . 26 27. Table 21. Overall and Response-Specific Preparedness by RAC . . . 27
Introduction
This paper provides a comprehensive review and evaluation of the North Carolina State Medical Assistance Team (SMAT) program using qualitative and quantitative methods of data collection including primary and gray literature review, in-depth interviews with key program stakeholders, and a web-based survey of SMAT personnel. The primary goals of the paper are to describe the design and structure of the SMAT program, including funding, training and
response capacity and capabilities, and program management and oversight, and to highlight both strengths and weaknesses in order to identify opportunities for the program to enhance its ability to optimally deliver services in North Carolina.
Hazards and Disaster Planning
Hazards threaten individuals, communities, counties, states, and the nation every day. The Federal Emergency Management Agency (FEMA) defines a hazard as “an event or physical
condition that has the potential to cause fatalities, injuries, property damage, infrastructure damage, agricultural loss, damage to the environment, interruption of business, or other types of harm or loss” (1, pg. xxv). They are divided into 3 categories: natural hazards, such as
hurricanes, tornadoes, ice storms, and floods; technological, or human-caused, hazards such as fires, hazardous materials (HazMat) events, and nuclear accidents; and intentional hazards, such as war and terrorist events (2).
The severity of a potential hazard depends on the geography, population density, infrastructure, industries, and ability of the affected area to manage the hazard, as well as any secondary problems that develop as a result of the primary event. A hazard causes an emergency when it “challenges the ability to rapidly and effectively respond…” (2, pg. 17) and stretches, but
2
occurring in a location with a different set of characteristics, causes a disaster when it
overwhelms the capacity and/or capabilities of the local resources and stretches the population beyond their ability to effectively manage the effects of the hazard (3). Disasters that affect the health and well-being of individuals are also known as Catastrophic Health Events (CHE). Identifying hazards allows agencies to prepare for, and respond to, a potential event. This process is termed hazard vulnerability analysis (HVA). Once given hazards are identified, resources, including funding, equipment, training, and personnel, are allocated and an Emergency Operations Plan (EOP) is developed for a hazards based on the probability of occurrence and severity of the consequences. Individuals with experience in emergency management and an understanding of operational capabilities and emergency response are usually given this task.
HVAs can be integrated horizontally across other organizations and communities and vertically through expanding levels of oversight. For example, a health care organization (HCO) develops an HVA and shares it with the local government and affiliated HCOs in the community. The hospital also shares its HVA with a regional committee that oversees all of the HCOs and counties in its region. This committee develops a regional HVA based on information collected from the individual HCOs and its own regional assessment. Multiple regional HVAs are then shared with the state to develop a statewide HVA (2).
3
Safety (NC DPS), manages the statewide HVA and the North Carolina Emergency Operations Plan (NC EOP), which outlines disaster planning for identified hazards (Appendix C).
The field of Emergency Management deals with mitigation, preparedness, response, and recovery, the four stages of disaster planning. These stages form a theoretical circle. Mitigation occurs prior to a disaster and reduces “the loss of life and property… by avoiding or lessening the impact of a disaster” (4, pg. 11) through improving existing infrastructure and educating and preparing the community for potential hazards. Recovery occurs after a disaster has occurred and includes cleaning up, rebuilding, and restocking (4). These stages are temporally removed from a disaster, in contrast to preparedness and response, which occur before, during, and immediately following a disaster (3).
Disaster preparedness is a continuous process that when a hazard is identified and continues until the moment a disaster occurs. It is a “combination of planning, resources,
training, exercising, and organizing to build, sustain, and improve operational capabilities”. It includes “identifying the personnel, training, and equipment needed for a wide range of potential
incidents, and developing jurisdiction-specific plans for delivering capabilities” and capacity to address the incident. Disaster response occurs during and in the aftermath of a disaster. It includes the “immediate actions to save lives, protect property and the environment, and meet basic human needs” as well as “the execution of emergency plans and actions to support short-term recovery” (4, pgs. 15-16).
4
be difficult or impossible due to resource constraints. Disaster planning is performed by all levels of government, nongovernmental organizations, and the private sector (3).
Over the past decade, in large part due to the events of 9/11 and Hurricane Katrina, the Federal government has enacted legislation, produced guidelines, rules, and protocols, and developed and strengthened grants pertaining to disaster planning (Appendix D). North Carolina has also worked diligently to strengthen guidelines and develop new programs to enhance
disaster preparedness and response (Appendix E). One of the state’s greatest achievements is the development of the SMAT program.
SMAT Program
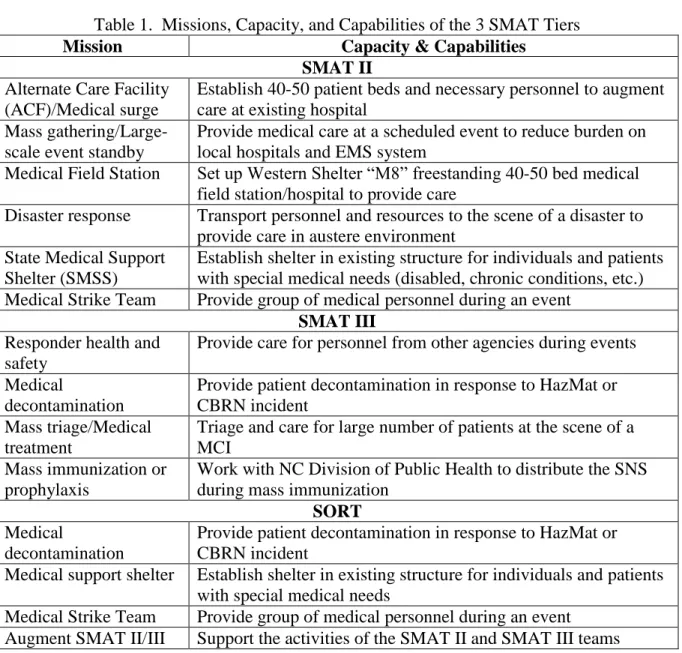
Introduction. The SMAT program is a response system developed after the September 11th attacks that is scalable, flexible, and adaptable. It responds to local, regional, intrastate, and interstate events and is divided into 3 tiers that determine the size, responses, and capabilities of each team (Table 1). The 29 SMAT III are the local, rapid-response elements of the program. The 8 SMAT II are the regional response elements with more personnel, equipment, and capabilities than the SMAT IIIs, and the SMAT I/Special Operations Response Team (SORT) provides response, education, decontamination, and support capabilities to the other tiers. Team personnel are almost exclusively volunteers from public service departments (fire, EMS, law enforcement), hospitals and HCOs, private businesses, and nongovernmental agencies. The SMAT program is funded primarily by the Hospital Preparedness Program (HPP), a cooperative agreement (grant) managed by the Assistant Secretary for Preparedness and Response (ASPR) of the U.S. Department of Health and Human Services (HHS). The SMAT program is a component of North Carolina’s State Medical Response System (SMRS), which also includes the Medical
5
during events that strain or overwhelm the health care system. The North Carolina Office of Emergency Medical Services (NC OEMS) manages the SMRS and the SMAT program and is the lead state agency tasked with managing Disaster Medical Services, or North Carolina Emergency Support Function-8A (NCESF-8A), in the NC EOP (5, 6).
Table 1. Missions, Capacity, and Capabilities of the 3 SMAT Tiers
Mission Capacity & Capabilities
SMAT II Alternate Care Facility
(ACF)/Medical surge
Establish 40-50 patient beds and necessary personnel to augment care at existing hospital
Mass gathering/Large-scale event standby
Provide medical care at a scheduled event to reduce burden on local hospitals and EMS system
Medical Field Station Set up Western Shelter “M8” freestanding 40-50 bed medical field station/hospital to provide care
Disaster response Transport personnel and resources to the scene of a disaster to provide care in austere environment
State Medical Support Shelter (SMSS)
Establish shelter in existing structure for individuals and patients with special medical needs (disabled, chronic conditions, etc.) Medical Strike Team Provide group of medical personnel during an event
SMAT III Responder health and
safety
Provide care for personnel from other agencies during events
Medical
decontamination
Provide patient decontamination in response to HazMat or CBRN incident
Mass triage/Medical treatment
Triage and care for large number of patients at the scene of a MCI
Mass immunization or prophylaxis
Work with NC Division of Public Health to distribute the SNS during mass immunization
SORT Medical
decontamination
Provide patient decontamination in response to HazMat or CBRN incident
Medical support shelter Establish shelter in existing structure for individuals and patients with special medical needs
Medical Strike Team Provide group of medical personnel during an event Augment SMAT II/III Support the activities of the SMAT II and SMAT III teams
6
Assistance Teams (DMAT) of the National Disaster Medical System (NDMS), and focused on providing capacity and capabilities at the local, regional, and intrastate level (7).
The SMAT program was established in 2002 after funding was secured through the National Bioterrorism Hospital Preparedness Program (NBHPP), subsequently renamed the HPP. The SMAT program was a collaborate effort of North Carolina Division of Public Health, which received the NBHPP funding, the NC OEMS, which oversees the program, NC EM, and the SORT. The initial goal of the NBHPP and the SMAT program was to improve the capacity to respond to bioterrorism through enhancing capabilities such as gross decontamination, pharmaceutical caches, and surge capacity (8, 9).
The SMAT program has evolved over the past decade in response to many factors. The most significant external influence is the HPP, which has created more benchmarks and
guidelines that emphasize all-hazards preparedness, caring for medically fragile and special medical needs patients, and strengthening health care coalitions. Internally, the NC OEMS has performed program assessments and teams have completed after action reviews (AAR) and generated improvement plans (IP) following trainings and deployments. These internal and external factors have affected the capacity and capabilities of the SMAT program by influencing equipment purchases, mission plans, and training design (8,10).
7
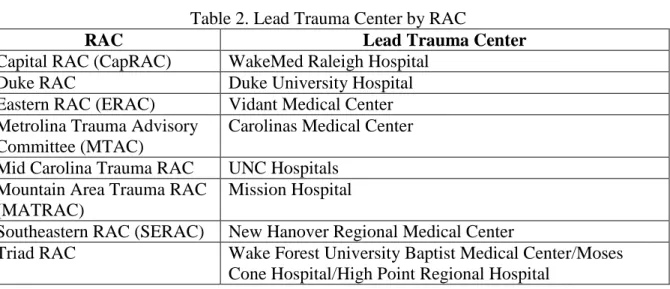
Oversight. Because the SMAT program is tiered, multiple agencies and jurisdictions oversee and manage the teams and the program. The 29 SMAT IIIs are managed and staffed by personnel from the municipality or county where the team is based and receives oversight from the RAC with which they are affiliated. Each SMAT IIs is led by the RAC’s lead Trauma Center and managed by personnel from the RAC (Table 2, Appendix B). This includes a Hospital Preparedness Coordinator (HPC), previously known as a Regional Emergency Response and Recovery Coordinator (RERRC), and other support and logistics personnel, all of whom are employees of the lead Trauma Center. The HPC acts as the liaison between the state and the individual HCOs in the RAC, oversees the programs and projects funded by the HPP, and works with RAC members to develop their preparedness capabilities (8). The NC OEMS provides program guidance, organizes statewide exercises, manages HPP grant applications and distributes funds, and defines the mission requirements.
Table 2. Lead Trauma Center by RAC
RAC Lead Trauma Center
Capital RAC (CapRAC) WakeMed Raleigh Hospital
Duke RAC Duke University Hospital
Eastern RAC (ERAC) Vidant Medical Center Metrolina Trauma Advisory
Committee (MTAC)
Carolinas Medical Center Mid Carolina Trauma RAC UNC Hospitals
Mountain Area Trauma RAC (MATRAC)
Mission Hospital
Southeastern RAC (SERAC) New Hanover Regional Medical Center
Triad RAC Wake Forest University Baptist Medical Center/Moses Cone Hospital/High Point Regional Hospital
8
insurance and titling of equipment. It also helps satisfy the HPP requirement of a 10% in-kind contribution from organizations that receive funds. This in-kind contribution is usually in the form of donated employee time or may include the purchasing or donation of vehicles, which the HPP does not fund (5).
Teams are deployed either by the state or through a local or regional request. An intra- or inter-state activation or deployment occurs through NC EM and is managed by the NC OEMS. This request occurs in response to a declared disaster or emergency. Local or regional requests for resources, including SMAT II or SMAT III equipment or personnel, can also be made directly to a RAC. These requests are in response to an unexpected event or in preparation for a scheduled event, and are more common than a deployment in response to an official state request for a declared disaster. Only official deployments are reimbursed by the state or federal
government, and are usually the only situation in which volunteers are reimbursed for their time. Teams often classify local and regional deployments as a training exercise which enables them to use HPP funding to offset some of the costs related to travel and supplies. Some teams provide triage and medical care for scheduled events on an annual basis (5)
Capabilities. The 29 county- and municipality-based SMAT IIIs provide a rapid, but limited, response. These teams consist of pre-hospital emergency services personnel – EMT-Basics, EMT-Intermediates, and EMT-Paramedics – that provide initial medical triage and treatment at a mass casualty incident (MCI), decontamination in response to a HazMat incident or bioterrorism, and medical care or rehabilitation for other responders.
9
equipment to respond to a mission request. Ideally, a team deploys within 30 minutes to a local event and statewide within 2 hours of a request. The teams can be activated by their local agency, the RAC, or by NC EM. Each team is affiliated with a RAC which should provide oversight, training opportunities, guidance, and grant development assistance (5, 11).
The SMAT IIs are regional assets. At the beginning of the program, 7 teams corresponded to the 7 initial RACs. CapRAC was added in 2006 after WakeMed Raleigh received accreditation as a Level 1 Trauma Center and applied to form its own RAC. SMAT IIs have more personnel and equipment than do the SMAT IIIs; more resources of all types permit them to have a broader set of missions and capabilities and to provide a larger and more
sustained response. SMAT IIs can respond in their region within 6 hours, and can mount an intra- or inter-state response within 12 to 24 hours. Once deployed, SMAT IIs are self-sufficient for 72-hours and can operate beyond this window with appropriate re-supply. Requests for local or regional deployments are made through the RAC and statewide deployments for declared disasters are made through NC EM (5, 7).
10
III are capable of providing. Each package includes specific information regarding response capabilities, patient capacity, and necessary personnel and equipment. These packages are meant to streamline the process of requesting assets during a response (5, 12).
More than 1,600 volunteers are registered with the SMAT IIs. Volunteers come from the local HCOs, EMS systems, private businesses, and nongovernmental agencies within the RAC. Many come from the lead trauma center, although every hospital within the RAC is required to provide personnel for the team. Team members have a diverse set of skills and knowledge. Medical support staff play a critical role in ensuring that the medical capabilities of the SMAT II are possible. The activities of physicians, mid-level providers, and nurses would not be possible without these individuals. Moreover, the SMAT program is mobile and potentially responds to austere environments with limited resources and interruptions in utility services such as
electricity, water, and communications. For this reason, other types of support personnel such as IT specialists, mechanics, drivers, and security are also necessary. These non-medical volunteers are members of an MRC and affiliate with a RAC (5).
The SMAT I is combined with the SORT, which is a private, non-profit organization based in Winston-Salem. This team provides training, medical decontamination, special medical needs sheltering, and supplementation of the SMAT II and III capabilities (5, 13).
11
Command System (ICS). The online component is then followed by in-person training to familiarize new members with the equipment and the operating procedures.
SMAT II and SMAT III continuing education varies significantly by team. Some teams train on a monthly basis while others train quarterly. In addition, some teams frequently train with other teams and resources, such as USAR and HazMat teams and local fire departments, while others train independently. Teams do not seem to have any specific training guidelines to follow or topics that the NC OEMS requires them to cover during continuing education; some teams review equipment while others perform drills and exercises. The NC OEMS, in
conjunction with NC EM and other state agencies, runs tabletop exercises (TTX), functional exercises (FE), and full-scale exercises (FSE) throughout the year that combine multiple teams and assets. In addition, some teams have multi-year training and exercise plans (TEP) that outline the activities over a multi-year period. Teams also receive just-in-time training
immediately prior to a deployment to review and learn about mission-specific equipment, skills, and responsibilities (9).
Deployments. The SMAT program has deployed many times over the past decade. The longest and largest was to Waveland, MS after Hurricane Katrina where multiple SMAT IIs and IIIs provided care in a field hospital for over a month. A partial list of declared disaster
deployments, local or regional responses, and scheduled events are included in Table 3 (5) Table 3. Partial List of SMAT Responses
Deployments Local/Regional Responses Scheduled Event Stand-by Hurricane Isabel HazMat spill Southeast Old Threshers Reunion Hurricane Charley Chemical plant fire Lexington BBQ Festival
Hurricane Frances Fire stand-by Tall Ships Festival
Waveland, MS Mercury spill OBX Marathon
Kentucky ice storm Overturned tanker Beach 2 Battleship Triathlon NC tornadoes Post office suspicious
package
Quintiles/Wrightsville Beach Triathlon
12
How well does the SMAT program meet the need of North Carolina and the goals set for it by the NC OEMS and by the program volunteers? The remainder of this paper answers that question by triangulating three sources of data: primary and gray literature, in-depth interviews with key SMAT observers and stakeholders, and a web-based survey of SMAT members.
Methods
Qualitative AnalysisI collected qualitative data about the NC SMAT program and disaster preparedness and response by reviewing primary literature, documents, and gray literature, and conducting in-depth interviews with elite stakeholders. These sources provided extensive information and pertinent details about my research question.
I identified the governmental and non-governmental agencies involved in disaster
preparedness and response at the federal, state, and regional level and reviewed their websites to create a concept map of potentially relevant agencies and the interactions between them. I reviewed the Public Laws, the U.S. Code, and the North Carolina General Statutes pertaining to preparedness and response and searched for pertinent documents, reports, and presentations. The final step was to review the organizations involved in the SMAT program and the SMRS.
Primary literature. My search of the primary literature was inclusive to ensure that I captured as many resources as possible. I searched MEDLINE, Google and Google Scholar for scholarly articles, newspaper articles, documents on agency websites, and government
13
I performed comprehensive searches of pertinent websites of the federal and state government to ensure that any appropriate information and literature was identified. The Site Map of each potential agency was first analyzed for potentially relevant departments, divisions, offices, or other sections. Each potential website was then reviewed in detail, looking for publications, guidelines, or other documents pertinent to preparedness and response.
I reviewed the Site Map for the United States Department of Homeland Security (www.dhs.gov). I focused on the Federal Emergency Management Agency and the
Preparedness, Response, and Recovery section of the website. Topics that I reviewed included the Homeland Security Exercise and Evaluation Program (HSEEP), State Homeland Security Grants, publications including the National Strategy for Homeland Security, National Response Framework, National Preparedness Guidelines, National Incident Management System, and National Health Security Strategy, and laws and regulations including the Homeland Security Presidential Directives.
I reviewed the website for the United States Department of Health and Human Services (www.hhs.gov). I used an organizational chart to identify potentially relevant offices and departments. The US HHS is divided into Operating Divisions and Staff Divisions. Within the Operating Divisions I reviewed the websites for the Centers for Disease Control and Prevention (CDC), the Agency for Healthcare Research and Quality (AHRQ), and the Health Resources and Services Administration (HRSA), and within the Staff Division I reviewed the website for the Office of the Assistant Secretary for Preparedness and Response (ASPR).
14
the Division of State and Local Readiness (DSLR), and the Strategic National Stockpile (SNS) through the Division of Strategic National Stockpile (DSNS). The AHRQ and HRSA websites provided access to various publications. The ASPR website provided information on the National Disaster Medical System (NDMS), the Strategic National Stockpile (SNS), the
Emergency System for Advance Registration of Volunteer Health Professions (ESAR-VHP), and the Hospital Preparedness Program (HPP), as well as links to various publications and guidelines including the Medical Surge Capacity and Capability (MSCC) handbook, HPP Funding
Opportunity Announcements and Funding Tables from 2007 to present, and the report entitled Healthcare Preparedness Capabilities: National Guidance for Healthcare System Preparedness.
Pertinent state-level agencies and websites include the General Assembly, the
Department of Health and Human Services (NC HHS), and the Department of Public Safety (NC DPS). Specific North Carolina General Statutes were identified and reviewed in full. From the NC HHS, the North Carolina Office of Emergency Medical Services (NC OEMS), which falls under the Division of Health Services Regulation, and the Public Health Preparedness and Response Branch of the Epidemiology Section of the Division of Public Health were reviewed. From the NC DPS, the Division of Emergency Management was reviewed. Each Regional Advisory Committee (RAC) website was also reviewed for pertinent information and literature.
15
OEMS and were involved in the management or oversight of the SMAT program or disaster preparedness and response.
I contacted a group of potential interviewees by email. My message included a standardized email script describing my project and requesting their participation in a phone interview. I scheduled a date and time for the phone interview with those who responded and agreed to participate. The interview was conducted via cellphone and, if the interviewee agreed, I used a digital voice recorder to record the interview so that it could be transcribed in its
entirety.
I developed a standardized interview script based upon questions that arose during review of the available literature. These questions generally focused on training, organization,
management, operations, finances, and leadership of the SMAT program and disaster
preparedness and response. I developed specific questions for the 3 types of elite stakeholders. These questions served as initial starting points for follow-up questions based on the responses of the individuals. The follow-up questions clarified the responses or asked the respondent to expand on their initial answer for a more detailed and comprehensive understanding of their initial response.
I transcribed interviews into Microsoft Word and reviewed by each of the interviewees. Responses were used as background material to describe the SMAT program and as results to be analyzed and included in the assessment of the SMAT program.
Quantitative Analysis
16
students and faculty of the University of North Carolina at Chapel Hill through its Odum Institute for Research in the Social Sciences. The content of the questionnaire is available for review in Appendix G. Briefly, the survey was divided into questions pertaining to team affiliation, training, operations/deployments, organization, finances, and demographics. I designed the survey with conditional logic so that specific responses trigger linked follow-up questions for clarification. Therefore, different respondents followed different flow paths through the questionnaire and not all questions were answered by all respondents.
The questionnaire was distributed for me by the NC OEMS. The NC OEMS maintains a responder database, mandated by the Emergency System for Advance Registration of Volunteer Health professionals (ESAR-VHP), called ServNC. All individuals who are affiliated with the SMAT program are registered with ServNC. They received an email from ServNC that alerted them to a new internal message on the ServNC website. The message explained the purpose of the questionnaire and included a brief message from me and a link to the Qualtrics questionnaire. A reminder email was sent 9 days after the initial message, and included the questionnaire link and a request for individuals to complete the questionnaire.
The questionnaire was closed to new responses 22 days after it was opened. I downloaded data from Qualtrics in Excel format and converted the spreadsheet to a Stata database; I performed all analyses using Stata/IC 12.1 (StataCorp LP, College Station, TX). Respondents who did not agree to participate were removed from the dataset prior to analysis. Incomplete surveys were included in the descriptive and bivariate analyses. Continuous variables were described using mean±standard deviation and median ±IQR. Categorical
17
bivariate analysis of categorical variables was performed using the Pearson’s Chi-Square test, Fisher’s Exact test, and Odds Ratio.
I developed a Capacity Index (CI) for various bivariate interactions to evaluate
relationships between variables. This CI calculation first transformed a categorical variable into a continuous variable by multiplying the percentage of respondents in a category by an assigned ordinal value (1, 2, 3, etc) for that category, thereby returning a continuous numerical value termed an Average Score. The Average Score for all respondents was then subtracted from the score for each group, providing a CI that allows for comparisons between groups.
All differences were considered statistically significant at p < 0.05. I corrected for multiple comparisons using the Bonferroni correction.
Results
Demographics of team members responding to the survey
The online questionnaire was distributed to 2,550 individuals and the questionnaire was accessed 306 times, a response rate of 12%. Sixteen respondents who accessed the questionnaire did not agree to take the survey (by clicking an “agree” response) and were excluded from the
analysis. The remaining 290 responses – 78.3% (227) of which were completed and 21.7% (63) of which were partially completed – provide the data I analyzed. Table 4 and Figures 1 and 2 provide respondents’ sex, ages, and educational levels.
18
only 1.5% (4) of responses, while MTAC and Triad RAC were overrepresented, with each accounting for approximately 20% of respondents (Table 5 and Figures 3 and 4).
Almost 40% of respondents have between 2 and 5 years of experience with the SMAT program, and almost 30% have between 5 and 10 years of experience (Table 6 and Figure 5). Most respondents know at least a few, if not many, most or all other team members. Years of experience is, as we would expect, significantly associated with knowing more of one’s fellow
team members (χ2=53.1, p<0.001, Table 7and Figure 6), but the relationship is not monotonic, and it also varies significantly by RAC (χ2
=45.9, p=0.001). Table 4. Demographic Characteristics
Sex
Figure 1. Age Distribution of Respondents
Figure 2. Education Level of Respondents
Male 62.3% (139)
Female 37.7% (84)
Age
Under 21 0.45% (1)
21-30 11.2% (25)
31-40 28.1% (63)
41-50 33% (74)
51-60 22.8% (51)
61-70 4.5% (10)
Education
19 Table 5.Affiliations
SMAT Type
Figure 3. SMAT Affiliation of Respondents
Figure 4. RAC Affiliation of Respondents
SMAT I 9.7% (25)
SMAT II 46.3% (119) SMAT III 31.5% (81) SMAT I & II 2% (5) SMAT I & III 0% (0) SMAT II & III 9.3% (24) SMAT I, II, & III 1.2% (3)
RAC
Cap RAC 1.5% (4)
Duke RAC 9.2% (24)
ERAC 14.6% (38)
MTAC 19.2% (50)
Mid Carolina RAC 12.7% (33)
MATRAC 12.3% (32)
SERAC 9.6% (25)
Triad RAC 20.8% (54)
Table 6. Years of SMAT Experience Less than 1 year 12.3% (31)
Figure 5. Total Years of SMAT Experience 1-2 years 14.3% (36)
2-5 years 39.7% (100) 5-10 years 29.4% (74) Greater than 10
years
20
Table 7. Familiarity with Team Members by Years of SMAT Experience Years of
Experience
Know Other Team Members? Odds Ratio
None or A few Many, Most, or All χ2, p value
< 1 year 29.2% (26) 3.1% (5) 1
1-2 years 22.5% (20 9.9% (16) 4.16 6.21, p=0.0127
2-5 years 32.6% (29) 43.8% (71) 12.73 29.25, p<0.0001 5-10 years 14.6% (13) 37.7% (61) 24.4 41.14, p<0.0001 > 10 years 1.1% (1) 5.6% (9) 46.8 18.35, p<0.0001 All respondents 35.5% (89) 65.5% (251)
Figure 6. Linear Regression of Familiarity by Years of SMAT Experience
A disproportionately low percentage of respondents, only 19%, were recruited by a hospital (Table 8), even though almost 80% of respondents are employed by either a hospital system or a county, and over 50% of respondents are employed as either paramedics or nurses. Over 20% of respondents identify their primary employer as neither a hospital nor a county and indicated that their occupation is non-medical (Table 9).
21
Table 8. Method of Recruitment of Respondents
Hospital 19% (48)
Local Emergency Management Agency or County 41.5% (105)
Member-driven inquiry 39.5% (100)
Table 9. Employment Information Primary Employer
Hospital System 36.7% (93) County ES/EM 41.5% (105)
Other 21.7% (55)
Primary Job
EMT-B 10.3% (27)
EMT-I 2.7% (7)
EMT-P 40.6% (106)
Nurse 16.1% (42)
NP 1.9% (5)
Pharmacist 1.5% (4) Physician 1.9% (5)
PA 1.9% (5)
Resp. Therapist 1.2% (3) Social Worker 0.4% (1)
Other 21.5% (56)
Training
More than 80% of respondents reported having received an initial orientation to their team, and respondents report having attended more than 13 training sessions on average, with about 9% of the sample reporting participation in 40 or more sessions.
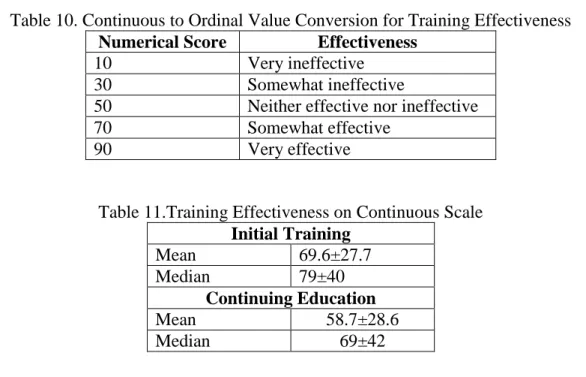
The survey asked respondents to choose a number from 0 to 100, with corresponding ordinal guidance (Table 10), which corresponds to whether the initial orientation/training and the continuing education are effective or ineffective (Table 11). Evaluation of initial training
(F=1.96, p=0.0623) and continuing education (F=2.00, p=0.0572) show no significant
22
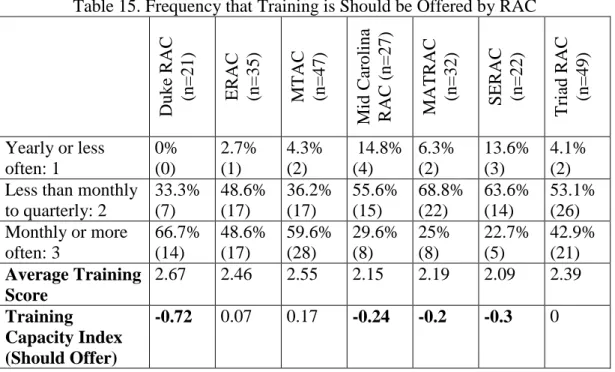
Respondents were asked how often training is offered, how often it should be offered, and how often they attend training. The original response options, never, yearly, quarterly, less than once a month, once a month, and 2-3 times a month, are merged into 3 categories for data
analysis: yearly or less, quarterly to less than monthly, and monthly or more often. These 3 categories are given corresponding ordinal values of 1, 2, and 3, respectively, enabling the calculation of an Average Training Score for the 3 questions. Table 13 shows that respondents think training should be offered more frequently than it is, although they actually attend less frequently than training is offered, perhaps because the time spent in training is often
unreimbursed.
Table 10. Continuous to Ordinal Value Conversion for Training Effectiveness Numerical Score Effectiveness
10 Very ineffective
30 Somewhat ineffective
50 Neither effective nor ineffective
70 Somewhat effective
90 Very effective
Table 11.Training Effectiveness on Continuous Scale Initial Training
Mean 69.6±27.7
Median 79±40
Continuing Education
Mean 58.7±28.6
Median 69±42
23
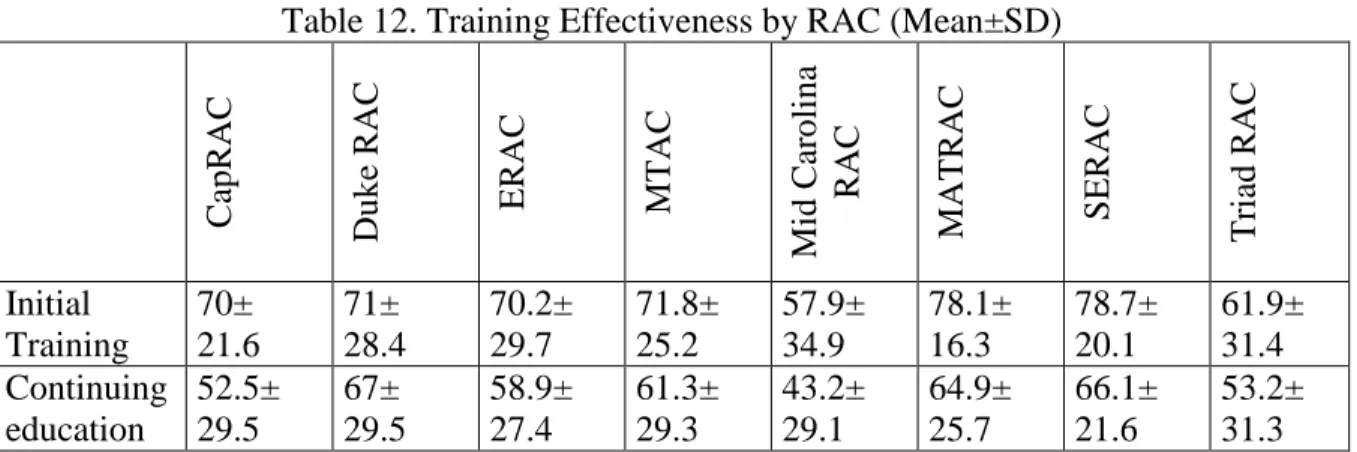
Table 12. Training Effectiveness by RAC (Mean±SD)
C apRAC Duke R AC ERAC MTAC Mi d Car oli na R AC
MATRAC SE
R AC Tr iad RAC Initial Training 70± 21.6 71± 28.4 70.2± 29.7 71.8± 25.2 57.9± 34.9 78.1± 16.3 78.7± 20.1 61.9± 31.4 Continuing education 52.5± 29.5 67± 29.5 58.9± 27.4 61.3± 29.3 43.2± 29.1 64.9± 25.7 66.1± 21.6 53.2± 31.3
Table 13. Training Frequency and Average Training Score Training
Frequency and Ordinal Value
How often training: is offered
(n=235)
should be offered (n=238)
is attended (n=233) Yearly or less: 1 19.6%
(46) 6.7% (16) 40.8% (95) Less than monthly to quarterly: 2 41.7% (98) 51.1% (119) 44.6% (104) Monthly or more
often: 3 38.7% (91) 43.3% (103) 14.6% (34) Average Training Score
2.2 2.39 1.74
Table 14. Frequency that Training is Offered by RAC
Duke R AC (n= 21) ERAC (n= 34)
MTAC (n=
47) Mi d Car oli na R AC (n= 27)
MATRAC (n=
30)
S
ERAC (n=
23)
Tr
iad RAC (n=
48)
Yearly or less often: 1 0% (0) 20.6% (7) 12.8 (6) 29.6% (8) 13.3% (4) 34.8 (8) 18.8% (9) Less than monthly
to quarterly: 2
14.3% (3) 32.4% (11) 38.3% (18) 44.4% (12) 70% (21) 60.9% (14) 39.6 (19) Monthly or more
often: 3 85.7% (18) 47.1% (16) 48.9% (23) 25.9% (7) 16.7% (5) 4.3% (1) 41.7% (20) Average Training Score
2.86 2.26 2.36 1.96 2.03 1.7 2.23 Training
Capacity Index (Offered)
24
Table 15. Frequency that Training is Should be Offered by RAC
Duke R AC (n= 21) ERAC (n= 35)
MTAC (n=
47) Mi d Car oli na R AC (n= 27) MATR AC (n= 32) S ERAC (n= 22) Tr
iad RAC (n=
49)
Yearly or less often: 1 0% (0) 2.7% (1) 4.3% (2) 14.8% (4) 6.3% (2) 13.6% (3) 4.1% (2) Less than monthly
to quarterly: 2
33.3% (7) 48.6% (17) 36.2% (17) 55.6% (15) 68.8% (22) 63.6% (14) 53.1% (26) Monthly or more
often: 3 66.7% (14) 48.6% (17) 59.6% (28) 29.6% (8) 25% (8) 22.7% (5) 42.9% (21) Average Training Score
2.67 2.46 2.55 2.15 2.19 2.09 2.39 Training
Capacity Index (Should Offer)
-0.72 0.07 0.17 -0.24 -0.2 -0.3 0
Table 16. Frequency that Training is Attended by RAC
Duke R AC (n= 20) ERAC (n= 34)
MTAC (n=
46) Mi d Car oli na R AC (n= 28) MATRA C (n= 29) S ERAC (n= 23) Tr
iad RAC (n=
49)
Yearly or less often: 1 15% (3) 55.9% (19) 26.1% (12) 75% (21) 31% (9) 39.1% (9) 38.8% (19) Less than monthly
to quarterly: 2
65% (13) 35.3% (12) 50% (23) 17.9% (5) 62.1% (18) 60.9%( 14) 38.8% (19) Monthly or more
often: 3 20% (4) 8.8% (3) 23.9% (11) 7.1% (2) 6.9% (2) 0% (0) 22.4% (11) Average Training Score
2.05 1.53 1.98 1.32 1.76 1.61 1.84
Training Capacity Index (Attended)
0.31 -0.21 0.24 -0.42 0.02 -0.13 0.1
Deployments
25
p<0.0001) (Table 18), as one would expect. The probability of deployment is significantly greater for respondents with 5-10 years or greater than 10 years of experience than it is for those with <1 year, 1-2 years, or 2-5 years of experience using a corrected p<0.005 based on multiple testing (Table 19).
The average number of deployments is 3.62±3.34 and the median is 2±4. Only time with the SMAT program increases the probability of deploying. Neither differences between RACs (χ2
=10.8, p=0.146; F=2.08, p=0.058) nor differences between SMAT types (χ2=7.8, p=0.169; F=1.21, p=0.312) affect the proportion of respondents that have deployed or the average number of deployments, respectively.
Table 17.Percentage of Respondents that have Deployed Yes 35.9% (83)
No 64.1% (148)
Table 18. Probability of Deployment by Years of Experience
Deployed
SMAT Experience (Years) <1 (n=25) 1-2 (n=34) 2-5 (n=94) 5-10 (n=57) >10 (n=8)
Yes 16%
(4) 8.8% (3) 31.9% (30) 56.7% (38) 87.5% (7)
No 84%
(21) 91.2% (31) 68.1% (64) 43.3% (19) 12.5% (1)
Table 19. Difference in the Probability of Deploying by Years of Experience <1 year 1-2 years 2-5 years 5-10 years >10 years <1 year * NS NS χ2=12.2,
p<0.0001 χ2
=13.9, p<0.0001
1-2 years * * NS χ2=21.5,
p<0.0001 χ2
=22.1, p<0.0001
2-5 years * * * χ2=9.9
p=0.002 χ2
=9.9 p=0.002
26 Preparedness
Preparedness for different types of responses varies significantly, ranging from almost 85% of respondents feeling prepared to respond to a mass gathering or surge event while slightly greater than 28% feel prepared to respond to a nuclear, biologic or chemical attack. Overall Preparedness for all responses, calculated by averaging the percentage that feel prepared for each type of response, is approximately 65%. Training is consistently identified across all hazards as the area that needs the most improvement. A similar number of respondents feel that equipment, personnel, and financial support also need improvement for the team to become adequately prepared (Table 20).
Table 20. Overall and Response-Specific Preparedness and Domains to Improve
Type of Response
Respondents that believe
the team is adequately prepared
Domain that must improve to achieve preparedness
T rain in g E q u ip m en t Pe rson n el Fin an cial S u p p or t Other Decontamination/ HazMat 68.3% (155) 25.1% (57) 15.4% (35) 18.1% (41) 14.1% (32) 1.3% (3) Health care facility evacuation 71.4% (162) 21.6% (49) 13.7% (31) 15% (34) 14.5% (33) 1.3% (3)
Hurricane 82.8%
(188) 11% (25) 7.9% (18) 7.5% (17) 7.9% (18) 0% (0) Mass gathering/ Surge event 85.9% (195) 7.9% (18) 5.3% (12) 6.6% (15) 6.2% (14) 0% (0) Mass prophylaxis ID Outbreak 53.7% (122) 34.8% (79) 26.9% (61) 20.7% (47) 22% (50) 2.2% (5) Nuclear/Biologic/ Chemical attack 28.2% (64) 60.4% (137) 45.4% (103) 40.1 (91) 34.4% (78) 3.5% (8) Overall Preparedness 65.1%
27
respondents, indicating how well respondents believe each RAC is prepared in comparison to how well respondents believe the entire program is prepared.
Preparedness is also evaluated by SMAT type. The SMAT Preparedness Capacity Index indicates that respondents on the SMAT I and SMAT IIs feel better prepared, and SMAT III personnel feel slightly less prepared, than overall “whole sample” preparedness scores would suggest (Table 22).
Table 21. Overall and Response-Specific Preparedness by RAC
Type of Response
Duke R AC (n= 22) ERAC (n= 34)
MTAC (n=
41) Mi d Car oli na R AC (n= 24) MATRA C (n= 30) S ERAC (n= 22) Tr
iad RAC (n=
49) Decontamination/ HazMat 81.2% (18) 85.3% (29) 70.7% (29) 45.9% (11) 76.7% (23) 68.2% (15) 57.1% (28) Health care facility
evacuation 72.7% (16) 67.6% (23) 65.9% (27) 79.2% (19) 76.7% (23) 72.7% (16) 69.4% (34)
Hurricane 90.9%
(20) 85.3% (29) 80.5% (33) 87.5% (21) 83.3% (25) 100% (22) 71.4% (35) Mass gathering/ Surge event 95.5% (21) 94.1% (32) 85.4% (35) 79.2% (19) 80% (24) 90.1% (20) 83.7% (41) Mass prophylaxis/ ID Outbreak 63.6% (14) 52.9% (18) 56.1% (23) 41.7% (10) 66.7% (20) 50% (11) 46.9% (23) Nuclear/Biologic/ Chemical attack 27.3% (6) 29.4% (10) 29.3% (12) 16.7% (4) 43.4% (13) 22.7% (5) 24.5% (12) Overall
Preparedness 72% (95/132) 69.1% (141/204) 64.6% (159/246) 58.3% (84/144) 71.1% (128/180) 67.4% (89/132) 58.8% (173/294) RAC Preparedness
Capacity Index
28
Table 22. Overall and Response-Specific Preparedness by Type of SMAT Type of Response SMAT I
(n=23) SMAT II (n=132) SMAT III (n=96) Decontamination/ HazMat 69.6% (16) 62.1% (82) 82.3% (79) Health care facility
evacuation 82.6% (19) 81.8% (108) 61.5% (59)
Hurricane 91.3%
(21) 93.9% (124) 75% (72) Mass gathering/ Surge event 95.7% (22) 93.2% (123) 82.3% (79) Mass prophylaxis/ ID
Outbreak 60.1% (14) 60.6% (80) 49% (47) Nuclear/Biologic/ Chemical attack 30.4% (7) 25% (33) 30.2% (29) Overall Preparedness 71.3% (99/138) 69.4% (550/792) 63.4% (365/576) SMAT Preparedness Capacity Index
6.2 4.3 -1.7
Discussion
Evaluating the SMAT program requires assessing the training of the teams, the ability to deploy effectively, the relationships between the teams and the state, and deciding if the funding and management of the teams are adequate.
Recruitment and Retention
29
participate in other scheduled events. Responses from the questionnaire indicate that almost 40% of respondents have been with their team between 2 and 5 years and another 30% have been with their team for between 5 and 10 years. This indicates that a majority of team members do feel a strong commitment to their team and to the mission. However, my in depth interviews indicate that some members may stay on the roster for a number of years, yet not be active participants or maintain their training. Other individuals questioned the ability of a team to fulfill a request for certain types of full deployments because of insufficient personnel.
Teams need to increase their recruitment efforts. While 40% of respondents indicated that they worked for a hospital system, only 19% indicated that their hospital recruited them. RACs need to work with their member hospitals to increase the visibility of the program and current members need to work on recruiting co-workers. One HPC advertises the program through occupational health which ensures that every new employee hears about the SMAT program during their initial physical. Another places pictures and information about the teams around nursing stations to increase the visibility. Recruitment drives have also been used at some hospitals.
Many volunteers are recruited from the lead hospital, with relatively few from the other hospitals. Identifying a “hospital liaison” to function as the lead recruiter or information officer
for each hospital might help with recruitment efforts at the other RAC hospitals by giving interested individuals a contact person who can provide information about the SMAT program. Recruitment from non-hospital HCOs within a RAC is an even greater challenge. These
potential volunteers don’t work in a hospital and may never interact with the RAC. The most
30
more of a challenge as overall volunteerism seems to be in a decline. That is why teams need to redouble their efforts on recruitment to bolster the number of volunteers in the SMAT program.
Retention of members has also been a challenge. Teams must make their volunteers feel invested in the program, which can be difficult when activities and opportunities to deploy or work at scheduled events are relatively infrequent. Offering multiple dates for training and ensuring that training occurs regularly is important for building that connection. Deployments, field exercises, and scheduled events also build camaraderie and increase volunteers’ feelings of
connectedness with the team and the program. Teams should strive to schedule specific standby events to work throughout the year. These offer an opportunity for training and a chance to build connections between volunteers.
Training
Training is a dynamic process rather than a set of independent events. What has been effective in the past does not necessarily continue to be effective into the future. The SMAT program has revised its training doctrine various times during its existence as capabilities and responsibilities have evolved. Oversight and guidance is provided from the NC OEMS and from the RAC leadership. In addition, the different teams have varying capabilities depending on, for example, if they have a pharmacy trailer or other specialized equipment. However, the teams also have a core cache of equipment and similar responsibilities regardless of their geographic location or RAC affiliation.
31
interoperability of teams and team members during a deployment. Other respondents thought that RACs should be responsible for developing and determining the types of training and schedule of topics being delivered during training because this approach can be tailored to specific weaknesses or team-specific topics that require extra training.
The NC OEMS, with the help of an outside consultant, has developed a new SMAT Initial Education Program for all new members to replace the existing core topics. This training is currently being deployed across the RACs. Close to 85% of questionnaire respondents said they completed the old initial training and orientation and gave it an average score of almost 70, which means they felt it to be somewhat effective. The goal should be for 100% of new members to complete the initial trainings and have a team orientation. All RACs should work to develop a consistent process of orientation to ensure that potential volunteers receive appropriate
information. More than 15% of respondents haven’t received an initial orientation and gone through the initial training, which means that these volunteers aren’t eligible to deploy and may
stop participating entirely, resulting in the loss of valuable personnel.
Continuing education (con-ed) is developed and managed at the RAC level or at the level of the individual SMAT III. This means that the frequency of con-ed and the topics being covered vary by team. Questionnaire respondents gave these trainings a mean score close to 60, between somewhat effective and neither effective nor ineffective on the scale, and lower than the score for the initial training. This difference between the score for the initial training and con-ed occurs at all RACs, although the disparity in the score varies. This indicates that overall, con-ed isn’t viewed to be as effective as the initial orientation. Perceived effectiveness also varies by
32
One potential training issue is the frequency of the offered trainings. Another is the quality of the training being offered, and a third is the topic being covered during the training. The Average Training Score indicates a discrepancy between how frequently training is offered, how often it should be offered, and how often it is attended. Respondents from all RACs believe training should be offered between quarterly and monthly, but that it is currently offered closer to quarterly. More importantly, the average level of training attendance is less than quarterly. If respondents aren’t attending training because the content or topic isn’t appealing, then the quality
of training should be addressed. If too few training sessions are offered or attendees have scheduling conflicts with the trainings then the RAC should work on increasing the available training dates, potentially offering multiple dates for the same topic. Volunteers may also have a problem with the time commitment required to participate on the team, which is more difficult to address and correct. There may be benefit in working with the NC OEMS to develop general guidelines about training topics to cover each year or over a multi-year training schedule. This would ensure all SMAT volunteers receive a similar set of topics to enhance interoperability but would provide the RACs with the autonomy to deliver the content as each sees fit and not burden the NC OEMS with developing topic-specific content. There is also the argument that the NC OEMS should be responsible for the development and delivery of training to all of the RACs to ensure consistency amongst the teams.
Deployments
33
comments in the questionnaire, it does seem that certain teams have had more opportunities to deploy for declared events or work at scheduled, non-declared events. As discussed previously, this discrepancy in opportunity may hinder recruitment and retention for those teams that aren’t as active. It may also affect how often a team offers training, how often members feel that training should be offered, and how often they attend training. Deployments and scheduled events also help prepare teams for the variety of responses that they may provide.
The NC OEMS, in conjunction with the RACs, might consider developing a deployment calendar that rotates which team is “active” during a set period of time. This team would serve
as the first team out in the event of a deployment request. This system might help encourage training and participation because team members may be more likely to participate if they know their team is “active”. Similar systems are already employed for Federal USAR teams and other
disaster response elements. The existing state divisions used by NC OEMS or NC EM could also be used to divide the system up so that there are 3 “active” teams providing coverage for the
eastern, central, and western regions of the state. Another system, more complicated but also more inclusive, would be to divide up the types of responses and have teams rotate what
response they are “active” for. This would keep more teams “active” and training could focus on
either the current or upcoming “active” response designation. Overall Preparedness
Responses indicate that overall preparedness varies significantly depending on the type of response. Preparedness for a nuclear, chemical or biologic attack was lowest, with just over 28% of respondents saying they felt prepared. At the other end of the spectrum, over 85% of
34
facility, just over 68% are comfortable performing decontamination or responding to a hazmat event, and about 54% feel prepared to respond and provide mass prophylaxis during an
infectious disease outbreak.
Respondents identified training as the most important issue to improve to become prepared across all types of responses. The specific changes to training that are necessary to improve preparedness were not explored in the questionnaire, so it is difficult to provide focused feedback. However, it is likely that the earlier suggestions about ways to enhance training would improve respondents’ sense of preparedness. Respondents identified improvements in
equipment and personnel as the next two most important issues necessary to improve
preparedness. In-depth interview responses provided similar results regarding the types of events that teams are most prepared for. The change in the focus of the program, with more emphasis on responding to hurricanes, establishing alternate care facilities, and setting up special needs sheltering, and decreasing emphasis on responding to terrorist attacks and performing mass decontamination is clearly supported by the questionnaire results. One difficult question that the SMAT program should consider is whether the teams are attempting to manage too many disparate responsibilities. It may be more logical for the SMAT III assets to focus on immediate mass decontamination, hazmat response, and triage, and for the SMAT II assets to emphasize health care evacuation, special medical needs sheltering, and establishing field hospitals and/or alternate care sites. This would be a significant change for the teams, but might allow training to be focused on fewer topics and potentially allow volunteers to become more proficient in fewer areas.
35
respondents from 3 RACs feel less prepared than average based on the RAC Preparedness Capacity Index. Respondents on a SMAT I or SMAT II feel more prepared than average, while those on a SMAT III feel less prepared than average based on the Preparedness Capacity Index. A potential explanation for this disparity between the types of SMAT is that the SMAT IIIs do not necessarily train for all of the types of responses included in the questionnaire and instead focus on decontamination and patient triage. It may also be that, as some of the in-depth
interviewees stated, some SMAT III teams are more active in training than others and some train on their own, while others participate in joint trainings with their SMAT II team. Similarly, some RACs spend more time performing joint trainings and working at scheduled events than others. These may be two factors that influence the differences in preparedness between RACs. There may be other factors as well, such as time on the team, previous deployments and
scheduled events worked, and quality of training, but it is difficult to evaluate how influential each of these potential factors is in making respondents feel prepared for a specific type of response.
Preparedness is also dependent upon the standard operating procedures and standard operating guidelines that are developed for each type of mission response. My impression from the in-depth interviews is that the responsibility for developing and maintaining these documents is not well defined. Some HPCs argue that the NC OEMS needs to take a more active role in developing SOPs and SOGs to distribute to the RACs. Each RAC can then take a standard set of procedures and guidelines and make adaptations or additions as necessary to address specific extenuating factors applicable to each team based on the regional HVA. And, as some
36
work on the North Carolina Burn Surge Disaster Program is evidence of progress towards the development of comprehensive plans. This plan was completed through the combined efforts of the NC OEMS and individuals at the state’s teaching hospitals. Similarly, comprehensive and
detailed SOPs and SOGs will require coordination and cooperation between the NC OEMS, RAC leadership, and individuals at the member hospitals, counties, and EMS agencies. A revised set of these documents may help the teams standardize and improve their training to better fit the expected capabilities and tasks required during a mission.
Training may also benefit by increasing the frequency of exercises and drills. Some questionnaire respondents remarked that training focuses on equipment familiarization rather than how to use the equipment during a mission. Some HPCs believe that the SMAT program will emphasize exercises and drills over the next few years as more HPP funding goes to training and less to new equipment purchases. Teams should enhance their training exercises as they implement multi-year TEPs and integrate the HPP benchmarks related to training exercises and the requirement that programs follow the HSEEP guidelines into their trainings.
A multi-year TEP allows teams to implement the “crawl, walk, run” approach. In the crawl stage team members are introduced to programs and skills through basic learning sessions and tabletop exercises (TTX). The walk stage allows for drills and functional exercises (FE) where capabilities, procedures, and activities can be performed and evaluated under controlled conditions. The run stage is the culmination of the TEP evolution, and includes full-scale exercises (FSE) where all aspects of the team’s capabilities are implemented and exercised. The
37
and frequency of, these training exercises may improve volunteers’ confidence in the capabilities of their team. They do not have to be state-level trainings, but instead can be at the RAC level or between multiple RACS and their SMAT IIs and IIIs. The quality, quantity, and type of training are the three most important variables in improving the SMAT program preparedness for
responding to an event. Funding
The SMAT program should also assess the financial viability and funding of the program. The reliance on federal assistance through the HPP places the program at risk of having funding shortfalls or difficulties if HPP funding is reduced or stopped. The public’s memory for large
events like 9/11 and Hurricane Katrina is relatively short and this collective short-term memory in conjunction with an economic recession puts pressure on the federal government to reduce funding for preparedness and response programs. The SMAT program and the SMRS should develop contingency plans for funding and potential restructuring of assets if financial
difficulties were to be encountered in the future due to changes to the HPP. Limitations
38
program. The in-depth interviews were with individuals in leadership positions rather than with volunteer personnel of the SMAT program. It is possible that the responses might vary if a random sampling of volunteers were interviewed rather than program leadership. In addition, the responses from the in-depth interviews were not graded or scored, and no attempt was made to compare respondents’ answers. However, even with these limitations, I believe that the
questionnaire and in-depth interviews provide valuable information to help evaluate and improve the SMAT program.
Conclusion
Hazards constantly threaten North Carolina and a decade ago state agencies, HCOs, and citizens came together to create a program to enhance preparedness for, and response to, these potential disasters. The SMRS and the SMAT program provide North Carolinians and citizens of neighboring states with a unique and valuable set of assets to address the medical and public health needs of individuals and communities affected by a catastrophic health event. The program has shown its utility in its responses to both disasters and scheduled events over the years.
39
drills and exercises, improving the SOPs and SOGs, and redoubling recruitment and retention efforts, are currently being implemented or should be goals for the future.
These processes are dynamic and will change as the SMAT program continues to mature and develop. The first decade has been a period of development, growth, and establishing capabilities. The next phase entails maturation and refinement of current capabilities, adjusting to fit changing demands, and continued alignment with evolving HPP benchmarks and
40
References
1. Multi Hazard Identification and Risk Assessment: The Cornerstone of the National Mitigation Strategy. Washington (D.C.): Federal Emergency Management Agency; 1997. ICDRM/GWU Emergency Management Glossary of Terms. Washington (D.C.): Institute for Crisis, Disaster, and Risk Management, The George Washington University; 2007 Feb. 2. Manning FJ, Goldfrank L. Preparing for Terrorism: Tools for Evaluating the Metropolitan
Medical Response System Program. Washington (D.C.): Institute of Medicine, National Academy of Sciences. Contract No.: 282-99-0045. Supported by the Office of Emergency Preparedness, U.S. Department of Health and Human Services.
3. National Response Framework, Glossary and Acronyms. Washington (D.C.): U.S. Department of Homeland Security; 2008 Jan.
4. Skarote MB. Deployable Medical Assets. PowerPoint presented at: The IAEM-USA Region 4 Conference: 2012 Apr 16-20; Myrtle Beach, SC.
5. State of North Carolina Emergency Operations Plan. Raleigh (NC): Division of Crime Control & Public Safety, Division of Emergency Management; 2009 Apr.
6. Medical Surge Resources. PowerPoint. Raleigh (NC): North Carolina Office of EMS. 7. From Hospitals to Healthcare Coalitions: Transforming Health Preparedness and Response in
Our Communities. Washington (D.C.): U.S. Department of Health and Human Services, Assistant Secretary for Preparedness and Response; 2011 May.
8. Frequently Asked Questions. Raleigh (NC); Capital Regional Advisory Committee (CapRAC): 2007 Sept.
9. Healthcare Preparedness Capabilities: National Guidance for Healthcare System
Preparedness. Washington (D.C.): U.S. Department of Health and Human Services, Assistant Secretary for Preparedness and Response, Hospital Preparedness Program; 2012 Jan.
10. State Medical Assistance Team Description. Charlotte (NC): MTAC State Medical Assistance Team.
11. Establishing an Alternate Care Facility. PowerPoint. Raleigh (NC): North Carolina Office of EMS.
41
13. Strickler J, Murtaugh L, Hoffman R. University of North Carolina’s Experience with the State Medical Assistance Teams. J Trauma Nurs. 2010;17(3):167-168.
14. Brice JH, Alson RL. Emergency Preparedness in North Carolina: Leading the Way. NC Med J. 2007;68(4):276-279.
15. State Medical Assistance Teams. CapRAC Online [Internet]. Capital Regional Advisory Committee. Available from: http://www.caprac.com/body.cfm?id=17&oTopID=17.
16. An Overview Ver.1.0. Atlanta (GA): Centers for Disease Control and Prevention, Office of Public Health Preparedness and Response. 2011 Nov.
17. Division of State and Local Readiness. Atlanta (GA): Centers for Disease Control and Prevention, Office of Public Health Preparedness and Response. 2011 Aug.
18. Division of Strategic National Stockpile. Atlanta (GA): Centers for Disease Control and Prevention, Office of Public Health Preparedness and Response. 2011 Aug.
19. Reese S. Selected Federal Homeland Security Assistance Programs: A Summary. CRS Report for Congress. Washington (D.C.): Congressional Research Service. 2008 Jan. Order Code RL32348.
20. Franco C, Toner E, Waldhorn R, et al. Systemic Collapse: Medical Care in the Aftermath of Hurricane Katrina. Biosecur Bioterror. 2006 Jun;4(2):135-146.
21. Emergency System for Advance Registration of Volunteer Health Professionals (ESAR-VHP) – Legal and Regulatory Issues, Draft Report. Washington (D.C.): U.S. Department of Health and Human Services, Health Resources and Services Administration. 2006 May. 22. Public Health Security and Bioterrorism Preparedness and Response Act of 2002, Pub. L.
No. 107-188, 116 Stat. 594 (Jun. 12, 2002).
23. Public Health Service Act, 42 U.S.C. Sect. 201 (2010).
24. Lister SA. An Overview of the U.S. Public Health System in the Context of Emergency Preparedness. CRS Report for Congress. Washington (D.C.): Congressional Research Service. 2005 Mar. Order Code RL31719.
25. Pandemic and All-Hazards Preparedness Act, Pub. L. No. 109-417, 120 Stat. 2831 (Dec. 19, 2006).