Lucrări ştiinŃifice Zootehnie şi Biotehnologii, vol. 41(2) (2008), Timişoara
NON-INVASIVE METHOD TO ESTIMATE THE
SLAUGHTER VALUE OF CATTLE
METOD
Ă
NON-INVAZIV
Ă
PENTRU ESTIMAREA VALORII
DE T
Ă
IERE A BOVINELOR
HOLLÓ G.
Faculty of Animal Science, Kaposvár University, Kaposvár, Hungary
The aim of this series of experiments was to examine the opportunity of application of X-ray Computer Tomography (CT) in cattle production. Altogether 191 animals of different breeds and genders were used in the study. In Experiment 1, the tissue composition of cuts between 11-13th ribs (n=136), was determined by CT and correlated with tissue composition of intact half carcasses prior to dissection and tissue separation. Results indicate that tissue composition of rib samples determined by CT closely correlates with tissue composition results by dissection of whole carcasses. In Experiment 2, tissue composition of rib samples by CT (n=40) were compared to the results of EUROP carcass classification. CT analysis has higher predictive value in estimation of actual tissue composition of cattle carcasses than EUROP carcass classification. The results of Experiment 3 showed that calves with higher muscle tissue area at the age of 7 days determined by CT will also have more meat in carcass. On the other hand, the cross sectional area of longissimus muscle can be used as a useful reference scan for the evaluation of meat of carcass.
Key words: cattle, slaughter value, X-ray Computer Tomography
Introduction
The slaughter value of cattle means the main quantitative and qualitative parameters of carcass. The carcass composition can be measured accurately by full carcass dissection, but this is time consuming, destructive and expensive process and cannot easily be included in the commercial slaughter line. Therefore, animal breeders have had a strong desire to find methods for in vivo estimation of carcass composition in animals after slaughter without the need for complete dissection for a long time.
determined by dissection of rib samples. The objectives of Experiment 1 was to establish the relationship between the tissue composition 11-13th ribs determined by CT and that of the intact carcass and to estimate slaughter value from data of CT imaging for selected cattle breeds and gender. In addition, (in Experiment 2) to survey the validity of the EUROP-carcass classification system in relation to findings gained through CT analysis in beef cattle fed with different feeding regimes was aimed. In Experiment 3, in vivo CT analysis was performed; it was analyzed the relationship between body composition of calves estimated by CT at different ages and carcass composition determined at slaughter.
Materials and Methods
In Experiment 1 altogether 136 different breed and gender was used. Feeding regimen consisted of maize and hay based diets with moderate concentrate supplementation. The average final live weight of animals was 504 kg. In Experiment 2 the Hungarian Grey (HG) (N = 20) and Hungarian Holstein (HH) (N = 20) growing-finishing bulls were fed either extensively on grass silage based diets and concentrates with linseed meal supplementation in the last month of fattening or intensively on concentrates based diets with maize silage supplementation according to a 2 x 2 experimental design. The animals were fed until 555 kg final weight on the average.
In Experiment 3 the alteration of body composition of 15 Hungarian Simmental male calves was performed using in vivo CT method at different age levels. The first and second scanning of whole body (from neck to hock) were made at the age of 7 days and 98 days, respectively (average live weight was 43 and 85 kg, respectively). The animals were fattened until the average live weight reached 600 kg. After slaughter the right half carcass was dissected. After 24-hours chilling the right half carcasses were de-jointed and dissected: lean meat, fat and bone were separated. Rib samples were taken between the 11-13th ribs and were weighted. X-ray Computer Tomography analysis of rib samples were made at the Institute of Diagnostic Imaging and Radiation Oncology of Kaposvár University (Hungary). In Experiment 1 SIEMENS Somatom DRG type (SIEMENS, Germany) was used, in Experiment 2 and Experiment 3 SIEMENS Somatom Plus S-40 (SIEMENS, Germany) equipment. Subsequently, samples were transported to the Analytical Laboratory of the University, where the tissue composition (muscle, bone, fat, connective tissue) was determined by dissection. For data processing software of SPSS 8.0 Statistical Program Package were used.
Results and Discussions
Table 1 Dressing data
Item Experiment 1 N = 136
Experiment 2 N = 40
Experiment 3 N=15 Slaughter weight, kg 504.29+86.18 554.95+32.79 586.73+24.34 Cold carcass weight, kg 252.46+50.77 255.60+39.18 169.92+9.64 Dressing percentage, % 51.94+4.65 54.25+2.12 58.80+2.02 Lean meat, % 67.07+3.70 68.01+2.72 71.39+2.33 Fat, % 11.74+4.57 7.21+3.08 9.34+2.40 Bone, % 21.15+0.16 20.15+2.22 18.18+0.89 Weight of rib samples, kg 2.79+0.69 2.80+0.56 3.96+0.55
Experiment 1
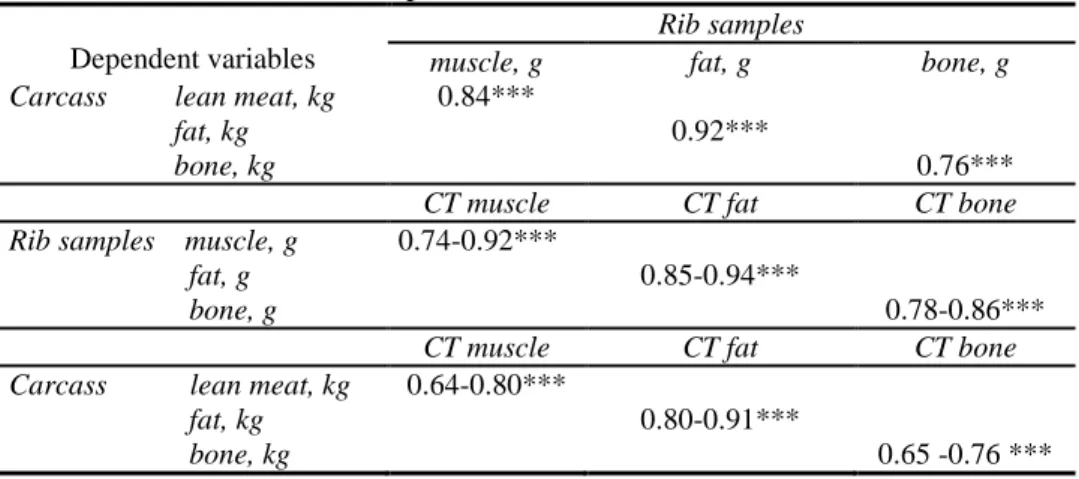
The coefficients of correlation (r) among tissues in carcasses and rib samples determined by dissection and by CT are presented in Table 2. First, the tissue composition (muscle, fat, bone) of rib samples and the dissected carcass composition were compared. The coefficients of correlation ranged from 0.76-0.92. These findings reveal that the composition of 11-13th rib joint is suitable for the estimation of the entire carcass composition.
Table 2 Coefficient of correlation (r) between tissues in whole carcasses and dissected rib
samples as well as CT- data
Dependent variables
Rib samples
muscle, g fat, g bone, g Carcass lean meat, kg
fat, kg bone, kg
0.84***
0.92***
0.76*** CT muscle CT fat CT bone Rib samples muscle, g
fat, g bone, g
0.74-0.92***
0.85-0.94***
0.78-0.86*** CT muscle CT fat CT bone Carcass lean meat, kg
fat, kg bone, kg
0.64-0.80***
0.80-0.91***
0.65 -0.76 *** * P<0.05, ** P<0.01, *** P<0.001
between the area, volume, pixel-sum of adipose tissue determined by CT of 11-13th ribs, and the percentage of fat in the entire carcasses. The coefficients of correlation between tissue composition of rib samples determined by CT and the tissue composition of dissected rib samples were also high in lean meat, fat and bone content. The results reveal that the tissue composition of carcass can be estimated well by CT examination of rib samples. This is one opportunity of application of CT in the cattle production. Thus, for selection purposes equations developed can be used and may have added value to improve traits of economic importance in cattle.
Experiment 2
The results of EUROP-classification and the actual tissue composition of carcasses are presented in Table 3. It is a well known fact that EUROP-classification is based on the subjective evaluation of the conformation (muscularity, fatness) of carcasses.
Table 3 Mean and SD of actual meat and fat content in half carcasses classified by EUROP
classification scheme
Diet Breed R Muscle, % O Muscle, % P Muscle, % Total %
n n n
e HG 4 72.06+2.21 5 70.26+1.42 1 70.08+0.00 70,96+1,85 i HG - - 3 68.09+2.24 7 67.17+3.13 67,45+2,80 e HH 3 68.49+1.49 7 67.58+1.39 - - 67,84+1,41 i HH - - 4 64.70+1.41 6 66.54+1.73 65,80+1,79 Overall 7 70.53+2.61b 19 67.76+2.41a 14 67.11+2.55a 68.01+2.72
Diet Breed 2 Fat, % 3 Fat, % Total, %
n n
e HG 8 4.65+0.92 2 5.50+1.60 - - 4.82+1.04 i HG 9 10.42+1.77 1 12.18+0.00 - - 10.60+1.76 e HH 1 3.67+0.00 9 4.29+0.90 - - 4.23+0.87 i HH 3 9.72+0.81 7 8.94+2.04 - - 9.18+1.75 Overall 21 7.80+3.17 19 6.55+2.92 - - 7.21+3.08
ab the same superscript means no different significant deviations (P>0.05)
muscularity classes no significant differences were present. In Norway, Johansen et al. (2006) examined the accuracy of the EUROP classification system in lambs. It was established that the EUROP system predicted lean meat percentage poorly and over-classify conformation class whereas under-classify fat class. In the present study significant differences were established in fat classes of HG animals, 17 were assigned into the 2nd class and 3 animals to 3rd class, opposite to Holstein, where 16 animals were ranked to 3rd class and 4 to 2nd class, saying that the Holsteins were fatter. HG carcasses contained higher amount of fat based on the dressing data between the groups with different feeding regimen. In further experiments in Hungary Bozó et al. (1999) indicated that the EUROP cattle classification system would not reflect the actual carcass composition. Thus, the authors suggested, as it is the case in pigs, to develop objectively measurable methods (Berg et al. 2002). On the contrary to the EUROP muscularity grades the lean meat content of rib samples of the same slaughter cattle analyzed by CT showed a close correlation (r=0.88) with the actual lean meat content of carcasses. The same tendency can be seen in the amount of fat (r=0.93) and bone (r=0.81) in the carcass. As both the dissection and CT-data showed animals in the extensively fed groups deposited more lean meat and bone and less fat. It was established, that as compared to EUROP classification carcass quality grading system the CT-analysis is of higher predictive value in estimation of the actual carcass composition in cattle.
Experiment 3
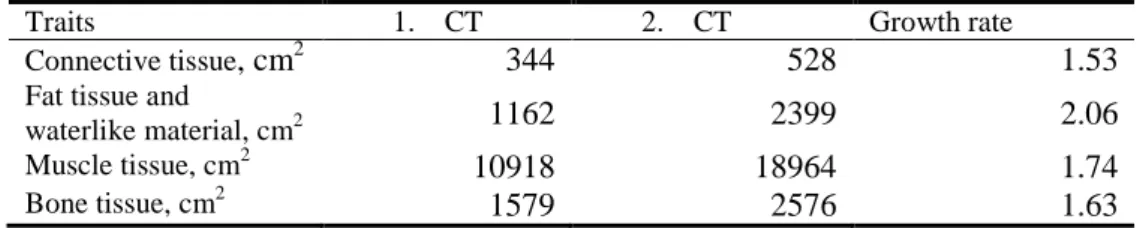
In both examined cases (7 and 98 days of age) the muscle, bone, and fat distribution as a proportion of total area did not changed significantly. At the same time, during the period between the two scanning dates the highest area incensement can be observed in case of the fat tissue, followed by muscle, bone and connective tissue (Table 4). The average area of longissimus (LD) at 12th rib increased from 15 to 23 cm2. In Table 5 the correlation coefficients are shown.
Table 4 Changes in area of different tissues during growth
Traits 1. CT 2. CT Growth rate
Connective tissue, cm2 344 528 1.53
Fat tissue and
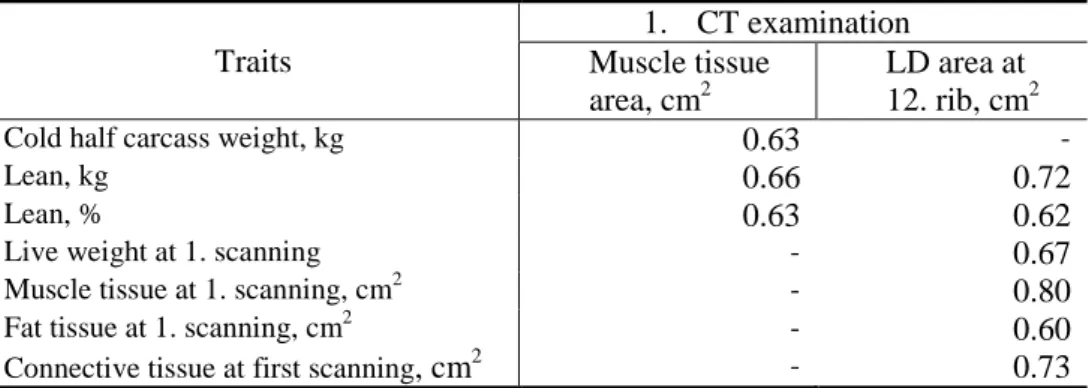
Table 5 Coefficient of correlation (r) between in vivo CT data and slaughter records
Traits
1. CT examination Muscle tissue
area, cm2
LD area at 12. rib, cm2
Cold half carcass weight, kg 0.63 -
Lean, kg 0.66 0.72
Lean, % 0.63 0.62
Live weight at 1. scanning - 0.67
Muscle tissue at 1. scanning, cm2 - 0.80
Fat tissue at 1. scanning, cm2 - 0.60
Connective tissue at first scanning, cm2 - 0.73 The muscle tissue of whole body at the first scanning correlated positively to weight of cold half carcass (r=0.63) and meat in the right half carcass (r=0.66). The muscle tissue area of longissimus (LD) at 12th rib showed a positive relationship (r=0.72) with lean meat content of carcass.
Conclusions
Certainly, the CT analysis can hardly be applied in commercial breeding practice due to the relatively high costs associated with CT and technological problems. However, it seems to be an obvious opportunity to use CT technology for selection to develop genetic progress in cattle production. Application areas of CT analysis of rib cuts can be on the one hand in progeny testing of different breeds for upgrading the meat yield, on the other hand the carcass value qualification can be achieved more objectively with the incorporation of CT data into the EUROP carcass grading system in the future. The results of in vivo CT examination of calves showed that calves with higher muscle tissue area at the age of 7 days will also have more meat in carcass. On the other hand the cross sectional scan of LD at 12th rib of calves can be used as a useful reference scan for the evaluation of meat of carcass.
Bibliography
1. Berg, E. P., Asfaw, A., M.R. Ellersieck (2002)- Predicting pork carcass and primal lean content from electromagnetic scans. Meat Sci. 133,139.
3. Bozó, S., Sárdi, J., Bárány, I., Bölcskey K., I. Györkös. (1999)- Body composition and EUROP evaluation in cattle carcass. Hungarian J. Anim.Prod. 637,638.
4. Johansen, J., Aastveit, A.H., Bjørg, E., Kvaal, K., M. Røe. (2006)- Validation of the EUROP system for lamb classification in Norway; repeatability and accuracy of visual assessment and prediction of lamb carcass composition. Meat Sci. 497,509.