Original Research Article
Desert hedgehog knockout mice show a reduced ratio of CD4+:CD8+ in
thymic developing T cells
Stephen Mwaura Kariuki
1, 2*
INTRODUCTION
The thymus provides an enabling environment for maturation of T cells in mammals. Among the cells that interact with the thymocytes during the process of development in the thymus are thymic epithelial cells and thymic stromal cells. The hedgehog (Hh) family of proteins (including sonic hedgehog, Indian hedgehog and
desert hedgehog) which are expressed by thymic stromal cells play an important signalling role in the thymus by binding to their cell surface receptor Patched1 (Ptch1) to release the Ptch1's repression of Smoothened (Smo) that enables the transduction of the Hh signal.1,2 This signalling is critical to the development of the T cell progenitor cells to functional CD4+ and CD8+ that ultimately migrate to the peripheral circulation.3,4 That
ABSTRACT
Background: Thymic differentiation is important and determines the strength of adaptive immunity in mammals in their later days in life. There are many factors that have been found to influence the development of T lymphocytes in the thymus and these include the effect of hedgehog signalling family of proteins. Immunologists and other basic science researchers have established the role of Indian hedgehog and sonic hedgehog in thymocytes development in the recent past, but the role of hedgehog is not well known. The aim of this study was to determine the influence of Desert hedgehog in CD4:CD8 ratio in developing thymocytes of mice.
Methods: Smashed thymocytes from mice deficient of Desert hedgehog and those with an intact gene coding for this protein were prepared in a cell suspension using standard procedures. The cell suspensions were stained using fluorochrome-labelled monoclonal anti: CD4-PE, CD8-TRI, CD3-FITC, CD5-FITC, CD44-PE and CD25-FITC (e-Bioscience). Samples were analyzed using a three-color flow cytometry. The flow cytometry-generated data was analyzed using flowjo (Treestar, USA). Statistical significance of the findings was determined using paired t-test and reported at p<0.05.
Results: There was a general upward trend on CD4+CD8+ double positive thymocytes in Desert hedgehog mice relative to WT controls. An analysis of CD4:8 ratio revealed a reduced ratio in Dhh KO mice compared to that of WT controls attributable to the finding that there might have been a preferential differentiation of DP CD4+CD8+ to SP CD4+ in Dhh knockout mice as demonstrated by percentage of thymic subsets. The results of this study were not statistically significant and this was blamed on the fewer number of animals used in the study.
Conclusions: Dhh might have a role arresting the DP cell subjects from differentiating preferentially to CD4+ T cells. To get statistically significant findings, these experiments could be repeated with a larger animal sample.
Keywords: Desert hedgehog, Thymocytes, CD4+ cells, CD8+ cells, CD4:8 ratios, Desert hedgehog knockout mice
1Department of Medical Laboratory Sciences, Mount Kenya University, Eldoret, Kenya
2Institute of Tropical Medicine and Infectious Disease, Jomo Kenyatta University of Agriculture and Technology
(JKUAT), Nairobi, Kenya
Received: 09 December 2017
Accepted: 20 February 2018
*Correspondence:
Dr. Stephen Mwaura Kariuki, E-mail: [email protected]
Copyright: © the author(s), publisher and licensee Medip Academy. This is an open-access article distributed under the terms of the Creative Commons Attribution Non-Commercial License, which permits unrestricted non-commercial use, distribution, and reproduction in any medium, provided the original work is properly cited.
means whether playing a negative or a positive role, Hh signalling is involved in T cell development in the thymus. But a contrasting previous attempt to assess expression of Dhh mRNAs in thymic stromal cells from human adult and fetal thymus yielded no fruits.5 We believe that this may have reflected the low sensitivity of the techniques used.
But away from the thymus, a mutation where the gene encoding Desert hedgehog (Dhh) protein is null leads to peripheral neuropathy with 46XY gonadal dysgenesis and minifascicle formation.6 In addition, these authors report that clinical features of Dhh knockout mice were similar to those of patients with Dhh gene mutations. As a result, these mutations lead to abnormality in the Hh pathway which are associated with developmental disorders while somatic mutations activate human cancer.7,8 Inhibition of Hh signaling has been found to slow the development and manifestation of basal cell carcinoma and restore the expression of MHC Class I by immune cells.9 Finally and interestingly, Dhh plays a role in spermatogenesis where reduced testosterone signalling in rodents leads to anxiety particularly in male Dhh knockout mice.10,11
It is well documented in literature that thymocytes develop in the thymus as follows: Developing T cells arrive in the thymus from the blood through which they travel from the bone marrow as T-cell precursors. In the thymus, the development proceeds with different stages marked by the presence or absence of c-kit, CD44 and CD25 cell surface protein molecules. This can be summarized as:- c-Kit+CD44+CD25- (DN-1), c-Kit+CD44+CD25+ (DN-2), c-Kit-CD44-CD25+ (DN-3), c-Kit-CD44-CD25- (DN-4), DP CD4+CD8+ and SP CD4+ OR SP CD8+ thymocytes12.
In the current study our aim was to investigate the role of Dhh in thymic differentiation and, in particular, to determine what role this member of the hedgehog family of proteins plays in T-cell development, all the way from CD4+CD8+ double positive thmocytes to the single positive (SP) CD4+ or CD8+ thymocytes in the thymic medulla. In this way, we were able to determine whether Dhh is involved in the regulation of positive or negative selection of thymocytes.
METHODS
We analyzed the percentage and actual numbers of thymic cells showing expression of the CD4+ and CD8+ markers in the homozygous (Dhh-/-) and wild type (Dhh+/+). The mice were first genotyped by PCR using DNA obtained from the tail to determine their genotypes (Data Not presented here) to confirm their genotypes. All experiments were carried out three times in order to acquire enough data necessary to do a statistical analysis to determine the significance of the results.
Flow cytometry
To investigate the thymic phenotypes of various sub-sets and see whether there was any significant variation from the norm (in homozygous Dhh-/- and wild type Dhh+/+ mice) fresh thymocytes were stained with fluorescent-marked mAbs to: CD4-PE, CD8-TRI, CD3-FITC, CD5-FITC, CD44-PE and CD25-FITC (e-bioscience). Cells from crushed murine thymuses were set up in suspension at 106/ml in Phosphate buffered saline/5% fetal calf serum/0.01% sodium azide and for each stain 105 cells were stained with the corresponding antibodies for 30 minutes on ice. Following this incubation, cells were washed with above medium and centrifuged for 5 minutes at 1300 rpm. They were then examined on a FACScan (BD Biosciences) in the laboratory. Live cells were gated by FSC/SSC profiles for analysis. The data presented (Appendix 1) is for more than three experiments.
Data analysis
Data from flow cytometry was entered into software called flowjo (Treestar U.S.A) for analysis where dot plots were produced in batch and printed for analysis. All data was simplified by setting the WT control to one and expressing every other data based on the wild type. This information is displayed here in graphs and charts generated using Microsoft excel. Statistical test was completed using dependent Student's t-test for each set of findings and any significance of the outcomes reported as anything equal or less than p=0.05.
RESULTS
Thymic subpopulations and CD4:8 ratios
Actual number thymic subsets relative to wild type.
Actual number of thymic subsets relative to WT.
CD4:8 ratio of Dhh KO relative to WT control.
% expression of CD3 on DPs of Dhh KO relative to WT.
Figure 1: A=Bar graphs of thymic subsets, DNs, DPs, CD4 and CD8 isolated from Dhh KO mice relative to the WT control; B=Bar graphs representing actual numbers of thymic cell populations DNs, DPs, CD4 and CD8 isolated from Dhh KO mice relative to WT control; C=Graph showing CD4:8 ratios of Dhh KO
mice relative to the WT control; D=Bar graph showing percentage of CD3 thymic cell surface markers of Dhh KO mice relative to WT control.
% representation thymic subsets relative to wild type.
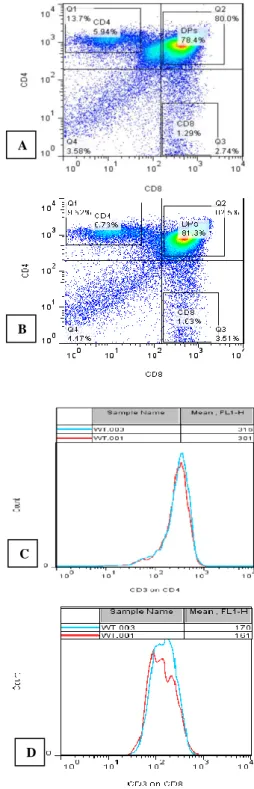
Figure 2: A=Dot plot of WT mouse showing percentages of thymic subpopulations as well as gates
of percentage expression of CD3 on CD4, CD8 and DPs B=Dot plot of Dhh KO mouse showing percentages of thymic subpopulations as well as gates
of percentage expression of CD3 on CD4, CD8 and DPs; C=Histogram showing MFI of CD3 on CD4 cells
from Dhh-/- mice – WT.003 compared to the WT control mice–WT.001; D=Histograms of MFI of CD3
on CD8 thymic cell population of Dhh KO - WT.003, compared to the Dhh+/+ mice – WT.001.
0 0.2 0.4 0.6 0.8 1 1.2 1.4 1.6
DNs DPs CD4 CD8
Dhh+/+
Dhh-/-0 0.5 1 1.5 2 2.5
DNs DPs CD4 CD8
Dhh+/+
Dhh-/-0 0.2 0.4 0.6 0.8 1 1.2
Average CD4:CD8 Ratio
Dhh+/+
Dhh-/-Series1 Series2
0 0.2 0.4 0.6 0.8 1 1.2
Dhh+/+
Dhh-/-CD3 on DPs CD3 on DPs
A
C
A
B
D
An analysis of expression of CD3 marker on the CD4+CD8+ thymocytes demonstrated a statistically non-significant increase on the Dhh knockout mice compared to their WT control counterparts (Figure 1D). Lastly, the Mean fluorescence intensity (MFI) of CD3 on CD4+ thymocytes and CD8+ was analysed for both Dhh-/- and Dhh+/+ mice and results presented on histograms (Figure 2C and 2D).
DISCUSSION
The processes of thymic proliferation and differentiation are tightly regulated by a number of signaling molecules and pathways within the thymic microenvironment. Past research has demonstrated a role for both Shh and Ihh in thymic T cell development, where hedgehog signalling was initially found to act as a negative regulator of T-cell development.5 Subsequent research however, found Shh to be a positive regulator of T cell development and Ihh was found to be both a positive and negative regulator of T cell development in the thymus.13,14 In the current study we investigated the role of desert hedgehog in thymic differentiation. We particularly analyzed in detail all thymic T cell subpopulations (CD4+ and CD8+) in Dhh-/- mice relative to WT control. Though there was little difference between Dhh-/- mice and the WT control based on their percentage representation on their live gates, when they were converted to actual numbers, the difference was relatively large (Figure 1B) but statistically non-significant. The statistical non-significance was a fact we blamed on the small number of experiments or animals involved.
In particular, the percentage representation of CD4+ cells was slightly increased in Dhh KO mice as compared to the WT control. On the other hand, actual percentage of CD8+ thymocytes was slightly lower in Dhh KO mice relative to the WT mice (Figure 1A). However, when converted into actual numbers as mentioned above taking into account thymic sizes of the mice, both CD4+ and CD8+ thymocytes demonstrated an upward trend on average, in Dhh KO relative to the wild type mice (Figure 1B). When we calculated CD4:8 ratio in all experiments, there was on average, a slightly reduced ratio in Dhh KO mice compared to WT control (Figure 1C), though this was not statistically significant (p=0.39). The reduced ratio was probably due to the increased percentage of CD4+ thymocytes, and decreased actual percentage of CD8+ thymocytes in Dhh KO mice relative to wildtype control (Figure 1A).
The absence of Dhh signal in KO mice could have lead to DP CD4+CD8+ preferential differentiation to CD4+ SP thymocytes and not CD8+SP thymocytes, though if Dhh protein is a negative regulator of T-cell development at these subsets, then this is inconsistent with the findings that CD8+ thymocytes contain a relatively high distribution of smo which is important in Hh signal transduction in developing T cells5. Further research
would therefore be needed to more accurately determine the role of Dhh at this point of thymic differentiation. Analysis of the mean fluorescence intensity (MFI) of CD3 on CD4+ and CD8+ SP thymocytes showed no significant difference on Dhh KO mice relative to the WT control. However, the trend was upward on the Dhh-/- mice compared to Dhh+/+ mice (Figure 1C, 2c and 2d). We also analyzed the percentage expression of CD3 surface markers on the DP CD4+CD8+ thymocytes isolated from Dhh-/- mice and compared this to the WT control (Figure 1D), as high level expression of CD3 on the cell surface is thought to correlate with those DP thymocytes undergoing the process of positive selection.15 These results also showed an upward trend in Dhh-/- mice but not an increase of statistical significance. These data are consistent with Dhh signaling being involved in down regulating expression of the TCR/CD3 complex on the cell surface. Furthermore, it has been hypothesized that the process of lineage commitment i.e. the maturation of CD4+8+ DP thymocytes to either the CD4 or CD8 SP is determined, in part, by the strength of the αβ-TCR signal, and that a weaker αβ-TCR favors differentiation of thymocytes to SP CD4-CD8+, while a strong αβ-TCR signal favors differentiation to CD4+CD8- SP thymocytes.16 We believe this factor could have played a role in this case, so as to have a reduced CD4:8 ratio (Figure 1C) in Dhh KO mice relative to the wild type control, as already demonstrated in the results section (Figure 1A) and discussed earlier in this section.
Expression of CD5 surface markers on the DPs, CD4+ and CD8+ was analyzed in Dhh KO and WT control (Data not shown). There was no significant difference in this analysis. Although its function on developing thymocytes is not very clear, researchers have shown that CD5 negatively regulates TCR signaling, using its cytoplasmic domain.17 However, the precise mechanism of this regulation is still under research and our data suggest that Dhh expression does not play a role in this process.
CONCLUSION
Desert hedgehog may have a role arresting the double positive (DP) thymocytes from differentiating preferentially to CD4+ T cells. But to get statistically significant findings, these experiments could be repeated with a larger animal samples.
ACKNOWLEDGEMENTS
Funding: No funding sources Conflict of interest: None declared Ethical approval:Not required
REFERENCES
1. Salda I, Crompton T, Furmanski AL, Ono M, Holl G. Sonic Hedgehog regulates thymic epithelial cell differentiation. J Autoimmun. 2016;68:86-97. 2. Azzi S, Treps L, Leclair HM, Ngo HM,
Harford-Wright E, Gavard J. Desert Hedgehog/Patch2 Axis Contributes to Vascular Permeability and Angiogenesis in Glioblastoma. Front Pharmacol. 2015;6:1-11.
3. Furmanski AL, Saldana JI, Ono M, Sahni H, Paschalidis N, D'Acquisto F, et al. Tissue-Derived Hedgehog Proteins Modulate Th Differentiation and Disease. J Immunol. 2013;190(6):2641-9..
4. Barbarulo A, Lau C, Mengrelis K, Ross S, Solanki A, Saldaña JI, et al. Hedgehog Signalling in the Embryonic Mouse Thymus. J Dev Biol. 2016;4(3):22.
5. Outram S, Varas A, Pepicelli C, Crompton T. Hedgehog signalling regulates Differentiation from double negative to double positive thymocytes. J Immun. 2000;13(4):584.
6. Umehara F, Mishima K, Egashira N, Ogata A, Iwasaki K, Fujiwara M. Elevated anxiety-like and depressive behaviour in Desert hedgehog knockout male mice. J Behav Bra Res. 2006;174:167-73. 7. Varjosalo M, Taipale J. Hedgehog : functions and
mechanisms. 2008: 2454-22.
8. Katoh Y, Katoh M. Hedgehog signalling pathway and gastric cancer. Cancer Biol Ther. 2005;4(10):1050-4.
9. Lehmann H, Felderer L, Frew IJ, Matsushita S, Levesque MP, Dummer R. Hedgehog Pathway
Inhibitors Promote Adaptive Immune Responses in Basal Cell Carcinoma. 2015: 1-10.
10. Sacedón R, Varas A, Frías MCG. Hedgehog proteins : 2003;22(1):17-26.
11. Rimkus TK, Carpenter RL, Qasem S, Chan M, Lo H. Targeting the Sonic Hedgehog Signaling Pathway : Review of Smoothened and GLI Inhibitors. Cancers (Basel). 2016;8(2):22.
12. Kuby J, Osborne B., Goldsby R., Kindt T. Kuby Immunology. 6th ed. U.S.A: Sara Tenney; 2007. 13. Shah D., Hager-Theodorides A. OS., Ross S., Varas
A, Crompton T. Reduced thymocyte development in sonic hedgehog knockout embryos. J Immunol. 2004;142(4):2296-306.
14. Outram S., Hager-Theodorides, A.L Shah D., Rowbotham, N.J Drakopoulou E, et al. Indian hedgehog (Ihh) both promotes and restricts thymocyte differentiation. Blood. 2009;113(10):2217-28.
15. Naramura M, Kole H., Ren-Juhu, Gu H. Altered Thymic Positive Selection and Intracellular Signals In Cbl-deficient Mice’. Immunol. 1998;95:15547-52.
16. Moore T., Zlonik A. T-cell lineage Commitment and Cytokine Responses of Thymic Progenitors. Blood. 1995;86(5):1885-60.
17. Azzam H, DeJarnette J, Huang K, Emmons R, Park CS, Sommers CL, et al. Fine Tuning of TCR Signalling by CD5. J Immun. 2001;166:5464-72.
Cite this article as: Kariuki SM.Desert hedgehog knockout mice show a reduced ratio of CD4+:CD8+ in thymic developing T cells. Int J Sci Rep