Magyar Agrárinformatikai Szövetség
Hungarian Association of Agricultural Informatics
Agrárinformatika Folyóirat. 2012. 3. évfolyam 2. szám Journal of Agricultural Informatics. 2012 Vol. 3, No. 2
The Agricultural Extension Contact in Bangladesh
Abu Zafar Mahmudul Haq1
I N F O
Received 01 Dec 2012 Accepted 15 Dec 2012 Available on-line 28 Dec 2012 Responsible Editor: Rajkai, K.
Kulcsszavak:Agricultural income, Bangladesh, extension contact, farmers, regression.
A B S T R A C T
The impact of agricultural extension contact on agricultural income has been conducted. The objectives of the study were to examine the actual benefits of agricultural extension services on productivity through an agricultural production function and if there are benefits for farmers to determine the type of farmers who benefited from the services. Fifty samples were collected from two sub districts of the Gazipur district in Bangladesh. The selection of the study sites and collection of the sample were done purposively. It is clarified from the study that extension services have significant contribution to raise agricultural income per unit of farm land. Results were derived through regression analysis. The results show that the contact coefficient of three times and above is higher (0.353) compared to the contact coefficient one and two times (0.234). It is observed that for a successful introduction of agricultural extension contacts in the country socio economic factors such as education of farmers, age and number of adult family members, ratio of agricultural income to total income should be taken into consideration.
1.Introduction
In order to raise farmer’s income in developing countries, governments and international organizations have been aggressively promoting agricultural extension services. According to a review of tens of researches by Birkhaeuser and Evenson (1991), on the whole the extension services have contributed to some extent to raise the amount of information and technology and thus the farmer’s productivity levels.
Studies of other scholars are also recognized (Jan et al, 2008, Michailidis 2008, Haq 2011). It is concluded that the extension workers visit only large and well situated farmers (Jan et al. 2008). Haq (2011) found that extension contact coefficient is particularly great (0.116) in the progressive villages compared to the extension contact coefficient (0.064) of the distant villages. The other one was based on the adoption of internet in agriculture of a region in Northern Greece (Michailidis 2008). But none of them concluded the required number of times extension contact.
There are a few research works on Bangladesh, which is one of the poorest countries in Asia. In the late 70s, an extension system involving 12000 workers was initiated under the denomination of “Training and Visit System”, hereinafter referred to as T & V system, (Hasanullah 1994, Ilah et al., 1996). Yet, whether or not that program actually contributed to raising farmer’s income, and, if yes, whether the benefits of the system were homogeneously distributed among the farmers have not been clarified enough. It is noted that agricultural extension services do not work satisfactorily and many farmers hardly ever received agricultural extension services(Rayners and Bruening 1996, Porimol et al. 2008, Daily Star, 2008, Rafiq 2009, Haq 2011). This means that agricultural extension services in Bangladesh still fail to reach its ultimate goal, which is to increase the farmers' socio-economic betterment. Investigating those issues toward developing further extension services that are more efficient is prime importance.
The current research, based on case studies on rice farming in the central area of Bangladesh, has two major objectives: (1) to assess the actual benefits of agricultural extension services on productivity through an agricultural production function, and (2) if there are benefits for farmers, to determine the types of farmers who are benefitted from the services.
The paper is structured as follows: Section 2 clarifies the method of analysis which adopted, building on previous researches and explains the data collection process. Section 3 examines the results of the agricultural function and the frequency of contacts. Finally, Section 4 presents the conclusions of the research.
2. Method of analysis and data collection
Many of the previous researches (Haq 2004) used the productivity index, representing the amount of production per unit of farmland, that is, the value added of the production, which is found by deducting production costs from gross income. By using that index, it is possible to convert the specific quantities of products into given amounts of money to be added up; therefore this represents a considerable analytical benefit. In the current research as well, the same index has been used. As to the survey area, because of livestock farming and fisheries represent a remarkably small portion of the total amount of production, this research based on the production index on crop production, namely grains, fruits and vegetables. Concerning the portion of home consumption, the amount was determined by applying the farm price to the actual quantities consumed.
As is commonly used in analyzing production functions, chemical fertilizers, farm buildings, irrigation facilities and family and hired labor should be considered as important investment functions (Evenson and Mwabu 2001, Moock 1976, Owens et al. 2003). In this research, the analysis was based on the converted amounts of each type of investment. As regard family labor costs, the estimation was based on the charges applied to hired labor.
The accumulated experience of the farmer, which is an important variable, is commonly determined either from the years of farming or the age of the farmer. According to several researches, such as Evenson and Mwabu (2001), there is a positive relationship between productivity income, and the amount of technical information possessed by the farmer.
Furthermore, considering the relationship between farm size and productivity, another variable explaining the farm size was added. According to Evenson and Mwabu (2001), large farms have higher productivity, but other studies (Moock 1976, Owens 2003) did not find a clear positive relationship between the two, or, even, presumed a negative relationship. Considering the above, it can say that there is no common agreement on the relation between farm size and productivity.
Finally, in the objective of this research, the most important variables are the activities of the agricultural extension services. In the Bangladesh Training & Visit system, farmlands are divided into blocks and the Training & Visit workers target the representative farmers of the different blocks, who are referred to as “contact farmers”. Although the Training &Visit workers can directly get in touch with ordinary farmers, they mainly train the contact farmers, who, afterward transmit the training results to the others farmers, in a progressive system. Considering this situation in Bangladesh, the current research used the frequency of contacts between ordinary farmers and Training & Visit workers or contacts farmers (the combination of Training &Visit workers and contact farmers is hereinafter referred to as “extension agents”).
contacts (1-2 times) and those who have three or more contacts (3+). Then a dummy variable was used for the estimation.
Except for the variable of the contact frequency, all the variables were evaluated with a logarithmic converter to avoid disparities of the figures.
Following the above reasoning, productivity is expressed in terms of amount of money, as follows,
LnCRIN=f (lnCHEM,lnIRRI,lnLABR,lnEXPE,lnAREA,EXT1,EXT2…(1)
CRIN: Monetary value of the production per ha [taka/ha (1$=Taka 80.40)].
CHEM: Costs of chemical fertilizers used per ha (taka/ha).
IRRI: Irrigation expenditures per ha (taka/ha).
LABR: Labor cost per ha (taka/ha).
EXPE: Experience of the head of the farm household (years).
AREA: Farm area (ha).
EXT1: Contact dummy (for 1-2 contacts per year=1; for others =0).
EXT2: Contact dummy (for 3+ contacts per year=1; for others =0).
The estimations were made according the most standard OLS (Ordinary Least Squares) method.
Next, let us explain the method of analyzing the contact frequency between the farm households and extension agents. In this paper, the number of contacts was considered as a subordinate variable and then the formula below was used to identify the contact frequency function.
NOEX=f (AGE, EDUC, RATE, NJOB)….. (2)
NOEX: Number of contacts per year.
AGE: Age of the head of the farm household.
EDUC: Years of schooling of the head of the farm household.
RATE: Share of agricultural income in total farm household income.
NJOB: Number of adult family members.
The farming income is determined by using the total monetary value of crop production from which the investment costs, labour cost, irrigation costs, land rents and the likes have been deducted. As for the total farm income, it was calculated by adding non farm income, such as income from office work, teaching and other part time works, to farm income. The share of agricultural income (RATE) represented 66.2 percent of the total.
higher the interest or acceptance of new technology is. According to a research conducted in India by Feder and Slade (1986), however, the higher the level of education is the more the use of extension services is.
Next, in large farms, the costs of acquiring technical information, estimated per unit of area, decreases, according to Feder and Slade (1984). Based on these results, it is possible to presume that the higher the share of farm income in total income is, the more willingness there is for the farmers to use the extension services to increase their agricultural income. Furthermore, the larger the number of adult family members is, the easier the contact with the extension agents is likely to be, since the family would more easily adjust to the necessary contacts with extension agents. Finally, the older the head of the household is, the higher the tendency to avoid the risk involved in acquiring new technologies is.
Considering the above reasoning , it can be inferred that the education level of the head of the household, the share of agricultural income in total income and the number of adult family members have positive correlation, while the head of the household’s age has a negative general effect.
Furthermore, considering the nature of the data, which is of a spread type, instead of the ordinary Least Squares (OLS), the QML-Poisson Count (Quadratic hill climbing), was adopted.
Data collection
In order to apply the above mentioned formula, a field survey was conducted in the Gazipur district, located at 30 kilometers in the North-East of Dhaka, the capital city of Bangladesh, between August and September 2001. This area is an average farming district in the central and northern areas of the country regarding productivity, farm size and production conditions. In this paper, two areas (Sadar and Sreepur subdistricts) of Gazipur district out of five sub districts were surveyed. A total of fifty farms were investigated through pre structured questionnaires. The selection of the two sub districts and sample collection were done purposively.
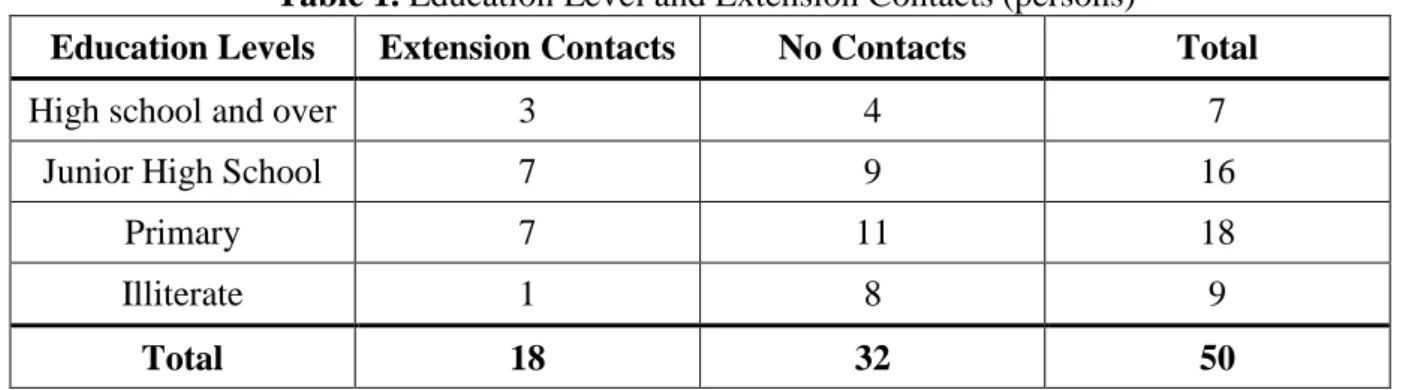
Following is a brief explanation of the survey families. The average age of farm household head is 43.1 years, the number of years of schooling of farm household head is 5.5 years, the farm area is 1.4 ha, and the size of family is 7.2 and the number of adult family members is 2.2. As for the contact frequency with extension agents, the average is 0.8 times per year and only 18 families were contacted out of the surveyed families (36 percent). The contacts were particularly low with families whose heads have low education levels; families that had no contact at all formed the majority, as can be seen in Table 1. It can be inferred therefore that the lower the education level is, the less contact with extension agents there is.
Table 1. Education Level and Extension Contacts (persons)
Education Levels Extension Contacts No Contacts Total
High school and over 3 4 7
Junior High School 7 9 16
Primary 7 11 18
Illiterate 1 8 9
Total 18 32 50
3. Results and Discussions
Gross Agricultural Income
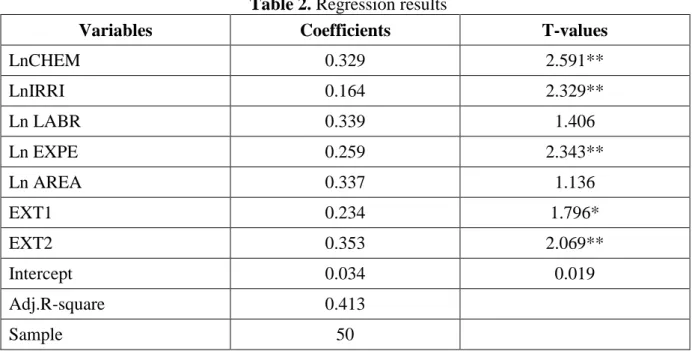
Let us start discussing the results with formula (1), shown in Table 2. The trend of each variable matches the result of previous researches, as for five out of the seven variables there is a significant difference at the 10 percent degree of probability. In addition, there are no apparent errors or irregularity problems.
Table 2. Regression results
Variables Coefficients T-values
LnCHEM 0.329 2.591**
LnIRRI 0.164 2.329**
Ln LABR 0.339 1.406
Ln EXPE 0.259 2.343**
Ln AREA 0.337 1.136
EXT1 0.234 1.796*
EXT2 0.353 2.069**
Intercept 0.034 0.019
Adj.R-square 0.413
Sample 50
*&** indicate 10% and 5% level of significance
The examination of the estimation results suggests the following points:
First, the coefficient for chemical fertilizer (CHEM) and irrigation expenditures (IRRI) per unit of farmland is positive at the 5 percent degree of probability. The coefficient for labor costs is not positive, although it does not show a significant statistical difference. Thus, it can infer that it is possible to realize high agricultural income per unit of land using a labor-capital-intensive management system.
Second, the coefficient for the experience of the head of the household is significant at the 5 percent degree of probability (0.259). Therefore, the accumulation of farm experience has a great contribution in improving land productivity.
Third, the coefficient for cultivated area (AREA) is 0.337, which is positive but not significant even at the 20 percent degree of probability. Therefore, it can be inferred that no strong relationship between management area and productivity per unit of farmland was found.
Finally, the coefficient for the dummy variable for contacts between the extension agents and the survey farms EXT1(1-2 contacts per year) and EXT2 (3 contacts or more per year) is significant at both 10 and 5 percent degrees of probability. The coefficient for EXT2 is particularly great (0.353), compared to EXT1 (0.234). Accordingly, it is possible to ascertain that the contacts with extension agents contributed to improve agricultural production per unit of farmland.
contribution to productivity. However, a frequency of more than 3 times per year showed no clear effects. Compared with the results of Owens et al. (2003) in Zimbabwe, the results of the current study suggest that in Bangladesh the contacts between extension agents and survey farmers seem more effective. This is apparently because the farmers who have more than three contacts could get case-by-case, suitable guidance concerning the application of fertilizers or prevention of insects and diseases.
Frequency of the Contacts with Extension Agents
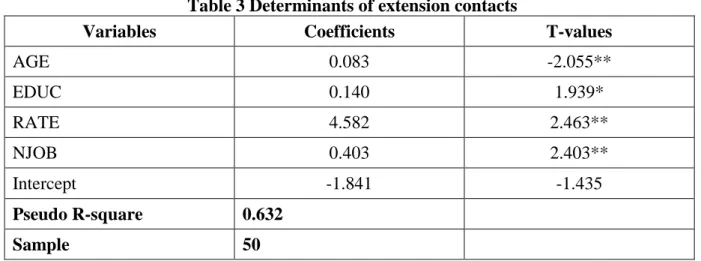
What kind of factors determines the frequency of contact between farmers and the extension agents? Clarifying this point is extremely important to promote more effective agricultural extension activity. The estimation results of the contact frequency function, based on formula (2) are presented in Table 3. The coefficient of the linear recurrence model being 0.632, the results can be considered highly appreciable.
Table 3 Determinants of extension contacts
Variables Coefficients T-values
AGE 0.083 -2.055**
EDUC 0.140 1.939*
RATE 4.582 2.463**
NJOB 0.403 2.403**
Intercept -1.841 -1.435
Pseudo R-square 0.632
Sample 50
*&** indicate 10% and 5% level of significance.
As appear in Table 3, the survey farms that fulfilled the following conditions have had frequent contacts with the extension agents.
(1) The coefficient for the age of the head of the farm household’s variable is significant at the 5 percent degree of probability (-0.083). This suggests that the younger the farmers are, the keener they are in acquiring new technologies and thus in contacting extension agents.
(2) The coefficient for schooling (EDUC) is 0.140, which shows positive effects at the 10 percent degree of probability and suggests that the heads of households with high education levels are more likely to get high frequency with the extension agents. The reason is that apparently they have more interest in agricultural technologies and effectively adjust to changes in their environment. According to Huffman (1974), extension activities help farmers who did not acquire enough school education to improve their ability to adjust. However, the results of the current research clearly show that farmers with low education levels do not benefit from extension services. Therefore, the difference in the education background of the farmers influences the effects of extension services, and thus magnify the economic gap between farmers, in a vicious circle.
hoping to increase their gross income, are likely to multiply their contacts with agricultural extension agents.
(4) The coefficient for the number of adult members in the farm household (NJOB) is significant at the 5 percent level of probability (0.403), suggesting frequent contacts with agricultural extension agents. Judging the estimations of such a contact frequency function, it can be pointed out that the education level of the farmers and their age are important factors to the degree of dependency on agricultural income and the number of adult members in the farm household.
4. Conclusions
This research was aimed at clarifying the effects of agricultural extension services on improving farmers’ productivity, with the example of one district of Bangladesh, emphasizing the relevance of contact frequency between farmers and extension agents (workers of extension services and representative of farming blocks, who directly receive training from the extension workers and, sometimes along with them, train other farmers in turn). The results of the study can be summarized as follows:
First, from the estimated results of the production function, it was clarified that the more the frequency of contacts between extension agents and farmers, the higher the productivity is. This clarifies that the extension services have positive effects in improving farm income.
Second, by examining the factors determining the contacts between extension agents and farmers, a positive correlation was found with the education level, the share of the agricultural income in the total farmhouse income, and the number of adults in the farm household. On the other hand, the head of the farm household’s age is inversely proportional to the frequency of contacts with the extension agents. From these facts, it was clarified that the agricultural extension services do not work well enough for elder farmers, especially those with low education levels.
Considering the overall estimations, it has been possible to ascertain that agricultural extension services positively contribute to increasing farmers’ income to some extent, but there is a necessity to develop the system toward more efficiency for elder farmers with low education levels, which is an issue that is subject for further studies.
References
Birkhaeuser D, Evenson RE. 1991,The economic impact of agricultural extension: A review. Economic Development and Cultural Change. 39(3):607-650.
Daily Star. 2008. October;Pest attack affects Aman paddy yield in Netrokona, Patuakhali. Star Business Desk. Daily Star. 2008. September, Aman turning yellowish in Rangpur. Star Business Desk.
Evenson R, Mwabu G. 2001, The effect of agricultural extension on farm yields in Kenya. African Development Review. 13(1):1-23.
Feder,G, Slade R. 1984, The acquisition of information and the adoption of new technology. American Journal of Agricultural Economics. 66(3):312-320.
Feder,G, Slade R. 1986, A comparative analysis of some aspects of the training and visit system of agricultural extension in India. Journal of Development Studies, 22(2): 406-422.
Hassanullah M. 1994, Planning and performance: The case of agricultural extension service. Journal of Business Administration. 20(1&2):106-125.
Haq AZM. 2004, The role farmers’ education and agricultural extension services in Bangladesh. Ph.D diss. Tottori U. 20-30.
Huffman WE. 1974, Decision making: The role of education. American Journal of Agricultural Economics. 56(1):85-97.
Ilah SM. 1996,Sharifullah AK, Ahsan K. A comparative study on model farmer and training and visit systems of agricultural extension in Bangladesh. Journal of Rural Development. 26(2):1-32.
Jan I, Naushad K, Shaukat SN. 2008. June., Econometric analysis of the determinants of participation in agricultural extension services: An example from Pakistan. Journal of Extension Systems 2008 June; 24(1):63-75.
Michailidis A. 2008, Adoption of internet in agriculture. Journal of extension Systems 2008 June; 23(1):1-13. Moock PR, 1976, The efficiency of women as farm managers: Kenya. American Journal of Agricultural Economics. 58 (5):831-835.
Owens T, Hoddinott J, Kinsey B. 2003, The impact of agricultural extension on farm production in resettlement areas of Zimbabwe. Economic Development and Cultural Change. 51(2):337-357.
Porimol P, Sarker R, Islam A. New rice varieties smile at monga hit people. Star Business Desk in The Daily Star 2008 October.