TECHNICAL UNIVERSITY OF CLUJ-NAPOCA
ACTA TECHNICA NAPOCENSIS
Series: Applied Mathematics, Mechanics, and Engineering Vol. 62, Issue IV, November, 2019
SOUND ABSORPTION COEFFICIENT MEASUREMENT SET-UP
BY USING LABVIEW AND A SIMPLE IMPEDANCE TUBE
Iulian LUPEA
Abstract: In the article the normal sound absorption coefficient by using the standing wave ratio method is presented employing a particular construction measurement set-up. A simple design of a Standing Wave Apparatus is proposed. The air in the tube is excited using a loudspeaker and a sinusoidal signal in the frequency band permitted by the tube. The pressure is measured along the tube axis while the microphone is displaced to pick the maximum and the minimum pressure of the standing wave close to the sample holder. A LabView application is driving the tones generation, acquisition the sound pressure, process the data and graph the normal sound absorbing coefficient versus frequency on the screen.
Keywords: sound absorption coefficient, standing wave, sound wave ratio, LabView.
1. INTRODUCTION
Sound absorbing materials are used in architectural acoustics, automobile interiors, studios and other applications. The measuring device based on the Kundt's tube for determining the acoustic performance of sound absorbing materials and structures is presented. This tube is important and used in the frame of ISO 10534-1, a classical method named
'standing wave ratio', that uses a single probe microphone. A second and much faster approach, described in ISO 10534-2, the
'transfer function method', uses two
microphones and the impedance tube. These methods are proper and often used to measure the normal sound incidence case.
The sound absorption coefficient can be measured by using a standing wave tube or an impedance tube. The interior of the rigid tube is occupied by the air at the ambient pressure and temperature. A loudspeaker is placed at one end of the tube and the sample to be measured is at the opposite end. A compression sound wave (traveling wave) propagates inside the tube in one direction, reflects on the sound absorbing
material (placed against a rigid termination) and propagates in the opposite direction resulting a pseudo standing wave with maxima and minima of pressure in fixed positions. A transfer of energy exists from the loudspeaker to the opposite end because the material is absorbing energy and the rest is reflected from the rigid termination. In case the termination is rigid, the reflected wave is of the same amplitude and the standing wave presents nodes (zero) and anti-nodes of pressure.
Sound absorption coefficient is used to evaluate the sound absorption efficiency of small samples of the sound absorbing materials. The normal-incidence sound absorption coefficient (α) of a material as the ratio of the absorbed sound power by a surface and the incident sound power of the incident sound plane wave, is to be measured. It is the ratio of absorbed energy and incident energy, denoted by α. If the acoustic energy is absorbed entirely, then α = 1.
absorber surface area multiplied by the sound absorption coefficient of each surface.
i n
i
r s
A =
1 α (1)where, si and αi are the surface area and the
sound absorption coefficient of the i-th area or wall respectively.
A single dimensional wave guide of length L and the circular cross section (of diameter D), has the inner air excited by sinusoidal plane waves by using a loudspeaker at one end of the tube [2…6]. At the opposite end, a complex impedance Zm of a sound absorbing material is to be evaluated. A microphone in the tube is used to measure the superposed forward and the backward traveling waves in that spot, in order to determine the magnitude impedance and the sound absorption coefficient. No losses along the length of the tube are assumed.
The generated sound plane waves in the tube are partially absorbed and partially reflected by the material samples and phase differences for the incidence and reflected waves are observed. Standing waves (2) are generated into the tube after the overlapping of the incidencepi and the reflected pr waves, hence alternative maximum sound pressure pmax (antinode) and
minimum sound pressure pmin (node) are
distributed along the tube length:
) ( ) ( )
,
( j t kx
c kx t j r
i p Ae Be
p t x
p = + = ω− + ω+ (2)
where A is the amplitude of the incident wave (null phase) and Bc is the complex amplitude of the reflected wave. One can write jθ
c Be
B = ,
where B is the magnitude of Bc and θ is the shift in phase of the reflected wave in the
absorbing material. The resulted sound pressure is:
t j jkx j jkx
e e Be Ae
t x
p( , )=( − + θ ) ω (3)
After some calculations on the pseudo standing wave pressure relation [8], [9] the maximum pressure and the minimum pressure along the tube, are as follows:
B A
p = +
max pmin = A−B (4)
The standing wave ratio (SWR) value is important for the sound absorption coefficient and the mechanical impedance derivation of a tested material. SWR does not provide phase information being a scalar quantity and is defined [8], [9] as the ratio (5) of the maximum pressure amplitude and the minimum pressure amplitude:
SWR =
min max/ p
p (5)
where pmax and pmin are adjacent extremes along the tube, closer to the material. Between two adjacent pressure maximum and minimum, the distance is λ/2 of the exciting harmonic wave. During the experimental determination the maximum sound pressure pmax=A+B and
the minimum sound pressure pmin=A-B are
measured by moving the microphone along the tube axis and observing the pressure values.
SWR = B A
B A
− +
(6)
The reflection coefficient (r)
A B
r= / (7)
and the sound power reflection coefficient 2
r
R= are used for sound absorption coefficient calculation (α):
2 1−r
=
α (8)
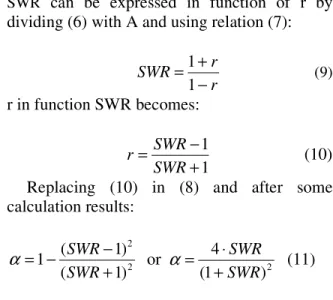
SWR can be expressed in function of r by dividing (6) with A and using relation (7):
r r SWR
− + =
1 1
(9)
r in function SWR becomes:
1 1
+ − =
SWR SWR
r (10)
Replacing (10) in (8) and after some calculation results:
2 2
) 1 (
) 1 (
1
+ − −
=
SWR SWR
α or 2
) 1
( 4
SWR SWR
+ ⋅ =
α (11)
The normal to the surface sound absorption coefficient is calculated based on the SWR (2).
The limits of the usable frequency interval for a given standing wave tube (L, D) are derived from the relation (10) [9]:
D f
L≥250/ min+3 and D≤0.58v0/ fmax (10)
where: v0 =343.3 T/293 [m/s], T is the temperature Kelvin in the tube.
The sound absorption coefficient of the materials or the absorbing structure is between 0 and 1. The closer to 1 is the sound absorption coefficient, the better the sound absorbing property of the material is.
If the average ratio of sound absorption coefficient at the six frequencies (125Hz, 250Hz, 500Hz, 1000Hz, 2000Hz, 4000Hz) is more than 0.2, the material can be classified as a sound-absorbing material [7].
The excitation sound wavelength is important to be long compared to the diameter of the tube. Hence, the wave propagates along the axis of the tube, and the one dimension approximation for the sound propagation is acceptable.
2. THE MEASURING SYSTEM SET-UP
The design of a lowcost Standing Wave Apparatus is proposed. The acquisition system is based on the National Instruments dynamic acquisition board PCI 4451 with simultaneous
sampling on the input channels and two output channels.
One channel is used to generate the excitation signal for the loudspeaker, amplified by a Brüel & Kjær Type 2706 Power Amplifier. To keep track of the sound pressure along the tube a prepolarized free-field microphone BSWA MPA416 1/4" with ICP preamplifier is employed which is connected to the input channel.
A signal conditioned bloc National Instruments, type BNC-2140 is interfacing the acquisition board (one side) and the microphone and the power amplifier (on the other side, Fig. 2).
An output channel and an input channel of the acquisition board are used. The tube construction (Figure 3) is composed of a straight plastic tube portion (A) followed by an elbow tube at 135degree and a larger diameter shorter in length tube portion (B) in which the loudspeaker is fitted. The elbow portion is
Fig. 3. Long tube A (left), elbow, large tube B (speaker inside), thin tube for microphone Fig. 2. Signal conditioning unit (right) and the
presenting a small hole into the wall and a thin plastic tube (Figure 1) can be translated along the axis of the large tube.
The microphone is placed inside the thin tube at one end of it and the cable is running into the tube and finally connected to the acquisition board input channel.
A second short tube (C) (same diameter as A) is employed to keep inside the rigid termination (a cast iron cylinder) followed by the sound absorbing material or structure at one end of the short tube (C).
The rigid termination (a metal plug) can be positioned along the tube C in order to have control on the air layer of the sound absorbing structure (Fig. 4) or to adjust the sound absorbing structure thickness.
Tubes A and C of identical diameters are in touch at their ends and are kept snugly together by an external tube (D) and two rings.
A thermometer is used to measure the temperature in order to have the correct sound speed.
The frequency interval in which the sound absorption can be evaluated is:
u l f f
f < < (11) The upper sound should have the wavelength larger to almost two times the tube diameter:
u D≤λ
⋅
) 58 . 0 / 1
( (12)
From v0= fu∙λu results:
D v
fu≤0.58⋅ 0/ (13) At 20° the sound speed is v0=343m/s. For a tube inner diameter of D=0.104m the upper frequency is fu ≤1912.8Hz and λu=0.179 m.
For a tube geometry (L, D), where L is the distance between the loudspeaker and the material sample, the lower sound frequency from equation (10) is:
) 3 /( 250 L D
fl ≥ − (14)
For L=1m, results fL≥363.4Hz.
For excitation, sine waves or pure tones which are of interest, are used. The frequency of the signal is increased in steps from one central frequency of a third octave to the next one starting from 400 Hz and ending to 2kHz. These are covering the frequency band available for the construction diameter of the tube.
The Standing Wave Tube allows the measurement of the maximum pressure (A + B), minimum pressure (A - B) and the distance from the sample to the first minimum, (L - x) or the distance between two adjacent extremes.
3. THE LABVIEW APPLICATON
Two channels of the PCI 4451 acquisition board are programmed, one output channel for the signal generation to the loudspeaker and one input channel for the pressure acquisition of the standing wave.
A prepolarized free-field microphone BSWA 1/4" with ICP preamplifier is used. Signal generation is started by calling AO Config.vi, AO Write (zero values array) and AO Start.vi functions [10]. Sound pressure acquisition is started by calling similar Labview functions.
A While loop is started. At each iteration a sinusoidal signal is generated (Figure 5) at a prescribed frequency f (selected from a pop-up menu) for 500 ms and the pressure value is recorded for 500 ms, both graphs being displayed in a Front Panel window. For at least one cycle the microphone is required to not be moved along the tube, hence the plastic rod (Fig. 3) to which the microphone is attached is not displaced by the operator.
The acquired signal is displayed and is presenting the same number of periods as the excitation signal generated and played by the loudspeaker. The quality of the acquired signal Fig. 4. Probe side: screw for rigid termination
is observed by zooming a couple periods in the graph window.
For low frequency generated signal the wavelength is relatively large and the microphone displacement along the tube length in order to peak the first pressure node and the first pressure antinode (maximum) is realized in good conditions.
For sound frequencies placed at the upper frequency span (associated to the tube diameter) the wavelength is smaller, the distance from the pressure node to the adjacent pressure antinode is relatively short and the microphone displacement realized by the operator is to be done with increased attention. After a small microphone displacement for a short time it is advised the sensor to be kept in a fixed location to have a good reading of the pressure value (by using the cursor associated to the graph).
After the maximum and the minimum pressure readings are done, the application is calculating and displaying the sound absorption coefficient on the screen.
The While loop is interrupted. The next excitation sound value is selected from the list of third octave frequency values and the process is repeated (a For Loop), resulting the whole sound absorption coefficient variation versus frequency graph.
4. CONCLUSIONS
The sound absorption coefficient measurement by using the standing wave ratio method is presented.
A particular self-construction measurement set-up and a particular design of a simple, at low cost and acceptable precision, Standing Wave Apparatus are proposed.
The air in the tube is excited using a loudspeaker placed in a large diameter and short tube which is connected to the main (standing wave tube) through an elbow tube. Through a hole in the elbow a thin plastic tube containing the microphone and the cable can be displaced by the operator in order to read the sound pressure.
The acquisition system is based on a NI PCI 4451 acquisition board, a signal conditioning unit, the power amplifier, the loudspeaker and the microphone.
A Labview application is developed in order to manage the hardware, to calculate and to graph the sound absorbing coefficient of the material or the sound absorbing structure versus frequency (third octaves).
5. REFERENCES
[1] Bădărău, E., Grumăzescu, M., Bazele acusticii moderne, Ed. Acad. RPR, 1961. [2] Lupea, I., Considerations on the Helmholtz
resonator simulation and experiment, Proceedings of the Romanian Academy, Series A-Mathematics Physics Technical Sciences Information Science Volume: 13 Issue: 2, pages: 118-124, Apr-Jun, 2012 [3] Lupea, I., Experimental validation of
acoustic modes for fluid structure coupling in the car habitacle, Proceedings of the Romanian Academy, Series A-Mathematics Physics Technical Sciences Information Science Volume: 18, Issue: 1, Pages: 326-334 Ian-Mar 2017, Issn: 1454-9069
[4] Lupea, I., Vibration and noise measurement by using Labview programming, Casa Cărţii de Ştiinţă, Cluj-Napoca, 2005,
measured by using standing waves, Acta Technica Napocensis, Series: AMME, Issue III, Vol. 61, 2018,
[6] Lupea, I., The length of flexible coiled tubes measured by using a sound card and the FRF, Acta Technica Napocensis, Series: AMME, Issue III, Vol. 63, 2019.
[7] Lupea, I., Considerations on the outdoor noise barriers design and simulation, Acta Technica Napocensis, Series: AMME, Issue III, Vol. 60, 2017
[8] Russell, D., Absorption coefficients and impedance, www.acs.psu.edu/drussell/Demos/ SWR/ AbsorptionCoeff.pdf
[9] ** SR EN ISO 10534-1, Determination of sound absorption coefficient and impedance in impedance tubes, Part 1: Method using standing wave ratio, (in Romanian) 2005. [10] ** ni.com, Labview, National Instruments
Sound and vibration measurement suite, 2015.
Măsurarea coeficientului de absorbţie acustică folosind un sistem de achiziţie, un montaj simplu de tuburi şi o aplicaţie Labview
Rezumat: In articol este prezentat un aparat pentru determinarea coeficientului de absorbţie acustică a eşantioanelor de material sau structuri fonoabsorbante prin metoda raportului de undă staţionară. Aparatul se compune dintr-un sistem de achiziţie şi un sistem simplu de tuburi de plastic pentru realizarea interferometrului acustic incluzând zona de montare a probei şi mecanismul (şurub) pentru translaţia terminaţiei rigide. Componentele hard ale sistemului de achiziţie sunt placa de achiziţie NI PCI 4451, blocul de condiţionare a semnalelor, difuzorul, amplificatorul asociat B&K 2706 şi un microfon. Sistemul este gestionat de o aplicaţie program Labview dezvoltată in acest scop. Se obţine graficul variaţiei coeficientului de absorbţie acustică în funcţie de frecvenţă.