Neighborhood
language
isolation
and
depressive
symptoms
among
elderly
U.S.
Latinos
Julia
B.
Ward,
PhD,
MPH
a,b,c,
Sandra
S.
Albrecht,
PhD,
MPH
b,d,
Whitney
R.
Robinson,
PhD
a,b,
Brian
W.
Pence,
PhD
a,
Joanna
Maselko,
ScD
a,b,
Mary
N.
Haan,
DrPH,
MPH
e,
Allison
E.
Aiello,
PhD,
MS
a,b,*a DepartmentofEpidemiology,GillingsSchoolofGlobalPublicHealth,UniversityofNorthCarolina,ChapelHill,ChapelHill,NC b CarolinaPopulationCenter,UniversityofNorthCarolina,ChapelHill,ChapelHill,NC
c Social & ScientificSystems,Inc.,Durham,NC
d DepartmentofNutrition,GillingsSchoolofGlobalPublicHealth,UniversityofNorthCarolina,ChapelHill,ChapelHill,NC e DepartmentofEpidemiologyandBiostatistics,UniversityofCalifornia,SanFrancisco,SanFrancisco,CA
a r t i c l e i n f o
Article history:
Received 10 May 2018 Accepted 20 August 2018 Available online 24 August 2018
Keywords:
Segregation Neighborhood Depression Education Language Mexican Americans Elderly
a b s t r a c t
Purpose: Neighborhood segregation related to cultural factors, such as language use, may influence
elderly Latino depression. We examined the association between neighborhood-level Spanish language segregation and individual depressive symptoms among elderly Latinos.
Methods:We linked U.S. Census language use data with geocoded population-based data from 1789
elderly Latinos (mean age¼70.6 years) participating in the Sacramento Area Latino Study on Aging (1998
e2008). Neighborhood language segregation was measured with the Index of Concentration at the
Ex-tremes, which demonstrates the extent to which residents are concentrated at extremes of deprivation and privilege. Wefit two-level generalized linear-mixed models with random intercepts for census tracts to quantify the association between neighborhood-level language segregation and depressive symptoms, adjusting for identified confounders.
Results:After adjusting for age, sex, and nativity, residents of highly segregated Spanish-speaking
neighborhoods had more depressive symptoms than those in highly segregated English-only-speaking neighborhoods (b¼ 4.410; 95% confidence interval [CI]¼ 6.851 to1.970). This association was largely attenuated upon adjustment for individual-level education (b ¼ 2.119; 95% CI¼ 4.650 to 0.413).
Conclusions: Linguistically segregated communities may benefit from targeted outreach given the high
depression prevalence in these neighborhoods. Furthermore, ourfindings suggest that limited access to fundamental social protections, such as education, may drive the segregation-depression association among U.S. Latinos.
Introduction
Across the United States, older Latinos report the highest levels of depression compared with other populations [1]. Residential segregation may play a key role in the mental health of historically marginalized populations, such as U.S. Latinos. Over the last decade, Latino residential segregation has increased in the United States,
with Latinos often residing in ethnic enclaves[2]. However, most studies on residential segregation and mental health have been conducted among non-Hispanic white and black communities.
Among black communities, segregation has been found to adversely impact numerous health outcomes; this association is thought to exist because the existence of such ethnically homog-enous neighborhoods reflects structural discrimination that con-strains where an individual can reside and reinforces racial hierarchy and white privilege[3]. The mechanisms driving segre-gation may differ for Latino communities compared with black communities, however, and may therefore impact Latino health differently. Latino segregation may reflect preference, especially among immigrants, to reside among co-ethnics, which affords
*Corresponding author. Department of Epidemiology, Gillings School of Global
Public Health, University of North Carolina, Chapel Hill, 2101C McGavran-Greenberg
Hall CB #7435 Chapel Hill, NC 27599. Tel.:þ1 919-966-2149; fax:þ1 919-966-2089.
social and cultural resources and eases the transition into the new environment [4]. However, like black individuals, Latinos also experience housing market discrimination, and the cultural and social resources provided by living among co-ethnics may not sufficiently offset the adverse effects of the poverty that often ac-companies segregation[5].
Past segregation studies of depressive symptoms among U.S. Latinos have utilized neighborhood racial/ethnic composition as a proxy for more direct cultural segregation measures[6e8].
How-ever, neighborhood segregation in relation to the cultural factor of language use may be especially salient for the mental health of elderly Latinos[9e11]. Qualitative studies interviewing U.S. Latinos
indicate that inadequate proficiency in the predominant language is viewed as a life stressor, emphasizing the trauma, loneliness, and isolation associated with their language preference:“The language difference is traumatizing; it is more difficult when you are old,”and
“I felt lonely. I couldn't talk to anyone[12].”Language use is linked to mental health through its influence on resource acquisition, crea-tion of social ties, maintenance of familial shared values, and a sense of belonging or isolation from one's community [9,11]. English proficiency has been shown to increase access to health information and mental health services[13,14]. Furthermore, language use may more accurately capture neighborhood cultural orientation because even if neighborhood Latino composition remains stable over time, the linguistic makeup may change more quickly.
Nevertheless, factors with greater face validity as cultural orientation measures, such as language use, have not been suffi -ciently examined at the neighborhood level[15]. Although a few studies have described an association between neighborhood-level language isolation and diet and lower BMI[15,16], studies assessing neighborhood language isolation in relation to mental health are currently nonexistent.
Furthermore, the direction of the association between neigh-borhood linguistic characteristics and depression may depend on individual-level language preference. For example, discordance between an individual's language preference and the predominant language of the surrounding neighborhood may impact mental health by causing social exclusion, discomfort, and emotional distress[17,18]. In addition, for English-speaking Latinos, residing in predominantly Spanish-speaking neighborhoods may represent blocked social and spatial mobility and thereby also contribute to worse mental health[19,20]. However, studies aiming to assess the impact of neighborhood Latino composition and segregation on mental health adjusted for individual-level cultural factors, such as language preference, which may have masked the effect of neigh-borhood composition and segregation on mental health by ignoring the potential modifying role of language preference[8,21]. To address the gaps in the existing literature, this study utilized geocoded data from the Sacramento Area Latino Study on Aging to examine the association between neighborhood-level Spanish language segregation and individual depressive symptoms among an elderly Latino population. We further examined whether the influence of neighborhood-level language segregation varied by individual-level language preference.
Material and methods
Study population
Participants in this analysis were members of the Sacramento Area Latino Study on Aging (SALSA), taking place from 1998 to 2008 [22]. SALSA is a longitudinal study of 1789 elderly Latinos, pre-dominantly of Mexican origin. SALSA's study design has been described previously[22]. Briefly, participants were self-identified Latinos aged 60þ years at baseline and residing within
Sacramento, Yolo, Sutter, Solano, San Joaquin, and Placer Counties in California[22]. The sample was representative of older Latinos residing in the target area. During home visits, participants re-ported health conditions, lifestyle, and sociodemographic factors, and trained bilingual interviewers collected clinical data. This analysis linked geocoded baseline SALSA data with language data from the 2000 U.S. Census. Informed consent was obtained from all participants, and study procedures were approved by institutional review boards at participating institutions. Furthermore, the study was performed in accordance with the ethical standards laid down in the 1964 Declaration of Helsinki and its later amendments.
Measures
Depressive symptoms
Depressive symptoms were measured with the Center for Epidemiological Studies Depression Scale (CES-D)[23]. The CES-D is a 20-item 4-point Likert-type scale assessing the extent to which respondents experienced depressive symptoms during the prior week[23]. This scale has been validated in Spanish-speaking and older Latino populations[24e27]. The CES-D is based on
clin-ical depression symptoms and correlates well with other depres-sion scales[23]. CES-D scores range from 0 to 60[23].
Neighborhood-level language segregation
We utilized the Index of Concentrations at the Extremes (ICE) to measure neighborhood-level language segregation. The ICE was developed to demonstrate the extent to which an area's residents are concentrated at the extremes of deprivation and privilege [28,29]. The index ranges from1 to 1; a value of1 indicates that 100% of the population is concentrated in the least privileged group, and a value of 1 indicates that 100% of the population is concen-trated in the most privileged group[28,29]. The ICE was originally developed for use with economic measures but has recently been utilized to assess extreme concentrations of race and other cultural factors[28e30]. The ICE is preferable to other segregation measures,
such as the Index of Dissimilarity, because it distinguishes which group is concentrated at the extreme. Neighborhoods that are 100% Latino would have the same Index of Dissimilarity as neighborhoods that are 100% white; the ICE appropriately assigns these two neighborhoods distinct scores[28,29]. In addition, unlike the Index of Dissimilarity or Isolation Index, the ICE can be meaningfully used with smaller geographic units, such as census tracts[28e30].
We utilized census tractelevel language use data from the 2000 U.S. Census to calculate the language segregation ICE variable. The ICE was calculated as follows:
ICEi¼
EiSi
Ti ;
where Eiis the number of English-only speakers in census tract i, Si
is the number of Spanish speakers in census tract i, and Tiis the
total population for whom language preference is known in census tract i[28]. The numerator was determined utilizing the 2000 U.S. Census questions: (1) “Does this person speak a language other than English at home?”and (2)“What was this language?”A value of1 indicated an entirely Spanish-speaking census tract, and a value of 1 indicated an entirely English-only-speaking tract.
Statistical analysis
potential key confounders of the neighborhood segregation-depression association. To quantify the association between neighborhood-level segregation and CES-D scores, wefit a two-level generalized linear mixed model with a random intercept for each census tract utilizing PROC MIXED in SAS 9.4 (SAS Institute, Inc., Cary, NC). Level 1 represented within-neighborhood variation in CES-D scores; level 2 represented between-neighborhood vari-ation in CES-D scores due to neighborhood language segregvari-ation. We calculated intraclass correlations (ICCs) to examine the pro-portion of the total variance in CES-D scores accounted for by neighborhood clustering.
Functional form assessments indicated the best model forms for continuous variables relative to depressive symptoms. We compared each model graphically with the Loess smoother and used likelihood ratio tests and Akaike Information Criteria to compare nested and non-nested models, respectively. This assess-ment indicated that the continuous, linear functional form was appropriate for the ICE, age, and education variables. However, ICE quartiles were also utilized inTable 1for ease of interpretation of descriptive characteristics.
The association between language segregation and depressive symptoms may differ by individual-level language preference[31]; therefore, we assessed a cross-level interaction between individual-level language (English or Spanish) and neighborhood Spanish language ICE. We examined the Wald test for an interaction term between individual- and neighborhood-level language with a significance criterion of P0.1. We further examined effect esti-mates stratified by individual-level language preference.
Results
Participants had an average age of 70.6 years, and 58.4% were female (Table 1). In addition, 57.8% identified Spanish as their pri-mary language, and 51.0% of participants were foreign-born. The average number of years in the United States among foreign-born participants was 37.6, ranging from 1 to 85 years. Average
education was 7.2 years, with 70.8% of participants completing <12 years of education. The average CES-D score was 10.0, and 25.5% had a CES-D score16. Compared with participants living in neighborhoods most segregated toward Spanish use (i.e., the lowest Spanish language ICE quartile), those living in neighbor-hoods most segregated toward English-only use were more likely to be U.S.-born, consider English their primary language, have more years of education, have lived in their current neighborhoods for less time, and have lower CES-D scores.
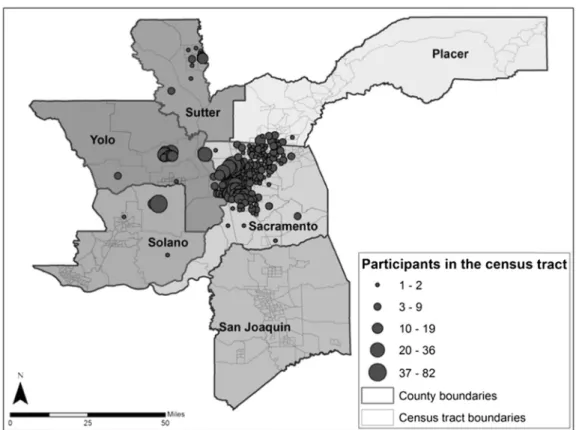
Participants resided in 249 of 586 census tracts comprising the six targeted counties (Fig. 1). There was a mean±SD of 7.1±9.2 participants per tract (range: 1e82). Participants lived in their homes for 22.3 years on average (range: 0e74 years). Spanish speakers made up 12.3%±9.7% of each census tract, ranging 1%e 50% (Fig. 2). The Spanish language ICE ranged from0.03 to 0.90 with a mean±SD of 0.58±0.20 at the census tract level.
The ICCs indicated that between-neighborhood variance accounted for a small, although non-negligible, proportion of the variance in CES-D scores, even after accounting for neighborhood segregation (Tables 2 and 3). These ICCs were similar in magnitude to other neighborhood depression studies[32]. After adjusting for age, sex, and nativity (model 3,Table 2), residing in a neighborhood more segregated toward English-only use (a higher ICE score) was associated with lower CES-D scores (
b
¼ 4.410; 95% confidence interval [CI]¼ 6.851 to1.970). The beta estimate indicates that a single unit increase in ICE scores was associated with a decrease in CES-D scores of approximately 4 points. In other words, residing in a census tract with more English-only-speaking residents compared with Spanish-speaking residents was associated with fewer depressive symptoms. This association attenuated toward the null upon adjustment for education (model 4, Table 3,b
¼ -2.119; 95% CI¼ 4.650 to 0.413), indicating that after accounting for individual-level education, Spanish language segregation no longer appeared to strongly influence depressive symptoms. The association was not modified by individual language preference (model 6,Table 3, interactionPvalue: 0.9613).Table 1
Descriptive characteristics of the SALSA population (baseline 1998e1999), overall and stratified by neighborhood-level Spanish language use ICE quartile
Individual-level characteristics Overall (n¼1786) Neighborhood-level Spanish language use ICE quartile*
1: Most Spanish 2 3 4: Least Spanish
Covariates Age, mean (SD) 70.6 (7.1) 70.9 (7.4) 70.9 (7.1) 70.1 (7.1) 70.7 (7.0)
Female, n (%) 1038 (58.4) 257 (58.8) 239 (56.8) 270 (59.5) 261 (58.8)
Nativity, n (%)
Foreign-born 908 (51.0) 247 (56.5) 240 (57.0) 220 (48.5) 186 (41.9)
U.S.-born 871 (49.0) 190 (43.5) 181 (43.0) 234 (51.5) 258 (58.1)
Language preference, n (%)
Spanish 1029 (57.8) 293 (67.1) 269 (63.9) 265 (58.4) 184 (41.4)
English 750 (42.2) 144 (33.0) 152 (36.1) 189 (41.6) 260 (58.6)
Socioeconomic Position Education (years), mean (SD) 7.2 (5.3) 5.7 (4.8) 6.0 (4.9) 7.6 (5.2) 9.7 (5.4)
Education (years), n (%)
<12 1260 (70.8) 363 (83.1) 337 (80.1) 307 (67.6) 233 (52.5)
12 225 (12.7) 33 (7.6) 40 (9.5) 66 (14.5) 85 (19.1)
13-16 227 (12.8) 33 (7.6) 36 (8.6) 66 (14.5) 90 (20.3)
>16 67 (3.8) 8 (1.8) 8 (1.9) 15 (3.3) 36 (8.1)
Neighborhood characteristics Time spent in neighborhood, mean (SD) 22.3 (14.7) 24.8 (15.1) 21.9 (14.8) 21.8 (14.8) 21.2 (13.9)
% Spanish language use quartiley
1: Most Spanish 433 (24.5) 338 (76.6) 95 (22.4) 0 (0.0) 0 (0.0)
2 464 (26.3) 103 (23.4) 235 (55.3) 126 (27.7) 0 (0.0)
3 427 (24.2) 0 (0.0) 95 (22.4) 256 (56.3) 76 (17.1)
4: Least Spanish 442 (25.0) 0 (0.0) 0 (0.0) 73 (16.0) 369 (82.9)
Depression CES-D score, mean (SD) 10.0 (10.6) 11.0 (10.8) 10.8 (11.1) 9.6 (9.9) 8.7 (10.6)
High depressive symptoms, n (%)z 439 (25.5) 120 (28.6) 106 (25.9) 114 (25.9) 90 (20.8)
CES-D¼Center for Epidemiological Studies Depression Scale; ICE¼Index of Concentration at the Extremes; SALSA¼Sacramento Area Latino Study on Aging; SD¼standard
deviation.
*Quartiles of Spanish language ICE scores:1 to 0.20, 0.21
e0.40, 0.41e0.60, and>0.60.
yQuartiles of % Spanish language use:>29.9%, 18.5%
e29.9%, 10.7%e18.4%, and 0e10.6%.
We additionally conducted several sensitivity analyses to assess potential interactions and to examine whether ourfindings were robust to the inclusion of other possible variables of interest. Some studies suggest that the association between segregation and
mental health may vary by participant nativity or participant sex [7,33]; however, sensitivity analyses examining modification by nativity and sex showed no evidence of this among our study population. Further sensitivity analyses indicated that adjusting for
Fig. 1.Baseline geographical distribution of participants in the Sacramento Area Latino Study on Aging (1998e1999).
other variables related to nativity, such as time in the United States, time lived in the neighborhood, and neighborhood-level Latino composition, did not impact the direction, magnitude, or strength of our results. Our findings were also robust to adjustment for marital status, access to health insurance, and various financial indicators including household size, monthly income, and employment status.
Discussion
This study assessed the impact of neighborhood-level language segregation on depressive symptoms among an elderly Latino population, predominantly of Mexican origin. Prevalence of high depressive symptoms, defined as CES-D scores16, was 25.5% in our population; this is comparable to U.S.-representative samples
Table 2
Estimates from two-level generalized linear naïve model and models 1e3 predicting differences in CES-D scores by neighborhood-level Spanish language use ICE, SALSA
(baseline 1998e1999), and U.S. 2000 Census
Model estimates Naïve model Model 1 Model 2 Model 3
b 95% CI b 95% CI b 95% CI b 95% CI
Intercept 9.808 9.216e10.401z 10.006 9.438e10.573z 7.505 6.697e8.313z 6.318 5.382e7.253z
Individual-level variables
Agex d d d d 0.059 0.013 to 0.131 0.047 0.025 to 0.119
Sex (Ref¼male) d d d d 4.342 3.348e5.336z 4.236 3.248e5.223z
Nativity (Ref¼U.S.-born) d d d d d d 2.464 1.474e3.454z
Education (years) d d d d d d d d
Language preference (Ref¼English) d d d d d d d d
Neighborhood-level ICE variables
Spanish language usek d d 5.072 7.523 to2.621z 5.196 7.623 to2.768z 4.410 6.851 to1.970z
Cross-level variables
Spanish language use ICElanguage preference d d d d d d d d
Random variance components
Level 1 (within-neighborhood) variance 109.80z 109.61z 104.73z 103.22z
Level 2 (between-neighborhood) variance 3.0422y 1.9199* 2.0908* 2.1449y
ICC¶ 0.027 0.0127 0.0196 0.0204
Goodness-of-fit components
AIC 12,872.4 12,858.5 12,788.2 12,766.5
2log likelihood 12,866.4 12,850.5 12,776.2 12,752.5
AIC¼Akaike's Information Criterion; CES-D¼Center for Epidemiological Studies Depression Scale; CI¼confidence interval; ICC¼intraclass correlation; ICE¼Index of
Concentration at the Extremes; SALSA¼Sacramento Area Latino Study on Aging.
*P<0.1.
yP<0.5.
zP<0.01.
xAge centered at 70.6 years.
kSpanish language use ICE centered at 0.42 (the mean ICE at the individual level); higher ICE score indicated more segregated toward English-only use.
¶ICC calculated as the between-neighborhood variance divided by the sum of the between- and within-neighborhood variances.
Table 3
Estimates from two-level generalized linear models 4e6 predicting differences in CES-D scores by neighborhood-level Spanish language use ICE, SALSA (baseline 1998e1999),
and U.S. 2000 Census
Model estimates Model 4 Model 5 Model 6
b 95% CI b 95% CI b 95% CI
Intercept 9.828 8.435e11.220z 9.029 7.417e10.641z 9.025 7.404e10.646z
Individual-level variables
Agex 0.008 0.064 to 0.080 0.009 0.063 to 0.081 0.009 0.063 to 0.081
Sex (Ref¼male) 4.013 3.035e4.990z 4.023 3.054e5.006z 4.031 3.054e5.007z
Nativity (Ref¼U.S.-born) 1.011 0.057 to 2.078* 0.354 0.903 to 1.612 0.356 0.903 to 1.615
Education (years) 0.361 0.468 to0.255z 0.316 0.432 to0.200z 0.316 0.432 to0.200z
Language preference (Ref¼English) d d 1.379 0.020 to 2.778* 1.379 0.020 to 2.778*
Neighborhood-level ICE variables
Spanish language usek 2.119 4.650 to 0.413 1.994 4.530 to 0.542 1.937 5.365 to 1.491
Cross-level variables
Spanish language use ICElanguage preference d d d d 0.109 4.500 to 4.283
Random variance components
Level 1 (within-neighborhood) variance 100.40z 100.15z 100.15z
Level 2 (between-neighborhood) variance 2.3502y 2.3852y 2.3864y
ICC¶ 0.0229 0.0233 0.0233
Goodness-of-fit components
AIC 12,724.7 12,723 12,725
2log likelihood 12,708.7 12,705 12,705
AIC¼Akaike's Information Criterion; CES-D¼Center for Epidemiological Studies Depression Scale; CI¼confidence interval; ICC¼intraclass correlation; ICE¼Index of
Concentration at the Extremes; SALSA¼Sacramento Area Latino Study on Aging.
*P<0.1.
yP<0.5
zP<0.01.
xAge centered at 70.6 years.
kSpanish language use ICE centered at 0.42 (the mean ICE at the individual level); higher ICE score indicated more segregated toward English-only use.
of Latino adults[34]. We found a strong unadjusted association between language segregation and depressive symptoms that remained significant upon adjustment for age, sex, and nativity; in our population, individuals residing in highly segregated Spanish-speaking neighborhoods had more depressive symptoms than in-dividuals in highly segregated English-only-speaking neighbor-hoods. These associations attenuated toward the null upon adjustment for confounding effects of individual-level education.
Few studies have assessed the impact of formal segregation measures on depressive symptoms among U.S. Latinos. Consistent with our unadjusted results, Lee et al. found a strong association between residential segregation, measured with the Isolation In-dex, and depressive symptoms among Mexican Americans in Chi-cago[21]. Traditionally in segregation and cardiovascular health literature, segregation appears to adversely influence health among black communities but to benefit Latino communities [5]. This pattern may depend on the time spent in the United States of the Latino community and the health outcome of interest, as studies suggest worsening mental health among Latinos with increased time in the United States[35]. As subsequent generations of Latino immigrants acculturate to U.S. society, their experience of systemic and structural discrimination and the resulting mental health in-fluence of residential segregation may begin to look more similar to that of black individuals. Furthermore, for long-term immigrants or U.S.-born Latinos, residence in Latino enclaves may reflect blocked upward mobility that negatively impacts health[19,20]. This may explain why our results differ from traditional segregation litera-ture, as our population largely comprises long-term immigrants or U.S.-born individuals.
Previous segregation studies have focused almost exclusively on segregation in terms of racial composition,finding that increased Latino composition afforded a protective mental health effect among elderly Latino populations[6e8]. Shell et al. found that this
mental health benefit was only present among English speakers, suggesting the importance of language use when examining these associations[6]. Our study incorporated Spanish language segre-gation, a more specific aspect of cultural segregation that may be especially important for Latino health[15,16]. Only one previous study examined segregation regarding language use in relation to mental health, assessing the association between linguistic isola-tion and depressive symptoms among Latinos in Los Angeles[36]. Vega et al. found that neighborhood linguistic isolation protected against depressive symptoms. They hypothesized that linguistically isolated communities may allow immigrants to maintain their culture and language as a medium for everyday tasks and social connections, creating a cultural comfort zone in which to adjust to the U.S. context[36].
The protective effect of linguistic isolation found by Vega et al. opposes our unadjusted results, possibly as a result of differences in study population. Vega's study participants were younger and more likely to be foreign-born than SALSA participants. Newer immi-grants tend to have fewer depressive symptoms compared with long-term immigrants, especially those experiencing blocked up-ward social mobility[20,35]. Long-term residents of linguistically isolated communities may lack access to health services and the social resources that allow for effective navigation of the U.S. educational system and job market; this could in turn cause exclusion from advancement opportunities, further socioeconomic hardship, and thereby increased susceptibility to poor mental health[37].
The opposing directions of our results compared with those of Vega et al. may also be due to the utilization of different language segregation measures. Vega et al. obtained their neighborhood linguistic isolation directly from the 2000 Census data; the U.S. Census Bureau defines“linguistic isolation”as living in a household
in which all members aged 14þyears speak a non-English language and none speak English“very well”[38]. We chose to use the ICE in relation to Spanish language use rather than the Census variable of linguistic isolation because the Census variable does not differen-tiate between those who speak Spanish at home or another non-English language, whereas the Spanish language use ICE variable does make this distinction. This differentiation may be especially important in California communities where new immigration from Asian countries has surpassed new immigration from Latin Amer-ican countries[39,40], and individuals who speak Chinese, Korean, or Vietnamese at home are more likely to classify as linguistically isolated than Spanish-speaking individuals [40]. Given that our study and that of Vega et al. were specific to Latino populations residing in California, the Spanish language segregation ICE variable may provide a more accurate illustration of Spanish language segregation in this region than the more general Census variable of linguistic isolation.
Neighborhood segregation in relation to cultural factors, such as language use, may be especially salient for the mental health of elderly Latinos. Qualitative studies among elderly individuals living in neighborhoods undergoing gentrification revealed that partici-pants were more emotionally impacted by changing cultural factors in their neighborhoods than by changing socioeconomic compo-sition [41]. Cultural neighborhood characteristics may play an important role for the mental health of elderly U.S. Latinos in particular because older individuals tend to spend more time at home and in the immediate outdoor environment than younger people [42] and have been shown to derive a strong sense of emotional attachment from their home and the surrounding community[43].
Neighborhood language use may also be especially important for elderly Latinos because elderly individuals from ethnic minority groups seek formal health care later than those from nonminority groups[44]. Lack of culturally appropriate community services that accommodate the language needs of a community's residents may impede access to information about and treatment for mental health conditions[44]. Latino patients are also more likely to seek health care from Latino physicians than other physicians[45], and many Latinos consider a physician's Spanish-speaking ability when choosing a physician[46,47]. However, the educational differential between U.S. Latinos and non-Latino whites makes interacting with a Latino or Spanish-speaking clinician a rare experience. Fewer than 2% of American Psychological Association members identify as Latino [48]. These considerations are especially important for elderly Latinos who may be more confined to their residential environment and also carry a high depression burden and are therefore in greater need of these services.
highly segregated Spanish-speaking neighborhoods; something else characterizing these census tracts, such as fewer educational resources and opportunities for upward social mobility, led to the association.
It is important to note that educational attainment is a marker for overall socioeconomic position and that this variable likely represents socioeconomic factors operating early in life that have continued to impact the lives, living situations, and neighborhoods of the SALSA participants into their old age. Low education may set individuals on a trajectory for being more likely to be constrained to living situations and neighborhoods where they have inadequate access to other resources, services, programs, and information that are related to educational attainment and may be important for the mental health of elderly adults. Thus, improving access to educa-tional resources may not directly benefit the mental health of the elderly individuals already living in these circumstances, rather these individuals would more likely benefit from improvement to access of the health-promoting resources, services, and programs that educational attainment likely represents. Nevertheless, this does not negate the importance of improving educational resources as access to or lack of access to these resources has long-lasting consequences across the life course and even across gen-erations[49].
We conceptualized individual-level education as a confounder of the language segregation-depressive symptom association, although education has been considered a mediator between segregation and health in other populations[50]. SALSA comprised elderly, mostly foreign-born, individuals; therefore, participants likely completed their education before settling into their current neighborhoods. Indeed, 93% of immigrant participants completed their education in their birth country. However, participant age does not entirely rule out education as a mediator if determinants of participants' current neighborhoods were associated with past residential history and participants' educational contexts, whether in the U.S. or abroad. Nevertheless, for our elderly mostly foreign-born population, we believed education was more likely a com-mon cause of the participants' neighborhood selection and depressive symptoms.
Our study had several strengths including use of geocoded data from a population-based sample representative of elderly Latinos residing in Sacramento, California. We utilized trained bilingual interviewers and validated surveys to collect sociodemographic and depression data. Furthermore, our study was the first to implement the novel ICE measure to examine the impact of lan-guage segregation on depressive symptoms among a Latino pop-ulation. To our knowledge, no existing studies have assessed the influence of this more direct measure of spatial social polarization, especially regarding cultural factors such as language isolation, on mental health.
Our study also had limitations. First, language segregation, so-cioeconomic position, and depression are dynamic constructs that may change over time for neighborhoods and residents. However, the cross-sectional nature of SALSA baseline data did not allow us to determine the temporal direction of the association of interest nor to rule out reverse causality. Mental health status may cause an individual to self-select into certain neighborhoods rather than the neighborhood causing their mental health status. However, SALSA participants were residentially stable, with an average neighbor-hood residence of 22.3 years; thus, our neighborneighbor-hood measure likely captures effects acting earlier in life[51]. Furthermore, due to the cohort's residential stability, we anticipate little selection bias due to repatriation to birth country.
In addition, we utilized education as a measure of socioeco-nomic position, which may not fully capture this construct. SALSA did collect income and employment data; however, education is
often preferred in studies of older age individuals because it pre-dicts occupation and wages and is less influenced by age-related changes in these characteristics[52]. The elderly SALSA partici-pants may be retired and therefore may not have incomes repre-sentative of their earlier occupations. Nevertheless, we conducted sensitivity analyses using other economic indicators, including employment status and monthly income, and found that inclusion of these variables did not influence the results we observed when adjusting for educational attainment.
Furthermore, as can been seen from the baseline geographic distribution of SALSA participants inFigure 1, most SALSA partici-pants resided in a concentrated area within the targeted counties. This may cause concern regarding selection bias and generaliz-ability. However, the 249 census tracts represented in the analysis do appear to be largely representative of the 596 census tracts that made up the six counties targeted for the SALSA study. For example, regarding Spanish-speaking composition, among the 249 census tracts in which SALSA participants resided, the mean± SD per-centage of Spanish speakers in each census tract was 12.3%±9.7%. When considering the total 586 census tracts that made up the six counties targeted for the SALSA study, the mean±SD percentage of Spanish speakers in each census tract was 13.2%±11.4%, based on U.S. Census data from 2000[53]. Therefore, the census tracts in which participants resided did not appear to greatly differ from the census tracts in which participants did not reside in terms of Spanish-speaking composition. Furthermore, the SALSA sample was designed to be highly representative of older Latinos residing in the target area: households were selected in such a way to represent this population, and more than 89% of eligible and enumerated households had an individual who participated in the study[22].
Finally, SALSA participants were predominantly elderly in-dividuals of Mexican-origin living in California's Sacramento Valley. Consequently, our findings may not apply to other Latino sub-populations or age groups, and we cannot draw broad conclusions regarding depressive symptom prevalence among all U.S. Latinos. However, Mexican Americans are the largest, fastest-growing U.S. Latino subgroup[54], and studies across the U.S. suggest that older Latinos report the highest levels of depression compared with other populations [1]. Therefore, examining factors associated with depression in these groups holds particular importance.
Conclusions
process of dismantling the social structures that lead to racial hi-erarchy in resource allocation and improve the long-term mental health of the residents of these communities.
Acknowledgments
This research uses data from the Sacramento Area Latino Study on Aging (SALSA), which is currently housed at the University of North Carolina at Chapel Hill. Information on how to obtain the SALSA datafiles is available on the Aiello Research Group website (www.aielloresearchgroup.org/research). Special acknowledgment is due to the members of the Aiello Research Group at the versity of North Carolina at Chapel Hill and Anne Lee at the Uni-versity of California, San Francisco, for their assistance with data management and analysis.
Funding: This work was supported by the National Institute of Child Health and Human Development at the National Institutes of Health [grant number T32HD007168] and the National Institute on Aging at the National Institutes of Health [grant number R01AG012975]. The funding sources had no involvement in study design; in the collection, analysis, and interpretation of data; in the writing of the report; or in the decision to submit the article for publication.
References
[1] Sadule-Rios N. A review of the literature about depression in late life among Hispanics in the United States. Issues Ment Health Nurs 2012;33:458e68. [2] Iceland J, Weinberg D, Hughes L. The residential segregation of detailed
His-panic and Asian groups in the United States: 1980-2010. Demogr Res 2014;31: 593e624.
[3] Osypuk TL, Acevedo-Garcia D. Beyond individual neighborhoods: A geography of opportunity perspective for understanding racial/ethnic health disparities. Heal Place 2010;16:1113e23.
[4] Rumbaut R, Portes A. Introduction–Ethnogenesis: Coming of Age in Immi-grant America. In: Rumbaut R, Portes A, editors. Ethn Child ImmiImmi-grants Am. Berkeley: University of California Press; 2001. p. 1e20.
[5] Kershaw KN, Albrecht SS. Racial/ethnic residential segregation and cardio-vascular disease risk. Curr Cardiovasc Risk Rep 2015;9.
[6] Shell AM, Peek MK, Eschbach K. Neighborhood Hispanic composition and depressive symptoms among Mexican-descent residents of Texas City, Texas. Soc Sci Med 2013;99:56e63.
[7] Gerst K, Miranda PY, Eschbach K, Sheffield KM, Peek MK, Markides KS. Pro-tective neighborhoods: neighborhood proportion of Mexican Americans and depressive symptoms in very old Mexican Americans. J Am Geriatr Soc 2011;59:353e8.
[8] Ostir GV, Eschbach K, Markides KS, Goodwin JS. Neighbourhood composition and depressive symptoms among older Mexican Americans. J Epidemiol Commun Health 2003;57:987e92.
[9] Valdez CR, Mills MT, Bohlig AJ, Kaplan D. The role of parental language acculturation in the formation of social capital: differential effects on high-risk children. Child Psychiatr Hum Dev 2013;44:334e50.
[10] Kam JA, Lazarevic V. The stressful (and not so stressful) nature of language brokering: identifying when brokering functions as a cultural stressor for Latino immigrant children in early adolescence. J Youth Adolesc 2014;43: 1994e2011.
[11] Koneru VK, Weisman de Mamani AG, Flynn PM, Betancourt H. Acculturation and mental health: Current findings and recommendations for future research. Appl Prev Psychol 2007;12:76e96.
[12] Sadule-Rios N, Tappen R, Williams CL, Rosselli M. Older Hispanics' explanatory model of depression. Arch Psychiatr Nurs 2014;28:242e9.
[13] Reynolds D. Cervical cancer in Hispanic/Latino women. Clin J Oncol Nurs 2004;8:146e50.
[14] Stuart GW, Minas IH, Klimidis S, O'Connell S. English language ability and mental health service utilisation: a census. Aust N Z J Psychiatry 1996;30: 270e7.
[15] Park Y, Neckerman KM, Quinn J, Weiss C, Rundle A. Place of birth, duration of residence, neighborhood immigrant composition and body mass index in New York City. Int J Behav Nutr Phys Act 2008;5:19.
[16] Park Y, Neckerman K, Quinn J, Weiss C, Jacobson J, Rundle A. Neighbourhood immigrant acculturation and diet among Hispanic female residents of New York City. Public Health Nutr 2011;14:1593e600.
[17] Albor C, Uphoff EP, Stafford M, Ballas D, Wilkinson RG, Pickett KE. The effects of socioeconomic incongruity in the neighbourhood on social support, self-esteem and mental health in England. Soc Sci Med 2014;111: 1e9.
[18] Weich S, Lewis G, Jenkins S. Income inequality and the prevalence of common mental disorders in Britain. Br J Psychiatry 2001;178:222e7.
[19] Osypuk TL, Bates LM, Acevedo-Garcia D. Another Mexican birthweight paradox? The role of residential enclaves and neighborhood poverty in the birthweight of Mexican-origin infants. Soc Sci Med 2010;70: 550e60.
[20] Portes A, Rumbaut R. Not Everyone is Chosen: Segmented Assimilation and its Determinants. In: Portes A, Rumbaut R, editors. Legacies story Immigr. Second Gener. Berkeley/Los Angeles and New York: University of California Press, Russell Sage Foundation; 2001. p. 44e69.
[21] Lee M-A. Neighborhood residential segregation and mental health: a multi-level analysis on Hispanic Americans in Chicago. Soc Sci Med 2009;68: 1975e84.
[22] Haan MN, Mungas DM, Gonzalez HM, Ortiz TA, Acharya A, Jagust WJ. Preva-lence of dementia in older latinos: the influence of type 2 diabetes mellitus, stroke and genetic factors. J Am Geriatr Soc 2003;51:169e77.
[23] Radloff LS. The CES-D Scale: A Self-Report Depression Scale for Research in the General Population. Appl Psychol Meas 1977;1:385e401.
[24] Salgado VN, Maldonado M. Características psicometricas de la escala de depresion en el Centro de Estudios Epidemiologicos en mujeres mexicanas adultas deareas rurales. Salud Publica Mex 1994;36:200e9.
[25] Gonzalez-Forteza C, Torres CS, Tapia AJ, Fernandez IH, Gonzalez-Gonzalez A, García FJ, et al. Confiabilidad y validez de la escala de depresion CES-D en un censo de estudiantes de nivel medio superior y superior, en la Ciudad de Mexico. Salud Ment 2011;34:53e9.
[26] Black SA, Goodwin JS, Markides KS. The association between chronic diseases and depressive symptomatology in older Mexican Americans. J Gerontol A Biol Sci Med Sci 1998;53:M188e94.
[27] Grigsby J, Kaye K, Baxter J, Shetterly SM, Hamman RF. Executive cognitive abilities and functional status among community-dwelling older persons in the San Luis Valley Health and Aging Study. J Am Geriatr Soc 1998;46: 590e6.
[28] Massey D. The prodigal paradigm returns: ecology comes back to sociol-ogy. In: Booth A, Crouter A, editors. Does It Tak. a Village? Community Eff. Child. Adolesc. Fam. Mahwah, NJ: Lawrence Erlbaum Associates; 2001. p. 41e8.
[29] Krieger N, Waterman PD, Spasojevic J, Li W, Maduro G, Van Wye G. Public Health Monitoring of Privilege and Deprivation With the Index of Concen-tration at the Extremes. Am J Public Health 2016;106:256e63.
[30] Krieger N, Waterman PD, Gryparis A, Coull BA. Black carbon exposure, so-cioeconomic and racial/ethnic spatial polarization, and the Index of Concen-tration at the Extremes (ICE). Health Place 2015;34:215e28.
[31] Mair C, Diez Roux AV, Osypuk TL, Rapp SR, Seeman T, Watson KE. Is neigh-borhood racial/ethnic composition associated with depressive symptoms? The multi-ethnic study of atherosclerosis. Soc Sci Med 2010;71:541e50. [32] Mair C, Diez Roux AV, Galea S. Are neighbourhood characteristics associated
with depressive symptoms? A review of evidence. J Epidemiol Commun Health 2008;62:940e6. 8 p following 946.
[33] Becares L. Ethnic density effects on psychological distress among Latino ethnic groups: An examination of hypothesized pathways. Health Place 2014;30: 177e86.
[34] Wassertheil-Smoller S, Arredondo EM, Cai J, Castaneda SF, Choca JP, Gallo LC, et al. Depression, anxiety, antidepressant use, and cardiovascular disease among Hispanic men and women of different national backgrounds: results from the Hispanic Community Health Study/Study of Latinos. Ann Epidemiol 2014;24:822e30.
[35] Moscicki EK, Locke BZ, Rae DS, Boyd JH. Depressive symptoms among Mexican Americans: the Hispanic Health and Nutrition Examination Survey. Am J Epidemiol 1989;130:348e60.
[36] Vega WA, Ang A, Rodriguez MA, Finch BK. Neighborhood Protective Effects on Depression in Latinos. Am J Commun Psychol 2011;47:114e26.
[37] Gonzalez HM, Haan MN, Hinton L. Acculturation and the prevalence of depression in older Mexican Americans: baseline results of the Sacramento Area Latino Study on Aging. J Am Geriatr Soc 2001;49:948e53.
[38] U.S. Census Bureau. Summary File 3: 2000 Census of Population and Housing. Washington, DC: U.S. Census Bureau; 2003.
[39] Medina J. Asians Now Largest Immigrant Group in Southern California. New York, NY: New York Times; 2013.
[40] Ryan C. Language Use in the United States: 2011. Washington, DC: U.S. Census Bureau; 2013.
[41] Burns VF, Lavoie J-P, Rose D. Revisiting the Role of Neighbourhood Change in
Social Exclusion and Inclusion of Older People. J Aging Res 2012;2012.https://
doi.org/10.1155/2012/148287.
[42] Oswald F, Hieber A, Wahl H-W, Mollenkopf H. Ageing and personeenvironment fit in different urban neighbourhoods. Eur J Ageing 2005;2:88e97.
[43] Phillipson C, Bernard M, Phillips J, Ogg J. The Family And Community Life Of Older People: Social Networks And Social Support In Three Urban Commu-nities - Ministry of Social Development. London: Routledge; 2001. [44] Escarce JJ, Kapur K. Access to and Quality of Health Care. In: Tienda M,
Mitchell F, editors. Hisp Futur Am. Washington, DC: National Academies Press (US); 2006.
[46] Gray B, Stoddard JJ. Patient-physician pairing: does racial and ethnic con-gruity influence selection of a regular physician? J Commun Health 1997;22:247e59.
[47] Saha S, Taggart SH, Komaromy M, Bindman AB. Do patients choose physicians of their own race? Health Aff (Millwood) 2000;19:76e83.
[48] APA Center for Workforce Studies. 2014: APA Member Profiles. 2015. [49] Ward JB, Haan MN, Garcia M, Lee A, To TM, Aiello AE. Intergenerational
ed-ucation mobility and depressive symptoms in a population of Mexican origin. Ann Epidemiol 2016;26:461e6.
[50] Kershaw KN, Albrecht SS. Metropolitan-level ethnic residential segregation, racial identity, and body mass index among U.S. Hispanic adults: a multilevel cross-sectional study. BMC Public Health 2014;14:283.
[51] Zeki Al Hazzouri A, Haan MN, Osypuk T, Abdou C, Hinton L, Aiello AE. Neighborhood socioeconomic context and cognitive decline among older Mexican Americans: results from the Sacramento Area Latino Study on Aging. Am J Epidemiol 2011;174:423e31.
[52] Laaksonen M, Rahkonen O, Martikainen P, Lahelma E. Socioeconomic position and self-rated health: the contribution of childhood socioeconomic circum-stances, adult socioeconomic status, and material resources. Am J Public Health 2005;95:1403e9.
[53] American FactFinder. Census 2000 Summary File 1. Washington, DC: U.S. Census Bureau; 2000.