Modelling Dysregulated Na
Absorption in Airway
Epithelial Cells with Mucosal Nystatin Treatment
Alessandra Livraghi1, Marcus Mall2, Anthony M. Paradiso1†, Richard C. Boucher1,3, and Carla M. Pedrosa Ribeiro1,3
1Cystic Fibrosis/Pulmonary Research and Treatment Center, and3Department of Medicine, The University of North Carolina at Chapel Hill, Chapel Hill, North Carolina; and2Department of Pediatrics III, Pediatric Pulmonology and Cystic Fibrosis Center, University of Heidelberg, Heidelberg, Germany
In cystic fibrosis (CF), the absence of functional CFTR leads to dysregulated Na1 absorption across airway epithelia. We estab-lished anin vitromodel of dysregulated Na1absorption by treating polarized normal human bronchial epithelial cells (HBEs) with nystatin (Nys), a polyene antibiotic that enables monovalent cations to permeate biological membranes. Acute mucosal Nys produced a rapid increase in short circuit current (Isc) that reflected increased
transepithelial Na1absorption and required Na1/K1ATPase activity. The acute increase in Iscwas associated with increased mucosal liquid
absorption. Prolonged mucosal Nys treatment resulted in sustained Na1 hyperabsorption, associated with increased mucosal liquid absorption in comparison with naı¨ve (nontreated, kept under air– liquid interface conditions) or vehicle-treated cultures. Nys treat-ment was not toxic. Increased lactate accumulation in Nys-treated culture media suggested a higher metabolic rate associated with the higher energy demand for Na1transport. After chronic Nys treat-ment, the increased Isc was rapidly lost when the cultures were
mounted in Ussing chambers, indicating that Nys could be rapidly removed from the apical membrane. Importantly, chronic Nys treatment promoted sustained mucosal liquid depletion and caused mucus dehydration, compaction, and adhesion to the apical surface of Nys-treated cultures. We conclude that mucosal Nys treatment of HBEs provides a simplein vitromodel to recapitulate the Na1and volume hyperabsorptive features of CF airway epithelia.
Keywords:nystatin; Na1 hyperabsorption; airway surface liquid de-hydration; mucus adherence; cystic fibrosis
In cystic fibrosis (CF) airways, the absence of functional cystic fibrosis transmembrane conductance regulator (CFTR) protein results in deficient cAMP-dependent Cl2secretion and dysregu-lated Na1transport (1). This ion transport imbalance leads to depletion of the airway surface liquid (ASL) volume and impair-ment in mucus clearance (2), which results in airway obstruction and increased susceptibility to infection and inflammation (3). The link among Na1hyperabsorption, ASL dehydration, and the onset of CF lung disease has been strongly supported by the airway phenotype of the recently generatedScnn1b-transgenic
mouse, in which airway-targeted overexpression of the epithe-lial Na1 channel bsubunit (bENaC, encoded by the Scnn1b gene) resulted in increased epithelial Na1 absorption, ASL depletion, impaired mucociliary clearance, and airway inflam-mation (4).
In vitrocultures of human airway epithelial cells have been widely used to study fundamental aspects of CF and other lung diseases (5), as these cultures recapitulate many features of the native respiratory epithelia (6, 7). Although lungs explanted from patients with CF during transplantation represent a valuable source of primary CF cells for culture, the availability of such specimens is limited. Moreover, recent studies have shown that at least the inflammatory phenotype of primary cultures of CF airway changes in short-term (6–11 d) versus long-term well-differentiated (30–40 d) cultures (8). To investigate the specific contribution of epithelial Na1 hyperabsorption per se to the development of CF lung disease, there is a need to consistently reproduce the Na1 hyperabsorptive phenotype of CF airway epithelia in anin vitromodel.
In the present study, we sought to recapitulate the CF-like Na1 hyperabsorptive phenotype in primary cultures of normal human bronchial epithelial cells (HBEs) by exploiting the pore-forming capacity of the polyene antibiotic nystatin (Nys), which selec-tively enables monovalent cations to permeate sterol-containing membranes. Nys, like another polyene antibiotic amphotericin B, forms monovalent cation-selective pores with a permeability sequence of Rb1.K1.Na1.Li1, identical to the size order of the hydrated ions. Nys has been widely used in perforated patch recordings to gain electrical access to the cytoplasm while block-ing the diffusion of cellular constituents into the patch pipette (9). To establish an in vitro model of transepithelial Na1 hyper-absorption, we first characterized the response of polarized HBE cultures to acute mucosal Nys challenge. Next, we evaluated the effect of prolonged Nys treatment on HBEs by comparing Nys-treated cultures with nonNys-treated (naı¨ve) and vehicle-Nys-treated (KBR) cultures. We studied the bioelectric properties, changes in the expression of Na1 transport mediators, toxicity, apical volume absorption, and effect on mucosal secretions elicited by Nys treatment.
MATERIALS AND METHODS
Cell Culture
Primary normal HBEs were provided by the UNC CF Center Tissue Core and obtained under the auspices of protocols approved by the Institutional Committee for the Protection of the Rights of Human
CLINICAL RELEVANCE
Our model recapitulates two key features of cystic fibrosis (CF) airways: abnormal Na1 transport and cell surface accumulation of dehydrated mucus. This model may be used to characterize interactions in a milieu resembling CF airways.
(Received in original form May 17, 2007 and in final form October 12, 2007)
†Deceased.
This work was supported by contract grant sponsors: Cystic Fibrosis Foundation, the National Institutes of Health, and Deutsche Forschungsgemeinschaft (DFG). Contract grant numbers: CF Foundation CFFRIBEIRO0Z0 and CFFRIBEIRO0G0 to C.M.P.R; NIH P01 HL034322 (PPG), NIH P50 HL060280 (SCOR), NIH P50 HL084934 (SCCOR), NIH P30 DK065988 (MTCC), and CF Foundation R026-CR02 (CFF RDP) to R.C.B; and DFG MA 2081/2–1 to M.M.
Correspondence and requests for reprints should be addressed to Alessandra Livraghi, Ph.D., University of North Carolina at Chapel Hill, Cystic Fibrosis/ Pulmonary Research and Treatment Center, CB#7248 Thurston Bowles Bldg., Room # 6029, Chapel Hill, NC 27599. E-mail: [email protected]
This article has an online supplement, which is accessible from this issue’s table of contents at www.atsjournals.org
Am J Respir Cell Mol Biol Vol 38. pp 423–434, 2008
Subjects. HBEs were obtained from freshly excised main stem or lobar bronchi by protease digestion, directly seeded on 12-mm Transwell Col membranes (Corning-Costar Corp., Cambridge, MA), maintained in modified bronchial epithelial growth medium under air–liquid interface conditions as previously described (10), and studied when transepithe-lial resistance (RT) was>300Vcm2.
Ussing Chamber Measurements
HBEs were plated on 12-mm Snapwell-Clear membranes (Corning-Costar) pre-coated with human placenta type IV collagen (0.74 mg/ml; Sigma-Aldrich, St. Louis, MO) in modified bronchial epithelial growth medium, as described above (10). For acute Nys treatment experiments, naı¨ve cultures were mounted in Ussing chambers and bilaterally bathed in Krebs-bicarbonate Ringer (KBR, composition in mM: 140 Na1,
120 Cl2, 5.2 K1, 25 HCO
3, 2.4 HPO4, 0.4 H2PO4, 1.2 Ca21, 1.2 Mg21,
5 glucose, pH 7.4) bubbled with 95% O2–5% CO2. Other bathing
solutions included: bilateral Cl2free KBR, as KBR except all Cl2was
substituted by gluconate; bilateral HCO32free KBR, as KBR except
HCO3was substituted with 1 mM HEPES, 1mM acetazolamide was
added to inhibit cellular bicarbonate production, and the solution was bubbled with 100% O2; and mucosal high K1KBR, as KBR except K1
was increased to 100 mM and Na1reduced to 45 mM. Bioelectric
measurements were performed under short circuit current (Isc)
con-ditions at 378C. Changes in Iscwere measured in response to amiloride
(100mM, mucosal), Nys (40mM, mucosal), ouabain (1 mM, serosal), or bumetanide (100mM, serosal). For chronic Nys treatment experiments, the transepithelial voltage (VT) and RTof naı¨ve, KBR-, and Nys-treated
cultures were measured with epithelial Voltohmeter (EVOM; World Precision Instruments, Sarasota, FL) as described in detail below. On the fourth day of treatment, the cultures were mounted in Ussing chambers and bilaterally bathed in KBR. Changes in Iscwere measured in response
to acute addition of Nys (40mM, mucosal).
Perfusion Ussing Chamber Measurements
HBE cells were plated on porous Transwell Col filters (insert diameterz 2–3 mm), as previously described (11). After confluence was achieved, polarized monolayers were mounted in a modified miniature Ussing chamber connected to a perfusion system that allows rapid (flow rate 3– 5 ml/min, half-time for solution exchange,3 s) and independent change of the solutions bathing the apical and basolateral surface of the culture. Nys (40mM in KBR) or KBR alone were used as mucosal perfusates, while KBR was the serosal perfusate in all experiments. For bioelectric measurements, VTwas monitored by a voltage clamp/pulse generator
and the signal recorded. All experiments were performed under open circuit conditions. To calculate the equivalent current from changes in VT
in response to Nys-challenge, a 1-second current pulse (1mA) was deliv-ered across the tissue every 5 seconds. Chord resistances were calculated at different time points based on the magnitude change in the deflection of VT, and the equivalent current (Ieq) was calculated using Ohm’s law,
according to a method described by Paradiso and coworkers (11).
Volume Absorption Measurements
We performed two types of ASL measurements. First, ‘‘thin-film’’ mea-surements of Texas Red–labeled ASL volume (steady-state and kinetic) were performed with the laser confocal microscopy technique (described in detail in Ref. 12), using a Zeiss Meta Laser Scanning confocal micro-scope (Zeiss, Jena, Germany), with a C-Apochromat 403/1.2 NA water immersion lens (objective working distance 0.29 mm). For steady-state measurement of ASL height, at t50, 10ml of Texas Red–labeled (2 mg/ ml) Hepes-buffered saline solution (HBSS, in mM: 130 NaCl; 5 KCl; 1.3 MgCl26H2O; 1.3 CaCl2; 5 glucose, and 10 HEPES salt-free, pH 7.4) was
applied to the mucosal surface and the excess volume aspirated with a Pasteur pipette to set ‘‘thin film conditions’’ (z1ml) and avoid meniscus-derived artifacts. Due to the fast rate of volume absorption observed in preliminary experiments in the presence of Nys, for volume absorption kinetic studies 10ml of Texas Red dextran–labeled volume, in the presence or absence of Nys, were layered on the mucosal surface of the cultures and imaged at different time points (5 min, 30 min, 1 h, 6 h, and 24 h). For all studies, 100 ml perfluorocarbon (PFC) was added mucosally before imaging to prevent evaporation of the ASL. To measure the average ASL height, five randomly selected fields in predetermined areas on the
culture (one central, four circumferential) were scanned in the XZ mode. Images were then analyzed using the Zeiss LSM 5 Image software, by measuring ASL height with the calibrated line drawing tool in three randomly selected points for each image. ASL height data (n 5 3 transwells/condition from two to three different donors) were then averaged for each condition and time point.
Second, during chronic Nys treatment, macroscopic volume absorp-tion was measured by quantifying the mucosal liquid still present on the surface of the cultures at 8 and 16 hours after each mucosal application of KBR or KBR1Nys. The residual volume was harvested by gentle suction and its volume measured gravimetrically.
Cell Swelling Measurements
Naı¨ve HBE cultures were bilaterally loaded with 4mM calcein-AM in Ham’s F12 medium for 30 minutes at 378C, washed with PBS, and imaged in the XZ scanning mode using a Zeiss Meta Laser Scanning confocal microscopy, with a C-Apochromat 403/1.2 NA water immer-sion lens. After recording the baseline epithelial height at t50, 200ml HBSS with or without 40mM Nys were added to the mucosal surface and sequential scans were taken every 5 minutes. Cell swelling was monitored for up to 45 minutes.
Chronic Nys Treatment
A 40 mM sterile stock solution of Nys (Sigma) was prepared in dimethyl sulfoxide (DMSO), aliquoted, and frozen at2208C. A new stock solution was prepared every 2 to 3 weeks. A 1:1,000 dilution was prepared in KBR before each addition and vortexed. Alternatively, a commercially avail-able Nys suspension in Dulbecco’s Phosphate Buffered Saline (2 mg/ml, 10,000 units/ml, cell culture tested, endotoxin tested, LPS,0.016 U/ml; Sigma) was used as stock solution, with comparable results. The bio-electric properties of the HBE cultures during chronic Nys treatment were assessed by measuring the VTand RTwith an EVOM. We recorded
the instantaneous VTand RTvalues after addition of 500ml KBR to the
apical side of the culture to create a mucosal electrolyte bath suitable for measurement. Excess KBR was carefully removed from the mucosal surface by aspiration after each measurement. The equivalent current (Ieq) was calculated from the VTand RTvalues according to the Ohm’s
law. After the initial (t50) measurement of VTand RT, 120ml of KBR
(vehicle, either KBR alone or KBR10.1% DMSO, whenever the Nys 1,0003stock solution in DMSO was used) or KBR140mM Nys (Nys) were mucosally applied to the cultures. KBR or Nys were mucosally applied twice a day, with an 8-hour interval between the first and the second application. Naı¨ve cultures were kept under air–liquid interface conditions throughout the duration of the experiment. Measurements of VTand RTwere performed as described above, every 24 hours
there-after. In Nys-treated cultures, EVOM VT readings reached a peak
immediately after addition of 500ml mucosal KBR and quickly declined afterwards. This phenomenon has been also described in toad bladder A6 cells in a similar experimental setting (13). The values reported in Figure 5 correspond to the peak values. A typical chronic Nys treatment protocol lasted 96 hours. The serosal media of all cultures were replaced every 24 hours.
Cell Toxicity Assays
To assess cell toxicity, lactate dehydrogenase activity (LDH) was mea-sured by a colorimetric assay in samples of serosal media collected after 96 hours of chronic Nys treatment. Cell viability after chronic Nys treatment was also assessed through the LIVE/DEAD Viability/Cyto-toxicity assay (Invitrogen, Carlsbad, CA). Briefly, after 96 hours of treatment, naive, KBR-, and Nys-treated cultures were incubated with 3mM calcein (the green fluorescence of calcein depends on intracellular esterase activity, which is present only in viable cells) and 4mM ethidium homodimer-1 (EthD-1; this dye is excluded by the intact plasma membrane of live cells, whereas it enters cells with damaged membranes and, upon binding to nucleic acids, undergoes a 40-fold enhancement of fluorescence), and imaged by confocal microscopy in XZ scanning mode, as described above.
Lactate Concentration Assays
the chronic Nys treatment protocol (i.e., 72, 73, 75, 78, 80, and 96 hours). Secreted lactate was measured by an enzymatic colorimetric assay (Sigma).
Quantitative Real-Time PCR Analysis of mRNA Abundance
RNA extraction (four Transwells/condition, two donor codes) was per-formed using the RNeasy mini kit (Qiagen, Valencia, CA). Total RNA was reverse transcribed into cDNA. Quantification of the mRNA levels for different transporters was carried on by RT-PCR, using Sybr Green detection in LightCycler (Roche Diagnostics, Basel, Switzerland) accord-ing to the manufacturer’s instructions. Specific sequences were amplified using the following custom made (MWG Biotech, High Point, NC) prim-ers. Na1/K1ATPasea
1subunit: 59GGA GCT GCT CTG TGC TTT TC;
39GCC CTT TTT GCC CTT TTT AT; Na1/K1ATPaseb
1subunit:
59AAG GAG TTT CTG GGC AGG AC; 39GCC ACT CGG TCC TGA TAT GT; FYXD5: 59GAG CCC CAG ATG CAG TCT AC; 39GGG TCT GTC TGG ACG TCT GT; ENaCa-subunit: 59TGG CAT GAT GTA CTG GCA AT; 39AGC TCC TCC AGC TCC TCT TT; ENaC b-subunit: 59TCC GTA GGC TTC AAG ACC AT; 39CAA TAA GGA CCA GGG GTG TG; ENaCg-subunit: 59ATC GAG TCC AAG CAA GTG GT; 39GTG GTG GAA AAG CGT GAA AT; NKCC1: 59AAT GAT GGC CAC TGT TGT GA; 39TTT CTG CAA ATC CAA CCA CA. Results were normalized on the expression levels of GAPDH mRNA, primers 59GGA GGT GAA GGT CGG AGT CA; 39GAT CTC GCT CCT GGA AGA TG.
Immunofluorescence Analysis ofa1Na1/K1ATPase Subunit
Immunofluorescent detection of thea1Na1/K1ATPase subunit in HBE
cultures was performed using a mouse monoclonal antibody (Upstate Technology, Lake Placid, NY). Sections (4–5mm thick) were obtained from 4% paraformaldehyde–fixed, paraffin-embedded HBE cultures. Antigen retrieval was performed by boiling the slides for 15 minutes in Antigen Unmasking Solution (Vector Laboratories, Burlingame, CA). Blocking was performed in 10% normal goat serum in PBS, for 1 hour at 378C. The primary antibody was applied to the sections at a 1:200 dilution in PBS. Mouse IgG1(Serotec, Raleigh, NC) was used as isotypic control.
The secondary antibody was goat anti-mouse FITC (Jackson Immuno-research, West Grove, PA), used at 15mg/ml in PBS and incubated for 30 minutes at room temperature in the dark. Nuclear staining was achieved by incubation with 0.5mg/ml propidium iodide in PBS for 5 minutes at room temperature. Slides were mounted with Vectashield Hard Mount media (Vector Laboratories) and imaged by confocal microscopy, using a Leica SP2 microscope (Leica, Wetzlar, Germany), with an Apochro-mat 403/1.25 NA oil immersion lens, in the XY scanning mode. Images were acquired using identical illumination intensity and detection sen-sitivity settings. Quantification of the specific fluorescence signal was performed using the Metamorph image analysis software (Molecular Devices, Downington, PA).
Osmium/Perfluorocarbon (OsO4/PFC) Fixation and AB-PAS Staining
OsO4/PFC fixation followed by Richardson’s staining was performed
according to the protocol described in (14). For AB-PAS staining, HBE cultures were bilaterally fixed in 4% paraformaldehyde for 15 minutes at room temperature, washed three times with PBS, processed for inclusion in paraffin, cut, and stained according to the method of Sheehan and Hrapchak (15).
Mucus Wet/Dry Ratio Measurements
HBE cultures were either maintained in naı¨ve conditions (without washing of the apical surface) or treated by adding 50ml of KBR or KBR140mM Nys once a day for 14 days to allow accumulation of visible mucous material. Mucus samples were removed with forceps and weighed at three timed intervals (30-40-50 s) to allow back-extrapolation to initial wet weights (16). Mucus samples were desic-cated for more than 2 hours at 1008C, then reweighed to obtain dry weights and determine wet/dry ratios and percent solids.
Statistical Analyses
All data are expressed as mean6SEM, unless otherwise specified. Paired Student’sttest and one-way or two-way ANOVA followed by Bonferroni post-test were used to determine significant differences among groups.
P , 0.05 was considered statistically significant and n represents the number of different donor lungs from which the cells were obtained.
RESULTS
Acute Apical Membrane Permeabilization with Nys Causes Na1/K1ATPase-Dependent Na1Hyperabsorption in Human
Airway Epithelia
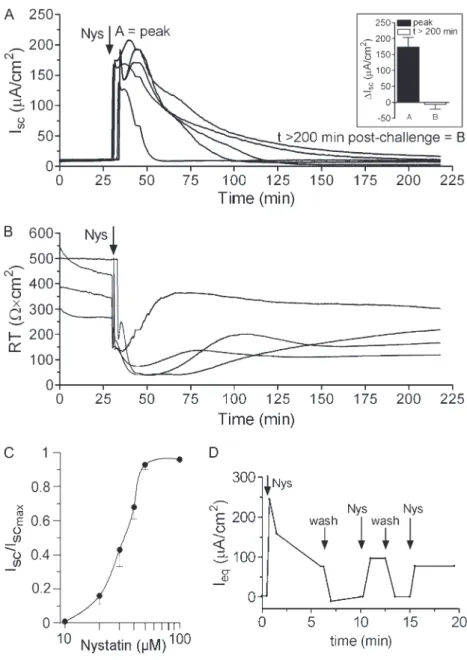
To characterize the acute effect of Nys on epithelial ion transport, we measured HBE bioelectric responses in Ussing chambers. Addition of Nys (40mM) to the mucosal bath caused a large increase in Isc(Figure 1A) and a decrease in RT(Figure 1B). The increase in Iscwas transient and, after a progressive decline (z1 hour), Iscreturned approximately to basal levels (Figure 1A,inset, peak [A] and t.200 min after challenge [B] values). The effect of Nys on Iscwas dose dependent, with the half-maximal activation (EC50) in the range of 30mM (Figure 1C). Although character-ized by a common pattern (rapid increase, peak, gradual de-crease), the profiles of Nys-induced Iscvaried among different cultures, even those derived from the same donor, perhaps reflecting differences in Nys insertion in the apical membrane.
To test whether the gradual decrease in Isc could reflect inactivation/loss of Nys pores, we used a modified Ussing cham-ber that allows continuous perfusion of the mucosal surface. HBE cultures were exposed to pulses of fresh Nys alternating with KBR washing cycles (Figure 1D). After the first exposure to Nys, which induced a strong peak in Ieqfollowed by relaxation, the subsequent exposures failed to elicit a peak response of similar magnitude to the first exposure and produced progressively smaller Ieqpeak responses. The Ieqresponses to the subsequent Nys pulses, however, always exceeded baseline values. Notably, KBR washes appeared to quickly remove Nys pores from the mucosal surface, returning Ieqto pre-challenge baseline levels.
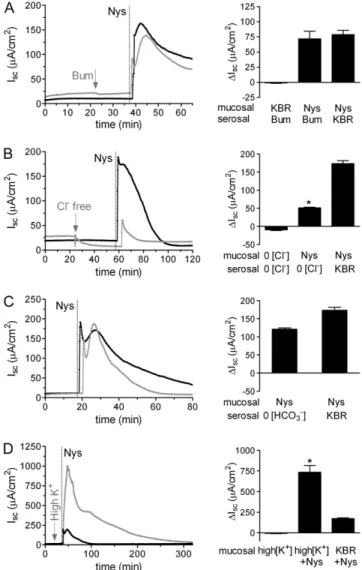
Based on the mechanism of action and ion selectivity of Nys pores, we hypothesized that the initial Isc peak response was dominated by a Nys-induced intracellular Na1load that induced an increase in Na1/K1ATPase activity. To test whether the Nys-induced increase in Iscwas indeed carried by Na1, we compared the response to acute Nys challenge in the presence or absence of Na1 in the luminal bath, replacing Na1 with N-methyl-D-glucamine (NMDG) before challenging the cultures with Nys. As shown in Figure 2A (representative tracings and summary bar graphs with average peak Iscresponses), Na1substitution signif-icantly blocked the Nys-induced Iscpeak response.
preceded by amiloride and Na1replacement with NMDG (Fig-ure 2B,gray tracing). Because the Iscresponse to NMDG after amiloride pretreatment (shunt current) was small (z7mA/cm2), the contribution of the shunt current to the large reduction in Nys-induced Iscwith mucosal amiloride/NMDG was small (compare theDIscAmil1Nys with theDIscAmil/NMDG1Nys,z90mA/ cm2). Moreover, the observation that amiloride pretreatment did not block the Nys peak response (compareDIsc Amil1Nys in Figure 2B withDIscKBR1Nys in Figure 2A) suggests that Nys creates an ENaC-independent, unregulated path for Na1entry as expected based on Nys’ mechanism of action.
To test whether the Nys-induced Iscwas dependent on the activity of the basolateral Na1/K1ATPase, we tested the effect of ouabain (1 mM, serosal), a specific inhibitor of the Na1/ K1ATPase, on the I
scresponse elicited by acute Nys challenge. As shown in Figure 2C, pretreatment with ouabain significantly blunted the Nys-induced increase in Isc, demonstrating that the Nys-induced Isc response required the activity of the Na1/ K1ATPase.
Next, we explored the possibility that the Nys-induced in-crease in Iscwas due to serosal-to-mucosal anion movement. We tested the effect of blocking Cl2transport on the Nys-induced I
sc
peak response by inhibiting Cl2 entry through the Na-K-2Cl cotransporter (NKCC), located in the basolateral membrane of airway epithelial cells, with bumetanide (100mM). As shown in Figure 3A, inhibition of Cl2entry did not significantly inhibit the Nys-induced Iscpeak response, consistent with the notion that the Nys-inducedDIscpredominantly reflected increased Na1 absorp-tion.
We also tested the effect of acute Nys challenge on HBE bio-electrics in the complete absence of Cl2 on both sides of the epithelium. The Nys peak was significantly blunted in bilateral Cl2-free KBR as compared to bilateral KBR conditions (Figure 3B). Although it is possible that a portion of the Iscpeak response to Nys is due to Cl2secretion, the striking discrepancy between the absence of a bumetanide effect on Nys peak response and the inhibition of the Nys response by complete removal of Cl2might be explained by the analysis of the effect of Cl2substitution on the electrochemical driving force for Na1entry. Based on pre-vious studies (19), removal of Cl2from the apical compartment would significantly depolarize the apical membrane (e.g., re-duction of luminal Cl2to 3 mM depolarized the apical membrane
DVa112.1 mV). Further, bilateral Cl2substitution is predicted to induce cell shrinkage and a consequent increase in intracellular
Na1 activity. Thus it is likely that bilateral Cl2 substitution reduced the Isc response to Nys because the electrochemical driving force for Na1entry was substantially reduced by the Cl2 substitution maneuver.
To exclude the participation of other relevant anions in the acute Nys peak response, we performed challenges in the ab-sence of HCO32. We observed peak responses equivalent to those measured in the presence of HCO32(Figure 3C).
Interestingly, when HBEs mucosally bathed in high K1KBR were challenged with Nys, the peak response was strikingly en-hanced (Figure 3D). These data suggest that when K1 efflux through the Nys pores is prevented by elevation of the luminal [K1], the absolute magnitude of net Na1influx is revealed. As previously reported, elevation of the extracellular [K1] did not affect HBE bioelectrics in the absence of Nys (20).
Taken together, these data demonstrate that mucosal appli-cation of Nys to HBEs induces predominantly Na1absorption
that is dependent on Nys concentration and Na1/K1ATPase. However, as another measure of the net ion transport triggered by Nys, we measured luminal liquid volume transport.
Acute Nys Challenge Promotes Mucosal Volume Absorption
In airway epithelia, transepithelial Na1transport constitutes the driving force for liquid absorption from the luminal compart-ment. To test whether Na1hyperabsorption induced by acute Nys challenge was coupled to an increased mucosal volume absorp-tion by HBEs, we performed thin film measurements of ASL volume absorption using live cell confocal imaging, as previously described (12). Figure 4A shows representative images taken in the XZ scanning mode after establishment of thin-film conditions (ASL volumez1ml) on naı¨ve HBEs in the absence or presence of Nys (HBSS and HBSS1Nys, t50), and after 1 hour of incubation in a highly humidified incubator (t51 h). In the absence of Nys, we observed ASL heights in the 7mm range, as expected for
Figure 3. Contribution of Cl2, HCO
32, and K1to the response of HBEs to acute Nys treatment. Representative Ussing chamber tracings illus-trating the Iscresponse to acute Nys challenge (Nys,dashed line) in bumetanide-treated (A, Bum,gray tracing); bilateral Cl2free KBR (B, Cl2 free,gray tracing); bilateral HCO32free KBR (C, HCO32free,gray tracing); and mucosal high K1KBR (D, high K1, gray tracing) compared with untreated HBEs (black tracing). Compiled data from the experiments depicted in all panels are shown in thebar graphas mean6SEM,n52 to 3 individual donors, 4 to 6 cultures/condition. *P,0.0001 versus Nys/ KBR. Average peak Iscresponses to Nys are shown in all thebar graph.
Figure 2. Acute Nys challenge causes Na1hyperabsorption in primary HBE cells. (A) Representative Ussing chamber tracings illustrating the Isc response of naı¨ve HBEs to acute Nys challenge (Nys,vertical dashed line) after Na1 replacement (mucosal NMDG, gray tracing) or without Na1replacement (black tracing). Compiled data from the experiment depicted inAare shown in thebar graphas mean6SEM,n53 indi-vidual donors, 3 to 4 cultures/condition; *P,0.0001 versus KBR1Nys. (B) Representative Ussing chamber tracings illustrating the Iscresponse to acute Nys challenge (Nys,vertical dashed line) of HBEs pretreated with amiloride (Amil, mucosal) and subjected or not to Na1 replace-ment with NMDG (gray and black tracing, respectively). Compiled data from the experiment depicted inBare shown in thebar graphas mean6SEM,n53 individual donors, 3 to 4 cultures/condition; *P,
normal HBEs. In contrast, the presence of Nys in the mucosal liquid significantly increased the volume absorptive capacity of HBEs. Importantly, as shown in Figure 4B, in the presence of Nys the steady-state ASL height dropped well below 7 mm, the physiologic threshold previously shown to be essential for main-taining proper ciliary beating and mucus clearance (2). Thus, Nys produces an apical Na1channel that is not appropriately regu-lated (inhibited) at low ASL volumes.
To define the volume absorption kinetics of HBEs in the pres-ence and abspres-ence of mucosal Nys, 10ml of Texas Red
dextran-labeled volume with or without Nys were layered on the mucosal surface of the cultures and imaged at serial time points (5 min, 30 min, 1 h, 6 h, and 24 h). Figure 4C shows that Nys promoted a faster rate of volume absorption (z5mm/min in the absence of Nys compared withz20 mm/min in the presence of Nys) that significantly reduced ASL height below the 7 mm threshold (dashed line). This reduction persisted throughout the 24-hour observation period. Collectively, these data indicate that Nys both accelerates the rate of volume absorption and bypasses the physiologic inhibition of Na1absorption at low ASL volumes.
Figure 4. Acute Nys challenge promotes mucosal volume absorption in HBEs and induces cell swelling in the presence of large mucosal volume. (A) Representative XZ confocal images of HBEs loaded with Calcein-AM (green signal) and layered with Texas Red–labeled ASL volume (thin film conditions,red signal) in the absence (HBSS) or presence of Nys (HBSS1Nys), at t 50 (upper panels) and t51 hour of incubation in highly humidified incubator (lower panels).Scale bar 5 10mm. (B) Compiled data from thin film measure-ments of steady state ASL volume. Data are expressed as ASL height and shown as mean6SEM,n54 individual donors, 2 cultures/condition; *P,0.0001. (C) Ki-netic measurements of ASL volume ab-sorption by naı¨ve HBEs in the absence (HBSS) or presence of Nys (Nys). (D) Representative sequence of XZ confocal images of calcein-loaded naive HBEs used for cell swelling measurements upon acute Nys challenge in the presence of large mucosal volume. At t51 minute, 200ml of Texas Red–labeled HBSS (upper panel) or HBSS1Nys (lower panel) were mucosally applied.Scale bar510mm. (E) Compiled data for epithelial cell swelling measured as increase in epithelial height over baseline (t50) at 15 minutes. Data are shown as average6SEM,n53 individual donors, 2 cultures/condition; *P,0.01 versus HBSS.
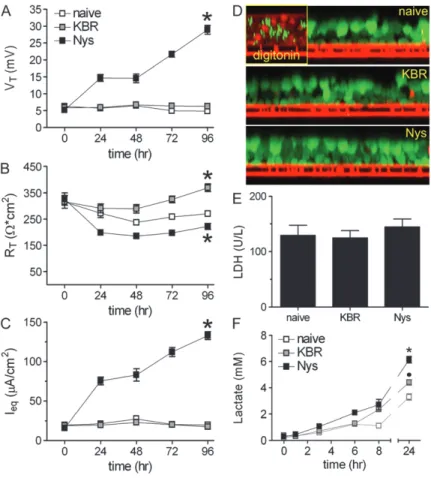
Figure 5. Chronic mucosal Nys treatment promotes sustained Na1hyperabsorption in airway epithelial cells in the absence of cell toxicity. (A–C) EVOM measurements of HBEs bioelectric properties in naı¨ve, KBR-, and Nys-treated cultures. (A) trans-epithelial voltage (VT); (B) transepithelial resistance (RT); and (C) calculated equivalent current (Ieq). Data are shown as mean
6SEM, n56 individual donors, 2 to 4 cultures for each treatment, *P,0.001 significantly different vs. naı¨ve cultures. (D) Representative images illustrating the absence of ethidium homodimer-1 staining (marker of cell death) in naı¨ve, KBR-, and Nys- treated cells subjected to the DEAD/LIVE cell fluorescence assay. Positive control5digitonin-treated HBEs. (E) Lactate dehydrogenase (LDH) activity in the basolateral media of naı¨ve, KBR-, and Nys-treated cultures after 96 hours of Nys treatment. Data are shown as mean6SEM,n53 individual donors, 2 cultures for each treatment. (F) Time-course of lactate accu-mulation in the serosal media of naı¨ve, KBR-, and Nys-treated cultures. Data are shown as mean6SEM,n54 individual donors, 2 cultures for each treatment; *P,0.001 Nys versus naı¨ve and KBR-treated cultures,d
Acute Nys Challenge in the Presence of Large Mucosal Volume Causes Cell Swelling
The initial uncontrolled intracellular Na1load elicited by Nys permeabilization of the apical cell membrane is predicted to promote cell swelling if a large volume of liquid is present on the mucosal surface. To study changes in cell volume, we per-formed real time imaging of calcein-loaded HBEs after apply-ing to the apical surface 100 to 200ml of liquid to the apical surface in the presence or absence of Nys. As shown in Figure 4D, addition of Nys in a large mucosal volume induced a gradual and significant cell swelling as compared with HBEs exposed to the same volume load without Nys (HBSS). In the presence of Nys, the epithelial height reached a plateau in approximately 15
minutes and the cells remained swollen for over 45 minutes (data not shown). The percentage change in t0epithelial height at 15 minutes, in the absence or presence of Nys, is depicted in Figure 4E. Previous studies have shown that mucosal addition of amphotericin B increased the intracellular Na1activity from 23 to 65 mM, with bioelectric changes similar to those induced by Nys (7). Thus, HBE cell swelling in the presence of a large mucosal volume is consistent with a Nys-induced increase in intracellular NaCl, followed by osmotically driven water influx. Although we could not assess whether volume absorption was taking place over the 45-minute period of observation (ASL height exceeded the objective working distance), the data shown in Figures 5A and 7A below indicate that acute cell swelling in
Figure 6. Chronic mucosal Nys treatment does not af-fect the bioelectric proper-ties of primary HBE cells nor total mRNA abundance of transepithelial Na1 trans-port mediators. (A) Repre-sentative Ussing chamber tracings showing the effect of chronic Nys and KBR treatment on Isc. The en-larged panel shows the rapid loss (completed inz 15 min) of chronic Nys ef-fect (e.g., increased Isc) upon mounting of the cul-tures in a Nys-free mucosal bath. (B) Baseline Iscvalues 15 minutes after mounting naı¨ve, KBR-, and Nys-trea-ted culture in the chambers (data are shown as mean6
SD,n54 individual donors, 4 to 6 cultures for each treatment; *P50.01 versus naı¨ve cultures). Thearrowin Figure 1A indicates the acute addition of Nys in the apical chamber. (C)DIsc between peak value after acute Nys addition and baseline value (peak-basal); (D)DIscvalue between the Iscvalue at 40 minutes and baseline value and (40min-basal). Data are expressed as mean6SEM,n54 in-dividual donors, 4 to 6 cul-tures for each treatment; *P
, 0.05 versus naı¨ve cul-tures. (E) Quantitative RT-PCR analysis of epithelial Na1transport path compo-nents in naı¨ve, KBR-, and Nys-treated cultures after 8 hours of treatment. Similar data were obtained at (F) 24 hours and (G) 96 hours of treatment. Data are shown as mean6SEM,n52 in-dividual donors, 4 cultures for each treatment. (H) Representative confocal images of naı¨ve, KBR-, and Nys-treated HBE cultures immunostained for
the presence of large mucosal volume did not affect epithelial integrity or prevent mucosal volume absorption.
Chronic Mucosal Nys Treatment Promotes Sustained Na1
Hyperabsorption in Airway Epithelial Cells
To mimic more closely the chronic Na1hyperabsorption present in CF airway epithelia, we next evaluated the effect of chronic Nys treatment (40mM mucosal Nys for 4 d) on HBEs by comparing the bioelectric properties (measured by EVOM voltohmeter during the treatment, as described in MATERIALS ANDMETHODS) of Nys-treated cultures with both nontreated (naı¨ve) and vehicle (KBR)-treated cultures. As shown in Figure 5A, chronic mucosal Nys treatment increased VTover time, whereas naı¨ve or KBR-treated cultures exhibited no change in VT. After 96 hours of treatment, Nys-treated cultures exhibited a lower RTcompared to naı¨ve cultures, whereas in KBR-treated cultures we observed a slight increase of RTin comparison to naı¨ve cultures (Figure 5B). Of note, after the first 24 hours of treatment, Nys-treated cultures maintained steady RTvalues of approximately 200Vcm2 for 4 days, indicating that epithelial integrity was preserved. The equivalent current (Ieq) of Nys-treated cultures was significantly increased over time compared to naı¨ve and KBR-treated cultures (Figure 5C). After 4 days of Nys treatment, Ieqvalues reached a plateau (data not shown).
Chronic Mucosal Nys Treatment Is Not Toxic for Airway Epithelial Cells
To testin situ whether Nys treatment affected the viability of HBEs, we performed a cell-based assay using fluorescent probes that distinguish between live (calcein-positive, green fluores-cence) and dead (ethidium homodimer-1–positive, red fluores-cence) cells. We found no evidence that chronic Nys treatment was toxic for HBEs, whereas dead cells were clearly identified in the positive control, that is, digitonin-treated cells (Figure 5D). We next assessed whether chronic Nys treatment had a cytotoxic effect by measuring lactate dehydrogenase (LDH) activity in the serosal medium from naı¨ve, KBR-, and Nys-treated cultures after 96 hours of treatment. As shown in Figure 5E, no difference in LDH levels among the different conditions was detected.
Chronic Mucosal Nys Treatment Increases Serosal Lactate Secretion by Airway Epithelial Cells
We noticed that, during chronic Nys treatment, KBR- and Nys-treated cultures tended to acidify the basolateral media (in-dicated by a shift toward yellow in phenol red–containing media) more rapidly than naı¨ve cultures. We speculated that the higher transepithelial Na1 transport induced by Nys was coupled to increased energy expenditure. Since primary epithelial cells in prolonged culture conditions usually rely on glycolytic metabo-lism (21), we performed time courses for the accumulation of lactate (the end product of the glycolytic metabolism) in the serosal media of naı¨ve, KBR-, and Nys-treated cultures. As shown in Figure 5F, 24-hour lactate accumulation after 96 hours of treatment was higher in Nys- than either KBR-treated or naı¨ve cultures, whereas the lactate levels of KBR-treated cultures were intermediate between naı¨ve and Nys-treated cultures. These data suggest that Nys- and, to a lesser extent, KBR-treated cultures exhibited a higher metabolic energy demand, likely associated with increased Na1transport/volume load.
Chronic Mucosal Nys Treatment Does Not Permanently Change the Bioelectric Properties of Airway Epithelial Cells
We next tested whether chronic Nys treatment would perma-nently affect the bioelectric properties of HBEs as measured in
Ussing chambers. The representative tracings shown in Figure 6A were recorded immediately after mounting in the chambers cultures chronically treated for 96 hours. We found that the Nys-induced increase in Isc (illustrated in Figure 5C) waned within 5 minutes after the culture was bathed in bilateral KBR (see Figure 6A, inset). These data suggest that, even after prolonged treatment, Nys binding to the apical membrane was weak, and it was rapidly reversible when Nys was diluted more than 40-fold in the mucosal bath. These findings are in agreement with the perfusion chamber experiment shown in Figure 1D.
After establishment of the new baseline (z15 min), chroni-cally Nys-treated cultures exhibited baseline Iscvalues slightly lower than those of naı¨ve cultures (seerepresentative tracings in the inset of Figure 6A and thebar graphwith average baseline Isc values in Figure 6B). All cultures responded to a second Nys challenge with a rapid increase in Isc, and the average peak values for Nys-pretreated cultures were slightly smaller than those of naı¨ve cultures (Figure 6.C). Altogether, these data suggest that chronic Nys treatment did not grossly modify the basal activity of the Na1pump in HBE cells.
Interestingly, for naı¨ve cells, the Nys-induced peak in Iscwas followed by a gradual decrease as previously shown (Figure 1A), whereas for Nys- and KBR-pretreated cultures the Nys-induced Iscwas generally sustained for longer times, as indicated by the
DIscafter 40 minutes in comparison to naı¨ve cultures (Figure 6D). This latter finding suggests that although the chronic treatment (both with KBR or Nys) did not alter the ability of the trans-epithelial Na1transport system to respond to an acute Na1load, it did modify the long-term response of HBEs to this stimulus. Given the absence of dramatic differences in baseline Iscand Nys-induced peak Iscvalues among naı¨ve, chronically KBR–treated, and chronically Nys–treated cultures and considered the high variability of late-phase profiles normally obtained upon acute Nys challenge, we did not further explore the etiology of this long-term post-Nys challenge response.
Chronic Mucosal Nys Treatment Does Not Affect mRNA Abundance of Key Elements of the Transepithelial Na1
Transport Path
To assess directly whether chronic Nys treatment modulated the mRNA abundance of key elements of the transepithelial Na1 transport path, we performed quantitative RT-PCR analysis on total mRNA extracted from naı¨ve, KBR-, and Nys-treated cultures at 8, 24, and 96 hours. We evaluated mRNA expression of the following genes: the catalytica1Na1/K1ATPase subunit; the b1Na1/K1ATPase subunit; FXYD5, a newly identified modulator of the Na1/K1ATPase activity, particularly abundant in epithelial cells from kidney, intestine, and lung (22); the basolateral Na-K-2Cl cotransporter (NKCC1); and the three subunits of the epithelial Na1channel, i.e.,a-,b-, andg-ENaC. As shown in Figure 6E, no significant differences were detected in the mRNA abundance among naı¨ve, KBR-, and Nys-treated cultures after 8 hours of treatment. We obtained similar results for later time points (e.g., 24 and 96 h [Figures 6F and 6G]), suggesting that Nys treatment did not affect the mRNA abun-dance of the major components of the Na1transport system.
basolateral localization of the Na1/K1ATPase. However, quan-tification of thea1Na1/K1ATPase-specific fluorescence signal in naı¨ve, KBR-, and Nys-treated cultures after 96 hours of treatment revealed a slight but significant increase in the expression of the
a1Na1/K1ATPase in Nys-treated compared with naı¨ve cultures (Figure 6H), in contrast with chronic AmphoB treatment, which was found to reduce the expression and activity of the Na1pump.
Chronic Nys Treatment Promotes Sustained Mucosal Volume Absorption in Airway Epithelial Cells
HBE cultures chronically treated with Nys or KBR exhibited striking differences in the rates of absorption of the fluid applied on their mucosal surfaces. The rate of mucosal volume absorption was quantified by collecting the fluid remaining on the mucosal surface at 8- and 16-hour intervals after the application of KBR or Nys in 120ml KBR, throughout the chronic treatment protocol. As shown in Figure 7A, Nys-treated cultures showed a significant increase in the rate of volume absorption within the first 8 hours of treatment (9 ml/h with Nys versus 3 ml/h without Nys). The volume absorption rates increased slightly after the first 8 hours of treatment and did not change significantly thereafter (16ml/h versus 9ml/h, 15ml/h versus 6ml/h, 14ml/h versus 6ml/h, and 15ml/ h versus 7ml/h, in the presence versus absence of Nys, at 16, 24, 48, and 72 h, respectively). These data are in agreement with the findings from Figure 4C, suggesting that Nys promotes liquid absorption soon after initiation of the treatment. Figure 7B shows representative images of the mucosal surfaces of naı¨ve, KBR-, and Nys-treated cultures after 4 days of chronic treatment. Whereas KBR-treated cultures still had liquid on their surface, Nys-treated cultures appeared completely dry. Moreover, as illustrated by thearrowheadsin Figure 7B, lumps of what appears to be mucosal secretions could be seen at the cell surface of KBR-treated cultures, mostly confined at the periphery of the cell culture. Similarly, in naı¨ve culture the periphery of the culture is where most of the mucosal secretions tend to accumulate over time, likely due to the centrifugal motion of coordinated cilia beating (not shown). In contrast, mucosal secretions and cell debris were plastered to the entire cell surface of Nys-treated cultures, forming macroscopic string-like aggregates.
Chronic Mucosal Nys Treatment Leads to Mucus Dehydration/Compaction over Airway Epithelial Cells
We investigated at the microscopic level the mucosal surfaces of naı¨ve, KBR-, and Nys-treated cultures after 4 days of chronic Nys treatment (Figure 7B) by performing OsO4/perfluorocarbon fixation to preserve the mucus and periciliary layers as previously reported (2, 24). As shown in Figure 8A (left panels), both naı¨ve and KBR-treated cultures exhibited ASL height of approxi-mately 7mm, with freely extended cilia. In contrast, Nys-treated cultures exhibited a depletion of periciliary liquid with ‘‘bent’’ cilia and had a thick layer of dense material adherent to the cell surface.
To assay for the presence of mucopolysaccharides in this thick layer, we performed Alcian Blue–Periodic Acid Schiff (AB-PAS) staining on 4% paraformaldehyde–fixed cultures. This staining revealed that the dense material on Nys-treated cultures con-tained mucinous substances (Figure 8A,right panels). Of note, Nys treatment did not appear to stimulate intracellular accumu-lation of AB-PAS–positive mucous substances in HBEs (Figure 8A,right panels).
As shown in Figure 8A, after 4 days of treatment the mucous layer is only about 10mm thick. Because of the small volume, we could not collect samples of this material to determine its level of hydration after 4 days. Therefore, we prolonged the treatment (decreasing the amount of applied fluid to 50ml, and the
fre-quency of volume challenge to once a day to prevent prolonged periods of flooding and hypoxia in KBR-treated cultures) until we could visually identify masses of mucous material on the surface of naı¨ve, KBR-, and Nys-treated cultures (i.e., 14 d). We then collected these secretions, measured the wet/dry ratio, and cal-culated the percentage of solids as indices of dehydration. As shown in Figure 8B, the percentage of solids of the mucous material sampled from the surface of Nys-treated cultures ex-ceeded those of naı¨ve and KBR-treated cultures, indicating that such material was markedly dehydrated.
DISCUSSION
In the present study, we sought to model the dysregulated Na1 absorptive phenotype of CF airway epithelia in primary cultures of normal bronchial epithelial cells with acute and chronic mu-cosal Nys treatment.
To characterize our model, we first studied the bioelectric response of HBEs to acute Nys challenge. We found that acute Nys challenge in primary HBEs produced a dose-dependent, rapid increase in Iscfollowed by a gradual relaxation of the re-sponse (Figure 1A). Diverse rere-sponses to acute Nys challenge in Ussing chambers have been described in the literature. Although a pattern similar to the one we observed has been described in toad bladder A6 cells and rat colonic epithelium (13, 25), other model systems (e.g., Calu-3 cells) responded to acute Nys exposure with a slower rise in Isc(10–20 min) and a plateau phase that was sustained for over 30 minutes (26, 27). Since Nys binding to the plasma membrane is strictly dependent on sterol content (28), these differences might be attributed to differences in the apical membrane sterol composition in the different cell types studied. Detailed characterization using ion substitution and specific inhibitors of ion transport revealed that the acute bioelectric response of HBE to Nys challenge reflected multiple ion trans-port responses, with Na1absorption being the dominant one. The initial, steep increase in Iscwas dependent on the presence of Na1 in the luminal bath (Figures 2A and 2B) and on the activity of the basolateral Na1/K1ATPase (Figure 2C). The failure of amiloride pretreatment to inhibit the Nys-induced Iscpeak (Figure 2B) sug-gested that Nys challenge elicits ENaC-independent Na1absorption. Nys-induced Iscwas not affected by bumetanide (Figure 3A) or HCO32substitution (Figure 3C). However, there was a signif-icant blunting of this response by bilateral removal of Cl2(Figure 3B). These results suggest that either Cl2secretion was a compo-nent of the Iscresponse or that Cl2substitution had an adverse effect on the electrochemical gradient for Na1entry across the apical membrane. The former possibility seems unlikely for three reasons. First, previous patch clamp studies showed that Nys forms pores that have a small, finite Cl2permeability only when used at high concentrations (150–400mM) (9). In dog bronchial epithelial cells, mucosal Nys increased the Cl2 permeability across the apical membrane only at concentrations higher than 90mM (29). Lower concentrations of Nys (50mM), comparable to the one used in our studies, have been shown to selectively affect Na1transport in immortalized Calu-3 human airway epithelial cells (26). Second, the Nys-induced Iscwas insensitive to bume-tanide (Figure 3A). Third, the possibility that Cl2secretion was a component of the Iscresponse of HBE to acute Nys challenge is inconsistent with our data showing that Nys treatment enhanced the volume absorptive properties of HBE both acutely and chronically (Figures 4A–4C and 7A).
Nys administration produced cell swelling (Figure 4D), consistent with cellular accumulation of Na1 ions and H
2O, whereas an increase in K1secretion is predicted to produce cell shrinkage. Cell swelling was not observed in thin film conditions (Figure 4A), suggesting that Na1 influx through Nys pores, followed by osmotically driven H2O influx, requested large luminal volumes to produce cell swelling. Also note that the Nys-induced swelling was restricted to the luminal columnar cell layer, whereas the basal cell layer appeared to be unaffected, suggesting that Nys pores were confined to the apical membrane of the ‘‘mucosal’’ cell layer (Figure 4D).
In agreement with a previous study (30), we showed that acute Nys-dependent Na1 hyperabsorption was coupled to a rapid increase in the rate of mucosal fluid absorption (Figures 4A and 4B). More importantly, the data shown in Figure 4C suggest that Nys can reproduce both the Na1transport and the ASL volume regulation defects associated with CF. Specifically, cultures exposed to Nys exhibited more rapid initial rate of volume absorption, consistent with an accelerated rate of Na1 absorp-tion. Moreover, Nys-treated cultures were unable to inhibit volume absorption as the ASL volume approached the critical 7mm threshold required for efficient ciliary beating and mucus transport. This latter defect (i.e., failure to inhibit ENaC at low ASL volume) may be the most critical defect in the Na1transport path in CF (31) and appears to be mimicked by Nys. In CF the failure to regulate ENaC at low ASL volume reflects the absence of functional CFTR (1). With Nys, the absence of Na1/volume absorption regulation likely reflects the inability of endogenous regulators of ENaC to inhibit Nys pores (30). Regardless of mechanistic differences, Nys appears to model both features of dysregulated Na1transport exhibited by CF airway epithelia.
To study the effect of chronic apical membrane permeabiliza-tion, we treated HBE cultures with 40mM Nys for 4 days. In the experimental design for the chronic Nys treatment, we consid-ered two conditions to control for the volume of liquid and mass of NaCl applied to the Nys-treated cultures, that is, non–volume-treated (naı¨ve, 0ml) and volume-treated (KBR, 120ml) cultures compared with Nys/volume-treated (Nys1KBR, 120ml) cultures. We showed that chronic Nys treatment significantly increased VTand Ieqover time, while affecting RTonly at early time points
Figure 8. Chronic mucosal Nys treatment causes mucus dehydration and adherence to the cell surface of primary HBE cells. (A) Represen-tative images of naı¨ve, KBR-, and Nys-treated cultures fixed with OsO4/ PFC and stained with Richardson’s staining (left panels) or fixed with 4% PFA and stained with AB-PAS for detection of mucin molecules (right panels). Note the thick layer of dense material at the surface of Nys-treated culture, with embedded cellular debris (arrow). AB-PAS blueandmagenta stainin the intra- and extra-cellular compartments indicates the presence of acid and neutral mucins, respectively.Scale bar510mm. (B) Percent solids content of plugs isolated from the cell surface of naı¨ve, KBR-, and Nys-treated cultures after long-term (i.e., 14 d) treatment (data are shown as mean6SD,n54 individual donors, 2 cultures for each treatment; *P50.001 versus naı¨ve and KBR-treated cultures).
(Figures 5A–5C) compared with either control, suggesting that the functional integrity of the epithelia was preserved.
Transcellular Na1transport driven by the basolateral Na1/ K1ATPase is an energy-consuming process. Although we found no signs of overt cytotoxicity induced by the chronic Nys treatment (Figures 5D and 5E), we observed increased levels of lactate in the serosal media of KBR- and Nys-treated cultures, suggesting that both conditions imposed an increased energy demand on HBE cultures (Figure 5F). We speculate that Nys-treated cultures faced the highest metabolic energy expenditure as a consequence of the increased Na1 transport due the in-creased Na1permeability in the apical membrane after insertion of Nys pores. In the case of the KBR-treated cultures, the increase in lactate concentration in comparison to naı¨ve cultures could reflect the hypoxic conditions created by the continuous presence of liquid on the mucosal surface of these cultures. Alternatively, the higher metabolic energy demand could reflect an increase in Na1transport due to the persistent high activation state of ENaC elicited in airway epithelia by the dilution of ENaC inhibitory factors normally present in the ASL (30, 32).
A recent study has shown that chronic mucosal treatment of normal nasal epithelial cells with 50 mM amphotericin B (AmphoB) significantly reduced VT, Isc, and amiloride-sensitive Isc(23). AmphoB treatment did not affect cellular metabolism or integrity, but decreased expression of aENaC, a1Na1/ K1ATPase, and NKCC1. These findings were interpreted to result from a feedback mechanism aimed to limit cellular Na1 overload due to membrane permeabilization with AmphoB. In contrast, our data indicate that Nys produced a sustained increase in Isc(Figures 5A–5C) coupled to increased volume absorption (Figure 7A) without significant effects on the expression of major components of transcellular Na1transport system (Figures 6E– 6H). In the same experimental conditions used in our study, acute AmphoB challenge caused a rapid increase in Iscsimilar to the one elicited by acute Nys (see Figure E1A in the online sup-plement). Although both Nys and AmphoB belong to the polyene antibiotic family and, at least acutely, have similar effects on the bioelectric properties of airway epithelial cells, a comparison between our results and those of Jornot and coworkers (23) suggests that the different outcomes might be dependent on the different interactions of AmphoB versus Nys with the plasma membrane. For example, our data showed that Nys binding to the plasma membrane was rapidly reversible, and even after chronic exposure the bioelectric properties of Nys-treated cultures after significant Nys dilution, were comparable to those of naı¨ve HBEs. In contrast, AmphoB interactions with the plasma membrane are likely stronger, since the time required to recover normal bio-electric properties depends on the duration of the AmphoB-exposure (23), regardless of the removal of the drug from the mucosal solution. Due to the rapid reversibility of the induced hyperabsorptive phenotype, Nys could be the reagent of choice when secondary modification of the bioelectric properties of the cultures or long recovery time after treatment are unwanted.
Importantly, during the chronic Nys treatment protocol, we observed a striking difference in ASL volume homeostasis be-tween KBR- and Nys-treated cultures that persisted over 4 days (Figure 7A). The persistence of this hyperabsorptive response over 4 days suggests that long-term Nys treatment produced a sustained increase in HBE Na1 transport. Consistent with short-term ASL volume experiments in which the mucus layer was removed from the cell surface (Figures 4A–4C), we found that after 4 days of chronic Nys treatment, the PCL was depleted and the cilia were not fully extended (Figure 8A,left panels). In contrast, naı¨ve and KBR-treated cultures exhibited a normal ASL phenotype, with the cilia outstretched in an approximately 7-mm high periciliary layer. Further, the cilia and the apical
surface of Nys-treated cultures were covered with a thick layer of condensed, strongly AB-PAS–positive material (Figure 8A,right panels). This phenotype strongly resembles the appearance of mucus-plugged CF airways (33). It is worth stressing that our ability to still detect the mucous material on the cell surface of Nys-treated cultures after the repeated washings required for 4% PFA fixation indicates that the interaction between the con-densed layer and the epithelial surface was strong.
Assessment of the percentage of solids of mucus plaques collected after long-term Nys treatment quantitatively showed that the material lining the surface of Nys-treated cultures was dehydrated compared with that harvested from naı¨ve or KBR-treated cultures (Figure 7B). In humans, mucus from bronchiec-tatic individuals ranges from 4 to 8% solids, whereas CF mucus ranges from 11 to 20% solids (34). The ‘‘% solids’’ values mea-sured for the material lining the Nys-treated cultures were higher than those noted in CF HBE cultures after 3 days in culture (24) or in CF lungsin vivo. The higher value could reflect the presence of dead cells in the plugs, as evident in the histologic sections where cell debris entrapped in the mucus layer can be easily seen (Figure 8A, and Figure E1B in the online supplement). Overall, chronic Nys treatment did not appear to promote goblet cell hyperplasia in HBEs. Nevertheless, at this point we can not rule out the pos-sibility that chronic Nys treatment also promoted mucin hyper-secretion, perhaps through activation of voltage-sensitive Ca21 channels (35), compounding the effect of dehydration in the accumulation of concentrated mucus at the mucosal surface.
In conclusion, we have shown that Nys treatment of normal primary airway epithelial cells recapitulates two key features characterizing CF airway epithelia: (1) abnormal Na1transport, as reflected by both accelerated rate of Na1absorption and, most critically, failure to regulate Na1absorption at low ASL volume, producing ASL volume depletion on airway surfaces; and (2) accumulation of dehydrated, ‘‘thickened’’ mucous material that adheres to the cell surface. The Nys model presents some advan-tages in comparison to cultured CF HBEs. Besides being in-expensive and readily available, Nys treatment is not influenced by culture conditions and it is applicable to a wide variety of cultured cells, for example, tracheal and bronchial primary, passage 1 and passage 2 cells, primary nasal cells, and mouse tracheal cells. However, the Nys model also suffers from limi-tations. First, the lack of selectivity on cation transport by Nys pores, (i.e., the parallel increase in K1as well as Na1 permeabil-ity) does not strictly model the CF defect. Second, Nys treatment may exert a subtle pro-inflammatory action on airway epithelial cells (36) of different nature as the inflammation observed in CF airways. Third, although we provided evidence of lack of cyto-toxicity, the details about how HBE cells respond to long-term intracellular Na1load are still unknown. Despite these potential limitations, this simple in vitro model that features luminal thickened mucus may be useful for characterizing the interactions of bacteria, inflammatory cells, and soluble factors in a CF-like luminal milieu. Potentially, this model may also be used to study the adhesive interaction between mucus layers and airway epithelial surface, providing data on the mechanisms involved in mucus adherence and, hence, clues as to novel therapies for CF lung disease.
Conflict of Interest Statement:None of the authors has a financial relationship with a commercial entity that has an interest in the subject of this manuscript.
References
1. Tarran R, Button B, Picher M, Paradiso AM, Ribeiro CM, Lazarowski ER, Zhang L, Collins PL, Pickles RJ, Fredberg JJ,et al.Normal and cystic fibrosis airway surface liquid homeostasis: the effects of phasic shear stress and viral infections.J Biol Chem2005;280:35751–35759. 2. Matsui H, Grubb BR, Tarran R, Randell SH, Gatzy JT, Davis CW, Boucher RC. Evidence for periciliary liquid layer depletion, not abnormal ion composition, in the pathogenesis of cystic fibrosis airways disease.Cell1998;95:1005–1015.
3. Boucher RC. Evidence for airway surface dehydration as the initiating event in CF airway disease.J Intern Med2007;261:5–16.
4. Mall M, Grubb BR, Harkema JR, O’Neal WK, Boucher RC. Increased airway epithelial Na1 absorption produces cystic fibrosis-like lung
disease in mice.Nat Med2004;10:487–493.
5. Randell SH, Walstad L, Schwab UE, Grubb BR, Yankaskas JR. Isolation and culture of airway epithelial cells from chronically in-fected human lungs.In Vitro Cell Dev Biol Anim2001;37:480–489. 6. Willumsen NJ, Boucher RC. Transcellular sodium transport in cultured
cystic fibrosis human nasal epithelium.Am J Physiol1991;261:C332– C341.
7. Willumsen NJ, Boucher RC. Sodium transport and intracellular sodium activity in cultured human nasal epithelium.Am J Physiol1991;261: C319–C331.
8. Ribeiro CM, Paradiso AM, Carew MA, Shears SB, Boucher RC. Cystic fibrosis airway epithelial Cai21signaling: the mechanism for the larger
agonist-mediated Cai21signals in human cystic fibrosis airway
epi-thelia.J Biol Chem2005;280:10202–10209.
9. Horn R, Marty A. Muscarinic activation of ionic currents measured by a new whole-cell recording method.J Gen Physiol1988;92:145–159. 10. Fulcher ML, Gabriel S, Burns KA, Yankaskas JR, Randell SH.
Well-differentiated human airway epithelial cell cultures. Methods Mol Med2005;107:183–206.
11. Paradiso AM, Ribeiro CM, Boucher RC. Polarized signaling via purinoceptors in normal and cystic fibrosis airway epithelia.J Gen Physiol2001;117:53–67.
12. Tarran R, Boucher RC. Thin-film measurements of airway surface liquid volume/composition and mucus transport rates in vitro.Methods Mol Med2002;70:479–492.
13. Rokaw MD, Sarac E, Lechman E, West M, Angeski J, Johnson JP, Zeidel ML. Chronic regulation of transepithelial Na1transport by the
rate of apical Na1entry.Am J Physiol1996;270:C600–C607.
14. Sims DE, Westfall JA, Kiorpes AL, Horne MM. Preservation of tracheal mucus by nonaqueous fixative.Biotech Histochem1991;66:173–180. 15. Sheehan D, Hrapchak B. Theory and practice of histotechnology.
Columbus, Ohio: Battelle Press; 1980.
16. Knowles MR, Robinson JM, Wood RE, Pue CA, Mentz WM, Wager GC, Gatzy JT, Boucher RC. Ion composition of airway surface liquid of patients with cystic fibrosis as compared with normal and disease-control subjects.J Clin Invest1997;100:2588–2595.
17. Knowles MR, Stutts MJ, Spock A, Fischer N, Gatzy JT, Boucher RC. Abnormal ion permeation through cystic fibrosis respiratory epithe-lium.Science1983;221:1067–1070.
18. Knowles M, Murray G, Shallal J, Askin F, Ranga V, Gatzy J, Boucher R. Bioelectric properties and ion flow across excised human bronchi.
J Appl Physiol1984;56:868–877.
19. Willumsen NJ, Davis CW, Boucher RC. Intracellular Cl2activity and
cellular Cl2pathways in cultured human airway epithelium. Am J Physiol1989;256:C1033–C1044.
20. Willumsen NJ, Davis CW, Boucher RC. Cellular Cl2transport in cultured
cystic fibrosis airway epithelium.Am J Physiol1989;256:C1045–C1053. 21. Harris SI, Balaban RS, Barrett L, Mandel LJ. Mitochondrial respiratory capacity and Na1- and K1-dependent adenosine
triphosphatase-mediated ion transport in the intact renal cell.J Biol Chem 1981; 256:10319–10328.
22. Lubarski I, Pihakaski-Maunsbach K, Karlish SJ, Maunsbach AB, Garty H. Interaction with the Na,K-ATPase and tissue distribution of FXYD5 (related to ion channel).J Biol Chem2005;280:37717–37724. 23. Jornot L, Rochat T, Caruso A, Lacroix JS. Effects of amphotericin b on ion transport proteins in airway epithelial cells.J Cell Physiol2005; 204:859–870.
24. Tarran R, Grubb BR, Parsons D, Picher M, Hirsh AJ, Davis CW, Boucher RC. The CF salt controversy: In vivo observations and therapeutic approaches.Mol Cell2001;8:149–158.
25. Schultheiss G, Lan Kocks S, Diener M. Stimulation of colonic anion secretion by monochloramine: Action sites.Pflugers Arch2005;449: 553–563.
26. Ito Y, Nakayama S, Son M, Kume H, Yamaki K. Protection by tetra-cyclines against ion transport disruption caused by nystatin in human airway epithelial cells.Toxicol Appl Pharmacol2001;177:232–237. 27. Son M, Ito Y, Sato S, Ishikawa T, Kondo M, Nakayama S, Shimokata K,
Kume H. Apical and basolateral ATP-induced anion secretion in polarized human airway epithelia.Am J Respir Cell Mol Biol2004;30: 411–419.
28. Coutinho A, Silva L, Fedorov A, Prieto M. Cholesterol and ergosterol influence nystatin surface aggregation: Relation to pore formation.
Biophys J2004;87:3264–3276.
29. Haas M, McBrayer DG. Na-K-Cl cotransport in nystatin-treated tra-cheal cells: regulation by isoproterenol, apical utp, and [cl]i.Am J Physiol Cell Physiol1994;266:C1440–C1452.
30. Tarran R, Trout L, Donaldson SH, Boucher RC. Soluble mediators, not cilia, determine airway surface liquid volume in normal and cystic fibrosis superficial airway epithelia.J Gen Physiol2006;127:591–604. 31. Button B, Picher M, Boucher RC. Differential effects of cyclic and constant stress on ATP release and mucociliary transport by human airway epithelia.J Physiol2007;580:577–592.
32. Kunzelmann K, Schreiber R, Cook D. Mechanisms for the inhibition of amiloride-sensitive Na1absorption by extracellular nucleotides in
mouse trachea.Pflugers Arch2002;444:220–226.
33. Livraghi A, Randell SH. Cystic fibrosis and other respiratory diseases of impaired mucus clearance.Toxicol Pathol2007;35:116–129. 34. Chernick WS, Barbero GJ. Composition of tracheobronchial secretions
in cystic fibrosis of the pancreas and bronchiectasis.Pediatrics1959; 24:739–745.
35. Boitano S, Woodruff ML, Dirksen ER. Evidence for voltage-sensitive, calcium-conducting channels in airway epithelial cells.Am J Physiol
1995;269:C1547–C1556.