The Layered Fabric of
Cerebral Artery Fenestrations
Helen M. Finlay, BSc; Peter B. Canham, PhD Background and Purpose Intravascular bridges, resulting
from developmental anomalies of brain arteries, are now better known as arterial fenestrations. Their tendency to develop aneurysms, similar to arterial bifurcations, makes their anatomy and microstructure important for study.
Methods Six segments of artery, each including a
fenestra-tion (five from the vertebrobasilar juncfenestra-tion and one from the middle cerebral artery), were pressure distended, fixed, and sectioned. We made three-dimensional orientation measure-ments of smooth muscle and collagen, stained to enhance their birefringence, using the polarized light microscope.
Results The general contour of the fenestrations is
stream-lined, with a thickened layered subendothelium at the trailing or distal edge, structurally similar to the region of convergence of major brain arteries. Defects of the medial layer were found at both proximal and distal edges of all the fenestrations. Results included regional mean orientations of individual layers, with circular SDs. The medial layer was found to be
T
he recognition of the fenestration aneurysm as a clinical problem has emerged along with the continual improvement of resolution in the methods of angiography for assessing blood flow. From a radiological perspective, the fenestration is an open-ing or absence of angiographic dye carried by the blood, which arises because of the separation of blood flow around an obstacle or "bridge" spanning the vessel lumen. The term fenestration now has wide acceptance because of its clinical relevance as a site of aneurysm formation.1'2 Although the recent focus has been on the radiological appearance,3 there has been another per-spective on the same vessel anomaly, which has been as an anatomic structure that has a local influence on blood flow. Busse," Hassler,56 and Stehbens7 described them as intra-arterial bridges, cords, or pillars.The fenestration of arteries is a developmental anom-aly found primarily in brain arteries in the area of the circle of Willis and resulting from the specific process of the fusion of separated vessels in the early fetal stage.8 In some cases this fusion is incomplete, leaving a duplication of the vessel that may range in length from 1 or 2 mm to a complete doubling of the artery. The appearance of this duplication is of a fenestration or
Received March 11, 1994; final revision received June 7, 1994; accepted June 9, 1994.
From the Department of Medical Biophysics, University of Western Ontario, and The John P. Robarts Research Institute, London, Ontario, Canada.
Reprint requests to H.M. Finlay, Department of Medical Bio-physics, University of Western Ontario, London, Ontario N6A 5C1, Canada.
O 1994 American Heart Association, Inc.
coherently aligned perpendicular to the direction of blood flow, with a mean circular SD of 12°. The adventitia was less coherent (mean circular SD, 16°) with the same average orientation, and the multilayered subendothelium had layers of obliquely oriented fibers with a wide range of coherence for individual fiber groups. Layers of the side regions were anal-ogous to those in segments of brain artery and differed significantly from the proximal and distal edges of the fenes-tration structure.
Conclusions The plasticity of form of the fenestrations at
both the proximal and distal edges is in response to hemody-namic forces and is analogous to branching regions of brain arteries. Medial defects, a common feature in both brain arteries and fenestrations, may predispose the arterial fenes-tration to aneurysm formation. (Stroke. 1994^5:1799-1806.)
Key Words • cerebral aneurysm • cerebral arteries •
collagen • muscle, smooth • fenestration
"window" that perforates the artery. If the duplication is very short, the outward appearance is of a small dimple or pit on the vessel wall. When envisaged from a hemodynamic perspective, the divider is seen as an oval, streamlined pillar, traversing the vessel lumen, and flaring at each end to merge again with the contour of the artery wall.
The most common sites of these fenestrations or bridges are in the area of the anterior communicating artery or in the basilar artery.5'9'10 The frequency of occurrence for all sites in the human brain circulation was 16% reported at the time of autopsy5 or 12% angiographically.10 The fenestrations that constitute the subject of this study are relatively small, with the largest approximately 5 mm long, and all involve a complete vessel duplication over a short distance. Five were located in the basilar artery near the vertebral junction and one in the middle cerebral artery.
From clinical reports we are aware of the vulnerabil-ity of the fenestrated artery to aneurysm formation,11 leading to the inference that fenestrations have a struc-tural similarity to bifurcations in major cerebral vessels. We undertook to obtain quantitative stereological data that could reveal the strength of this similarity. Two major components of the blood vessel wall are smooth muscle cells and collagen. Both have long, thin fibers as their structural units, and hence directional organiza-tion is basic to their biological funcorganiza-tion. Smooth muscle cells and the fibrillary collagens, types I and III, are principal components of intravascular bridges and brain arteries. They are weakly birefringent, each with its optical axis parallel to its morphological axis.12-13 Bire-fringent enhancement stains are effective for improving
Elevation Angle
Azimuth Angle
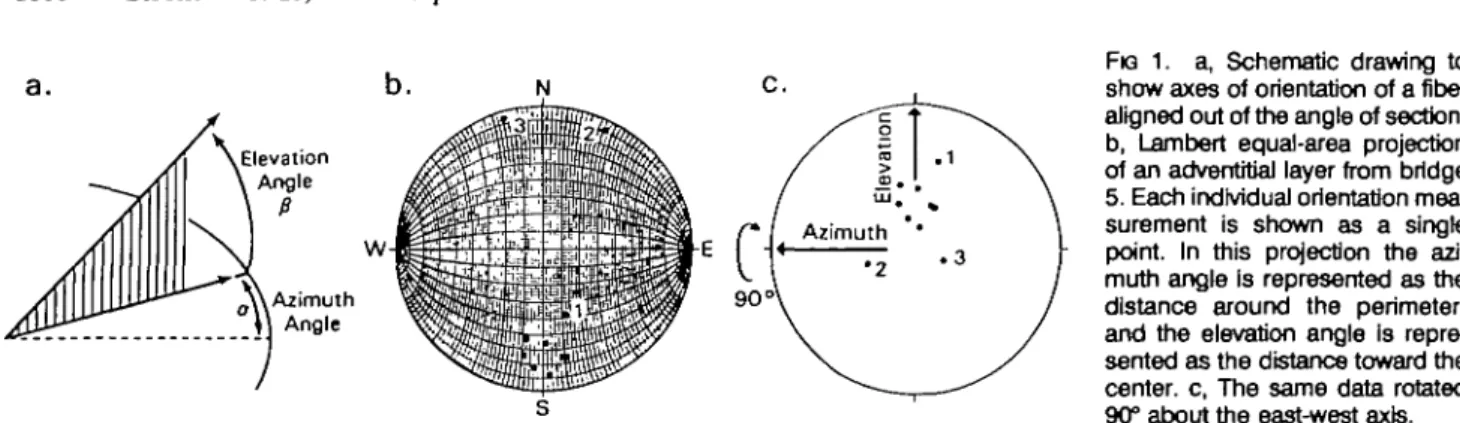
FIG 1. a, Schematic drawing to show axes of orientation of a fiber aligned out of the angle of section, b, Lambert equal-area projection of an adventitial layer from bridge 5. Each individual orientation mea-surement is shown as a single point. In this projection the azi-muth angle is represented as the distance around the perimeter, and the elevation angle is repre-sented as the distance toward the center, c, The same data rotated 90° about the east-west axis.
the strength of birefringence (eg, picrosirius red or James' silver impregnation,1413) and permit more pre-cise measurement of orientation through the polarized light microscope. The universal stage has been the principal instrument for the present study. It extends the effectiveness of the polarizing microscope by en-abling measurements of three-dimensional orientation directly from stained tissue sections. By means of these microscopic techniques we assessed the structural sim-ilarity between fenestrations and the fabric of the nearby artery and also examined the subendothelium, which is a hemodynamically adaptive part of the bridge and artery wall.
Materials and Methods
Six fenestrations, each from a different autopsy, were ob-tained as part of our studies on cerebral arteries. Five were located in the basilar artery near the junction of the vertebral arteries and the sixth in a middle cerebral artery. They were all found by examination of the external appearance of the vessels, where the existence of a fenestration is indicated by a small depression or dimple in the outer wall. Segments of artery including an individual fenestration were isolated from the circle of Willis, ligated, and fixed under a distending pressure of 14.7 kPa (110 mm Hg) in 10% neutral-buffered formalin. They were embedded in paraffin and sectioned at 7-/i.m thickness. Four of the structures were cut in cross section, which is the longitudinal plane for the artery, parallel to the plane of the joining vertebral arteries, and the other two were cut approximately longitudinally, as determined by the cross-sectional plane of the principal artery. In the case of the fenestration in the middle cerebral artery, the longitudinal axis was not parallel to the cross-sectional plane of the vessel, and the geometry of individual sections was variable. Several sections spanning the extent of individual fenestrations were stained with James' silver impregnation to enhance the bire-fringence of muscle and collagen fibers or with picrosirius red, which is specific for collagen fibers.16 Slides nearby in the sequence to those studied for orientation were stained with Gomori's trichrome17 to aid in differentiation of the areas of
smooth muscle and collagen or with a modified Movat's pentachrome for elastin.18
The study was divided into two parts, the first focusing on geometric factors, including location, size, type, and number of the tissue layers of each fenestration, and the second focusing on the three-dimensional structure of the individual layers, relating them to the equivalent layers within the artery wall. Measurements of the location and dimensions of the fenestra-tions were made from traced secfenestra-tions obtained on a projection microscope and by the use of photomicrographs. The length, height, and width of each fenestration were calculated, as well as its position relative to the vessel wall, to the apex of the converging vertebral arteries, and to other vessel branches. We investigated the continuity of the layers around the
fenestra-tion regions by following the major tissue components identi-fied on sections stained with Gomori's trichrome.
Fabric organization was measured within each of the four fenestrations cut in cross section and from one longitudinally sectioned by the use of the polarizing microscope and univer-sal stage. In each case one section was selected from near the geometric center of the fenestration. One set of readings was also taken from toward theend of one of the structures (bridge 2), in an area where its fabric was merging into the adjacent vessel wall.
Each measurement was made as a pair of orientation values, an azimuthal angle and an elevation angle, that uniquely define three-dimensional orientation (Fig la). An individual measurement of orientation can be made from any area of coherently aligned tissue of approximately 4 to 5 /im or from 8 to 10 jim of tissue if the alignment is out of the plane of the section. The number of readings from individual layers varied, being higher in number if the region was larger in size and less coherent. Fewer readings were taken for particularly coherent areas (shown by a sweeping band of extinction as the micro-scope stage is rotated) either because extra readings were not needed statistically or because measurements were not possi-ble owing to low birefringence or lack of localized coherence. The data were plotted on a Lambert equal-area projection, as illustrated in Fig lb, in which each point represents the orientation of a single reading. The Lambert projection is a circular graph on which are mapped the positions distributed over a three-dimensional hemisphere, with each position de-fining a line in space, through the center of the hemisphere, with the azimuthal angle lying in the equatorial plane of the hemisphere and the elevation angle the amount of elevation away from the equatorial plane. Initially the data were re-corded relative to the azimuthal alignment of one edge of the microscope slide, and the distance from the outer "rim" of the Lambert projection is the elevation angle. Point 3, for exam-ple, lies at an azimuth of 344° with an elevation of +7° (and has the equivalent orientation of —16° azimuth and +7° of eleva-tion). Rotation by computer techniques made it possible to align data relative to a biologically meaningful reference. The data on the projection of Fig lc were rotated 90° around the east-west axis with the new elevation and azimuthal zero references at the center. The two single points appearing at the top in Fig lb are seen when rotated to be part of the main population of data, which has a mean azimuth of -1° and elevation of -21°.
We have become familiar with this method of analysis, originally learned from methods in physical geology,19 through our research on the blood vessel wall.2023 Analysis by circular statistics was undertaken2*; each cluster of measurements has a mean orientation and a circular standard deviation (CSD), which is a measure of the scatter about the mean and identifies the circular angle containing 63% of the data on the hemi-sphere (similar to the SD in conventional statistics).23-26
A strength of the quantitative method for three-dimensional orientation data is that statistical measures can be obtained. Error relating to a single reading depends on strength of
birefringence, degree of coalignment in the region of the measurement, and elevation angle of the local fabric being measured, with the highest precision for fibers aligned parallel to the section plane.21 An estimate of the repeatability was obtained from one of the sections of bridge 1 by marking precisely, on a photomicrograph, the positions at which a first set of 67 readings was made; at a later time the section was remounted on the universal stage and the micrograph used to relocate the positions for a repeated set of measurements. Readings were taken and were analyzed from the media and subendothelium on both sides of the fenestration and the distal (or downstream) side of the subendothelium. The abso-lute difference between the mean orientations of each region was 1° or less, whether comparing the azimuth or the elevation angle, and the measure of dispersion (the CSD) was also nearly the same between the two sets. This was an important result because individual pairs did not each have the same values for azimuth or elevation, chiefly because it was not always possible to relocate the exact position for making the repeated measurement. (Three instances, for example, had differences between 10° and 14°, indicating that we had not relocated the exact fiber location of the first reading.)
An additional set of readings was made from another section of the same fenestration separated from the first by 140
fim to give an indication of the structural consistency within an
individual fenestration (provided in "Results"). Results
Qualitative Observations
The two contrasting images of a fenestration either as a separate structure dividing blood flow, much like an island in a stream, or as the side-by-side region of two adjacent parallel arteries were highlighted by our con-struction of two three-dimensional models. The recon-structions in Fig 2 convey representations of the true three-dimensional structure in vivo (made possible by the tissue preservation at arterial distending pressure of 110 mm Hg). The rheological impact of the fenestration as a tapered slender bridge is revealed in the model of reassembled longitudinal sections (Fig 2a). Our subse-quent use of the term "bridge" emphasizes the concept of a distinct structure within the lumen of the parent vessel, as opposed to the term "fenestration," which puts more emphasis on the perforation of the vessel as visualized from outside.
Tracings reproduced here of bridges 1 and 2 (Fig 3) convey the general shape and positioning relative to the basilar artery entrance. The adjacent low-power photo-micrographs reveal (1) the similarity of the points of flow convergence (the trailing edge of the bridge and the flow convergence of the vertebral arteries), (2) the contrast in amount of subendothelium between the leading and trailing edges of the fenestration, and (3) the underlying medial gap or medial defect, which has been recognized as characteristic of the apex regions of brain arteries.27 The "fineness ratio," ie, the ratio of length to width of structures in a fluid flow field,2* varied widely, being 8.2 for bridge 2, 2.4 for bridge 1, and 9.5 for bridge 5. (The ratio for bridge 5 was calculated by means of section thickness and the number of serial cross sections of the basilar artery needed to extend through the bridge in the midregion.) Bridge 1 is longitudinally aligned with the apex of the convergence of the feeder arteries and therefore off center in the basilar artery. It has a very substantial buildup of subendothelium, with an outer profile aligned approxi-mately with the estimated direction of blood flow.
1 mm
FIG 2. Reconstructed scale models of bridge 3 sectioned along the direction of the vessel axis (a) and bridge 5 with the main vessel in cross section (b).
However, the "structural" axis, identified by the muscle cells of the tunica media bordering the tunica adventitia at the inner core of the fenestration, is aligned off axis, at approximately 20°.
Polarized light micrographs can be used to indicate general organization, with local regions of birefringent fabric appearing alternately bright and dark, under the microscope as the stage is rotated through 360°. Extinc-tion (blackness) occurs when the optical axis of the localized region of tissue lies parallel to either the polarizer or the analyzer filter axis, and thus extinction is repeated four times in each 360° cycle. The narrow-ness of the extinction band relates to the way one perceives relative light intensity, which is on a logarith-mic scale, with maximum brightness occurring midway between two orientations identifying extinction. The positions of maximum transmitted light are broad, with an uncertainty of approximately 10° to 15°, and align-ment for extinction can be very precise (approximately 2° to 3°). (As part of an earlier study we made a graphic demonstration of this principle on collagen fibers in tissue sections of porcine heart valve.21) Examination of the sections stained with picrosirius red under polarized light revealed the adventitia to have speckled brightness at all orientations, consistent with layered wavy fibers that are without localized regions of coherence. The generally dark tunica media at all orientations has two interpretations: either a region lacking birefringence or
a. Results From Layers of Four Bridges Cut In Cross Section
FK3 3. a, Tracing of midbridge area of bridge 1, to illustrate the geometric arrangement within the artery, and a micrograph of a trichrome-stained section. There is an inner core of adverrtJtia, with medial tissue on either side; several layers of subendothe-lium can be identified. The bridge dimensions for height, length, and width were 1.4,1.4, and 0.6 mm, respectively, b, Tracing of bridge 2, comparing vertebral artery junction and the distal end of the bridge. The polarized light micrographs were of sections stained with picroslrlus red. Bridge dimensions for height, length, and width were 1.5, 3.6, and 0.5 mm, respectively.
tissue aligned approximately perpendicular to the sec-tioning plane; the latter was found to be true when the section was assessed on the universal stage. The suben-dothelial buildup in the "outer" layers of bridges 1 and 2 is relatively strongly birefringent, and the threadlike local zones of birefringence are indicative of more organized alignment than the collagen in the adventitia. The layered appearance at the convergence points of the vertebral arteries and at the trailing edge of the fenestrations is caused partly by abrupt changes in general organization and changes in birefringence.
Analysis of the transversely sectioned basilar artery that includes bridge 5 revealed the same microscopic structure with an absence of continuous media at both ends, ie, medial defects, and a very thickened subendo-thelium distally. (Medial defects have been noted at the proximal end of fenestrations by Crompton29 and at both ends by Black and Ansbacher.30) Reconstruction of the sixth fenestration from the middle cerebral artery was not attempted. The appearance was that it passed obliquely across the vessel wall, with a broader attach-ment at one end than the other. There was still the
Bridge 1 Media side 1 Media side 2 Subendothellum side 1 Subendothelium side 2 Subendothelium distal 2 Media side 1 Media side 2 Subendothelium side 1 Subendothelium side 2 Subendothelium distal t Media side 1 Media side 2 Inner* subendothelium side 1 Outer* subendothelium side 1 Inner subendothelium side 2 Outer subendothelium side 2 Subendothelium distal A 4 Media side 1 Media side 2 Subendothelium side 1 Subendothelium side 2 Subendothelium distal n 9 9 17 13 9 12 12 12 13 7 5 7 7 6 6 11 3 10 10 11 10 7 Azimuth,0 - 8 1 - 8 6 13 - 1 - 4 6 - 7 9 39 0 - 4 6 - 7 6 64 1 0 2 - 1 79 - 1 0 - 2 1 3 41 5 Elevation, ° 60 85 - 3 2 50 - 5 5 69 - 4 1 55 66 89 - 4 12 6 4 42 - 5 0 54 - 2 0 - 4 3 2 CSD, ° 9 20 30 9 31 13 13 17 23 45 14 37 11 11 22 20 28 19 20 13 39 11 n indicates the number of individual orientation measure-ments, widely distributed throughout each layer; CSD, circular SD. Azimuth and elevation angles are the alignments within and outside of the section plane, respectively.
*lnner subendothelium is adjacent to the media; outer Is next to the blood flow.
impression of two separate vessels being formed, al-though they were of unequal size and with an irregular shape, and in this case the main vessel had a smaller branch distal to the fenestration.
Quantitative Results
Measurements of three-dimensional orientation were made from the four bridges that were sectioned trans-versely. Since each has a different shape and structural composition, we were unable to average the results and instead presented the data in tabular form for each midsection analyzed (Table). In each case, the section judged to be at the middle of the bridge was selected for detailed measurement. We grouped sets of results ac-cording to their "radial" position around the bridge within the individual layers, and in some cases the
adventitia media
layered subendo-thelium
FIG 4. Traced section of bridge 1, from which sets of measure-ments were made from the regions selected. The Lambert projections show the distribution of readings from each layer, along with statistical data. In these projections (as in Fig 1b) the azimuth (Az) is measured by the distance around the perimeter, and the elevation (Elev) is the distance inward. A point at the north pole would be a fiber In the plane of the section and parallel to the edge of the layer at that region, and a point at the center would be a fiber oriented directly out of the microscope section. CSD Indicates circular SD.
subendothelial part was also subdivided into areas of distinct coalignment. We kept separate the readings from the two opposite sides of the fenestration (micro-graphs of Fig 3), since each side is associated with a different one of the two duplicated vessels. Each direc-tion measurement was calculated relative to the tangent taken at that point of the outer profile of the fenestra-tion. Relatively high values of CSD for the media result from the pooling of measurements along the whole fenestration length. Much lower CSD values were ob-tained when measurements were from narrow zones, as in Fig 4.
In all measured sections, the elevation angle in the medial layer was high, indicating mean fiber orienta-tions toward the bridge axis (or the direction labeled H in Fig 6). The high azimuth angles associated with these show a radially oriented component because of the plane of sectioning. The low angles of the side suben-dothelial regions of bridges 1 through 3 reveal mean alignments oriented around the perimeter of the bridge structure. In these three fenestrations the measure-ments from the distal end were aligned obliquely, with a high CSD in each case. The distinct differences in values seen in bridge 4 indicate that the plane of sectioning was oblique to the bridge axis.
In "Materials and Methods" we reported the results of repeating measurements from the same section, which was a midsection, S2, for bridge 1. We also compared those measurements with similar regions of the same fenestration on section Sx (140 fim away)
included in the Table. The angular separations of the mean orientations were 14° and 20° in the two medial regions, 6° and 7° in the side subendothelium, and 37° in the end subendothelium regions, and the CSD was almost identical in both layers on one side but approx-imately 50% higher on side 2 and the end subendothe-lium than those shown in the Table (bridge 1). Both sections appeared to be close to the middle of the bridge, but it may be that section S? of the repeated
readings was in fact toward one end. The inference drawn from these comparisons is that the fenestration microstructure is much more varied than arterial micro-structure revealed in earlier studies along straight seg-ments of brain artery.
Additional measurements were taken from one of the fenestrations to explore the transition region where the bridge merges with the main artery, in the area that would be seen as a dimple on the artery wall. The section used was 380 pm from the midsection of bridge 2 and had the appearance of a slightly flattened vessel turned inside out, with the adventitia on the inside and the subendothelial layer on the outside. Results from this end region, when compared with bridge 2 from the Table, showed little change in the mean orientation of the side subendothelial layer. At the distal end of the subendothelium, however, the mean elevation angle was 37° lower, with a similar decrease in elevation in the side medial regions, consistent with the flaring out at the attachment of the bridge to the artery wall. In this region it was also possible to make measurements of the media at the distal end, revealing a much higher elevation angle there than at the sides (69° compared with 17°).
In Fig 4 the Lambert projections and statistical summary of the readings from some individual data points are shown, with the locations of those points labeled on the schematically reproduced section for bridge 1. The Lambert projections included illustrate one set of measurements across a complete wall of one of the duplicated vessels. In this midfenestration region (as well as at both the proximal and distal ends), the medial and adventitial mean orientations are at high elevation angles relative to the section plane, with the adventitia having larger CSD values. The three suben-dothelial layers vary from being aligned in the plane of the section (along the vessel axis), in the layer adjacent to the media, to almost perpendicular in the outer layer, next to the blood flow. The thickened distal subendo-thelium shows a reversal of this pattern, with mean elevation angles of 50°, 31°, and 23° from media to lumen, and the proximal edge has an elevation of only 10° in the outer layer. This is in contrast to more circumferential orientations seen in this region of the normal artery subendothelium.
A similar composite of results was assembled for bridge 5, which is from a fenestrated basilar artery cut in cross section (Fig 5). Although the bridge is not presented in cross-sectional profile, the region is di-rectly comparable to straight sections of artery. Sets of measurements were taken across all the layers at six different locations, three from each of the duplicated vessels. Lambert projections of the results from one of the regions are included in Fig 5 and are similar for the other five regions. The tunica media, which served as the reference layer for many of our arterial studies on muscular arteries, is nearly perfectly aligned (CSDs between 4° and 6°, indicating a tightly coherent group of fibers as seen on the Lambert projections), with an average orientation that is almost exactly circumferen-tial (elevation angles and tangent referenced angles are low, shown as centrally positioned on the Lambert projection). Because of the different section plane, a high-elevation angle for this vessel represents a fiber longitudinally oriented along the vessel axis. The adven-titia is aligned mainly in the circumferential direction
two layers of subendothelium
FIG 5. Tracing of midfenestration area of bridge 5, from which readings were made across the complete wall in the six regions indicated. In this section plane the appearance of the fenestration is of two separate vessels. Lambert projections are of three layers from one of the regtans and are in the rotated projection (as in Fig 1c) so that a fiber oriented circumferentially along the vessel wall would be at the center of the graph, and one oriented out of the plane of the section would appear at the north or south pole. Az indicates azimuth; Elev, elevation, and CSD, circular SD.
around both the duplicated vessels, but with a higher scatter shown by CSDs from 8° to 22°. Subendothelial measurements reveal these data as part of circular helices at different degrees of pitch. (Fibers aligned longitudinally appear at either the north or south pole, as in the subendothelium, and circumferential fibers would have readings at the center.) One of the dupli-cated vessels revealed two layers of subendothelium: the mean elevation (helical) angle of the layer next to the media, from the three measured regions, was 75°, and that next to the lumen was 16°. These agree well with the helical angles of the comparable region of bridge 1 in Fig 4.
Discussion
Arterial development in the cerebral circulation has been thoroughly described by Padget,8 a description that makes clear the potential for incomplete fusions and tissue bridges across the luminal channel. Fusion of the two bilateral neural arteries to form the basilar artery takes place at a fetal age of 29 to 32 days, when the embryo length is 4 to 6 mm; the vertebral arteries form at 32 to 35 days (embryo length, 7 to 12 mm) and anterior communicating artery (which completes the circle of Willis) by 44 days (embryo length, 21 to 24 mm). Both the basilar and communicating arteries are the more common sites associated with intravascular bridges.
Fenestration aneurysms, although infrequent at the site of these fusion anomalies, have become recognized clinically by means of the improved diagnostic imaging of the cerebral circulation. The location of fenestration aneurysms varies widely, with the most common of all sites being the basilar artery.11 Earlier references fo-cused on the hemodynamic impact of the bridges on blood flow5-7 and the fact that they may be sites of thrombosis leading to arterial occlusion.'4-31 Hypertro-phy and thrombus formation appear again as themes in recent publications.32-33 The shape and structural
com-position of the fenestration combine either to result in a stable and benign structure or to have an intrinsic weakness and susceptibility to aneurysm formation.
Structural composition is revealed in three dimen-sions by the measurements from the universal stage. The central area of the fenestration is similar to the normal brain artery wall, with a multilayered, loosely organized tunica adventitia, a highly aligned circumfer-ential media, and a discretely layered subendothelium. All layers of the subendothelium are helically oriented, with the more longitudinally oriented fibers adjacent to the media and more circumferentially oriented fibers next to the lumen, as in brain arteries.23 Tissue sections cut longitudinally through the fenestration (the fenes-tration appearing as an island in the flow stream) reveal the full spectrum of microstructure from the leading to trailing edges, with the midsection appearing like nor-mal artery wall. The media is completely absent locally at both edges, corresponding, for the leading edge, to the medial gap of brain artery bifurcations,27 but the trailing edge medial gap occurs despite the substantial buildup of subendothelium. The trailing edge of the fenestration, corresponding hemodynamically and ana-tomically to the junction of two arteries, has a suben-dothelium aligned quite differently from the central region. There is less variation in collagen orientation from layer to layer and a continuously changing mean orientation over the saddle shape of the trailing edge (both from differing regions around the same section and from measurements on nearby sections).
The prominent layering that occurs at the trailing edge of the bridge, along with the contrasting negligible subendothelium at the leading edge of each bridge in our study, is a strong indicator of blood flow being the causative factor. One quantitative hemodynamic differ-ence between the leading and trailing edges is the fluid shear stress adjacent to the wall, which is generally higher around the leading edge than the trailing edge. (This difference exists despite the thin line or point of flow stagnation at both the leading and trailing edges where fluid shear stress is zero because blood flow divides around the bridge.)
Elastin is a minor component of the brain artery wall, appearing primarily in the internal elastic lamina. A deficiency has been noted particularly at regions of bifurcations.34 Using tissue sections stained with Mo-vat's pentachrome, we investigated the continuity of the internal elastic lamina of bridges 1, 2, and 3 in both the fenestration and the region of convergence of the vertebral arteries. In each case there was a marked discontinuity of the elastin at the leading edge, coincid-ing with the absence of media; at the trailcoincid-ing edge where the subendothelium is thickened, the elastin divided into several lamellae that followed the contours of the subendothelial tissue. Each lamella was continuous except in regions of the apex, where discontinuities were sometimes observed. The elastin of the pressure-fixed arteries appeared regular and smooth, and the region of the vertebral junction in our samples showed a division into lamellae at the apical region similar to the fenes-tration trailing edge.
Geometric data that are retrievable from serial sec-tions enabled us to explore implicasec-tions of the saddle-shaped leading and trailing edges of the fenestrations. The bridge wall sustains transmural arterial blood
3.0 si 2.5 C CD 2.0 1.5 1.0 0.5 bridge #2 -1.5 -1.0 -0.5 0.5 1.0 1.5 height (mm) W
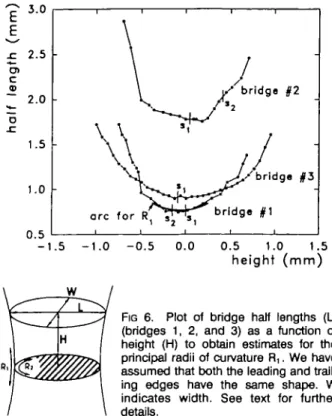
FIG 6. Plot of bridge half lengths (L) (bridges 1, 2, and 3) as a function of height (H) to obtain estimates for the principal radii of curvature R,. We have assumed that both the leading and trail-ing edges have the same shape. W indicates width. See text for further details.
sure (except in regions where the adventitial core layers may be in direct physical contact). These edge surfaces, like the apex or confluence points at junctions of arteries, have one principal radius of curvature that is positive and able to bear the load of transmural pres-sure, and one that is negative (R, and R2 in Fig 6). Because the negative radius of curvature is clearly smaller than the positive curvature, the direction of tension must be primarily in the direction of the positive curvature. An expression for relating transmural pres-sure (P), the principal radii (R! and R2), and unequal wall tensions (T, and T2) along those curvatures is a modification of the law of Laplace35: P=T1/R1-T2/R2, with R2 negative relative to R] (and thus responsible for the minus sign). From the serial section reconstructions we have one point for which both the principal radii of curvature can be estimated: R2 directly from the end curvatures of the middle tissue section of the longitudi-nally cut fenestration (eg, micrograph of midsection in Fig 3) and R] from dimensions of the serial section reconstructions. We made an estimate of the average positive curvature R, of the leading and trailing edges by plotting the half length of the bridge as a function of the height and chose the best-fitting local curvature by eye (Fig 6). As the principal radius of curvature, R, was expected to be approximately equal to the radius of the basilar artery. From Fig 6 we obtained values for R, of 0.61, 0.56, and 0.91 mm, compared with approximate values for R2 of 0.1 to 0.2 mm. From the fenestration in the cross-sectioned basilar artery (bridge 5), informa-tion is available to measure curvature of both ends separately. Calculated Rj values for the leading and trailing edges were both 1.7 mm. The inference struc-turally is that one might find a collagen backbone running along the direction of the curvature of the leading or trailing edge of a bridge, because that is the direction of principal load bearing.
In conclusion, we note that arterial fenestrations are relatively common and have been recognized for a long time; however, knowledge of their structure has only recently gained importance because of the clinical aware-ness of fenestration aneurysms. Our stereological mea-surements reveal that the layered multidirectional fabric of the subendothelium has clearly been molded by the mechanical forces of blood flow. This contrasts with the stable circumferential order of the tunica media and adventitia, similar to that of the artery wall, which provides the structural backbone of the fenestration.
Acknowledgments
This study was supported by the Heart and Stroke Founda-tion of Ontario. The authors would like to thank Jan Dixon for the histology and Michelle Adams for preparation of the manuscript. We would like to particularly acknowledge Dr Gary G. Ferguson for his suggestions concerning the impor-tance of fenestrations and advice on the manuscript.
References
1. Ferguson GG, Drake CG, Peerless SJ. Basilar fenestration aneu-rysms. In: Sugita K, ed. Inlracranial Aneurysms and Artenovenous Malformations. Nagoya, Japan: Nagoya University Press; 1990: 251-254.
2. San-Galli F, Leman C, Kien P, Khazaal J, Phillips SD, Guenn J. Cerebral arterial fenestrations associated with intracranial saccular aneurysms. Neurosurgery. 19923:279-283.
3. Osborn RE, Kirk G. Cerebral arterial fenestration. Comput RadioL 1987;11:141-145.
4. Busse O. Aneurysmen und Bildungsfehler der Arteria commu-nicans anterior. Virchows Arch A Pathol Anal. I921;229:178-2O6. 5. Hassler O. Morphological studies on the large cerebral arteries with reference to the aetiology of subarachnoid haemorrhage. Ada Psychiatr Scand. 1961;36{suppl 154):97-107.
6. Hassler O. Intra-arterial bridges in the larger cerebral arteries. Acta Radio! Diag. 1965;3:305-3O9.
7. Stehbens WE. Flow in experimental models simulating intravascular cords traversing the arterial lumen. Vase Surg. 1975;9:132-140. 8. Padget DH. The development of the cranial arteries in the human
embryo. Contrib EmbryoL 1948:32:205-262.
9. Moffat DB. The embryology of the arteries of the brain. Ann R CoU SurgEngi. 1962;30:368-382.
10. Wollschlaeger G, Wollschlaeger PB, Lucas FV, Lopez VF. Expe-rience and result with postmortem cerebral angiography per-formed as routine procedure of the autopsy. AJR Am J RoenXgenoL 1967;101:68-87.
11. Campos J, Fox AJ, Vinuela F, Lytyk P, Ferguson GG, Drake CG, Peerless SJ. Saccular aneurysms in basilar artery fenestration. AJNR Am J Nairoradiol 1987;8:233-236.
12. Fischer E. The birefringence of striated and smooth mammalian muscles. J Cell Comp PhysioL 1944;23:113-130.
13. Wolman M, Kasten FH. Polarized light microscopy in the study of the molecular structure of collagen and reticulin. Histochemistry. 1986;85:41-49.
14. Puchtler H, Waldrop FS, Valentine LS. Polarization microscopic studies of connective tissue stained with picrosirius red FBA. Bair Pathol 1973;150:174-187.
15. James KR. A simple silver method for the demonstration of reticulin fibres. J Med Lab Tech. 1967;24:49-51.
16. Junqueira LCU, Bignolas G, Brentani RR. Picrosirius staining plus polarization microscopy, a specific method for collagen detection in tissue sections. Histochem J. 1979;11:447-455.
17. Brown GG. An Introduction to Histotechnohgy. New York, NY: Appleton-Century-Crofts; 1978:223.
18. Movat HZ. Demonstration of all connective tissue elements in a single section. Arch Pathol 1955:60:289-295.
19. Starkey J. The contouring of orientation data represented in spherical projection. Can J Earth Set 1977;14:268-277.
20. Canham PB, Finlay HM, Dixon JG, Boughner DR, Chen A. Mea-surements from light and polarised light microscopy of human coronary arteries fixed at distending pressure. Cardiovasc Res. 1989;ll:973-982.
21. Finlay HM, Whittaker P, Hicks JG, Taylor CPS, Park YW, Canham PB. Spatial orientation of arterial sections determined from aligned vascular smooth muscle. JMicrosc. 1989;155:213-226.
22. Canham PB, Talman EA, Finlay HM, Dixon JG. Medial collagen organization in human arteries of the heart and brain by polarized light microscopy. Connect Tissue Res. 1991^26:121-134.
23. Finlay HM, Dixon JG, Canham PB. Fabric organization of the subendothelium of the human brain artery by polarized-light microscopy. Arterioscler Thromb. 1991;ll:681-690.
24. Fisher RA. Dispersion on a sphere. Proc R Soc Land. 1953;217: 295-305.
25. Tarling DH. Statistical analyses. In: Principles and Applications of Palaeomagnetism. London, England: Chapman and Hall; 1971: 72-85.
26. Fisher NI, Lewis T, Embleton BJJ. Statistical Analysis of Spherical Data. New York, NY: Cambridge University Press; 1987:101-151. 27. Stehbens WE. Medial defects of the cerebral arteries of man.
J Pathol BacterioL 1959;78:179-185.
28. Alexander RM. Animal Mechanics. 2nd ed. Oxford, England: Blackwell Scientific; 1983:1%.
29. Crompton MR. The pathology of ruptured middle-cerebral aneurysms with special reference to the differences between the sexes. Lancet. 1962;2:421-425.
30. Black SPW, Ansbacher LE. Saccular aneurysm associated with segmental duplication of the basilar artery. J Neurosurg. 1984;61: 1005-1008.
31. Takahashi M, Kawanami H, Watanabe N, Matsuoka S. Fenestratkm of the extracranial vertebral artery. Radiology. 1970^6:359-360. 32. Berry AD, Kepes JJ, Wetzel MD. Segmental duplication of the
basilar artery with thrombosis. Stroke. 1988;19:256-260. 33. Kalia KK, Pollack IF, Yonas H. A partially thrombosed,
fenes-trated basilar artery mimicking an aneurysm of the vertebrobasilar junction: case report. Neurosurgery. 1992;30:276-278.
34. Stehbens WE. Arterial structure at branches and bifurcations with reference to physical and pathological processes, including aneurysm formation. In: Schwartz CJ, Werthessen NT, Wolf SG, eds. Structure and Function of the Circulation. New York, NY: Plenum Publishing Corp; 1981;2:667-693.
35. Burton AC. Physical principles of circulatory phenomena: the physical equilibria of the heart and blood vessels. In: Hamilton WF, ed. Handbook of Physiology: Circulation, Vol 1, Section 2 Baltimore, Md: Waverry Press Inc; 1962:85-106.