C
Wate
Compr
er Trea
3rehens
atmen
Pr Cit Novem Pr AN 3900 Ambass Anchosive En
For
nt Plant
repared For ty of Huslia mber 11, 201 epared By: NTHC DEHE sador Drive, S rage, AK 995nergy A
t & Wa
14 Suite 301 508Audit
asheter
ria
Table
of
Contents
PREFACE ... 2
ACKNOWLEDGMENTS ... 3
1. EXECUTIVE SUMMARY ... 3
2. AUDIT AND ANALYSIS BACKGROUND ... 5
2.1 Program Description ... 5
2.2 Audit Description ... 5
2.3. Method of Analysis ... 6
2.4 Limitations of Study ... 7
3. Water Treatment Plant & Washeteria ... 8
3.1. Building Description ... 8
3.2 Predicted Energy Use ... 10
3.2.1 Energy Usage / Tariffs ... 10
3.2.2 Energy Use Index (EUI) ... 13
3.3 AkWarm© Building Simulation ... 14
4. ENERGY COST SAVING MEASURES ... 15
4.1 Summary of Results ... 15
4.2 Interactive Effects of Projects ... 16
5. ENERGY EFFICIENCY ACTION PLAN ... 19
Appendix A – Energy Audit Report – Project Summary ... 20
Appendix B – Actual Fuel Use versus Modeled Fuel Use ... 21
PREFACE
The Energy Projects Group at the Alaska Native Tribal Health Consortium (ANTHC) prepared
this document for The City of Huslia, Alaska. The authors of this report are Carl Remley,
Certified Energy Auditor (CEA) and Certified Energy Manager (CEM) and Gavin Dixon.
The purpose of this report is to provide a comprehensive document of the findings and analysis
that resulted from an energy audit conducted in January of 2014 by the Energy Projects Group
of ANTHC. This report analyzes historical energy use and identifies costs and savings of
recommended energy conservation measures. Discussions of site‐specific concerns, non‐
recommended measures, and an energy conservation action plan are also included in this
report.
This energy audit was conducted using funds from the United States Department of Agriculture
Rural Utilities Service as well as the State of Alaska Department of Environmental Conservation.
Coordination with the State of Alaska RMW Program and associated RMW for each community
has been undertaken to provide maximum accuracy in identifying audits and coordinating
potential follow up retrofit activities.
In the near future, a representative of ANTHC will be contacting both the City of Huslia and
the water treatment plant operator to follow up on the recommendations made in this audit
report. A Rural Alaska Village Grant has funded ANTHC to provide the City with assistance in
understanding the report and in implementing the recommendations. Funding for
implementation of the recommended retrofits is being partially provided for by the above listed
ACKNOWLEDGMENTS
The ANTHC Energy Projects Group gratefully acknowledges the assistance of Water Treatment
Plant Operators Darrell Vent and Emil Sam, and Huslia Mayor Lorraine Pavlick.
1.
EXECUTIVE
SUMMARY
This report was prepared for the City of Huslia. The scope of the audit focused on the Water
Treatment Plant & Washeteria. The scope of this report is a comprehensive energy study, which
included an analysis of building shell, interior and exterior lighting systems, heating and
ventilating systems, and plug loads.
The total predicted energy cost for the WTP is $51,254 per year. Electricity accounted for half
of the total energy cost with an annual cost of $25,394 per year. This includes $9,461 paid by
the end‐users and $15,933 paid by the Power Cost Equalization (PCE) program through the
State of Alaska. The WTP is predicted to spend $25,860 for #1 heating oil. These predictions
are based on the electricity and fuel prices at the time of the audit.
The State of Alaska PCE program provides a subsidy to rural communities across the state to
lower the electricity costs and make energy in rural Alaska affordable. In Huslia, the cost of
electricity without PCE is $0.51/kWh, and the cost of electricity with PCE is $0.19/kWh. The
figures used in this report represent the unsubsidized cost of electricity.
Table 1.1 below summarizes the energy efficiency measures analyzed for the Water Treatment
Plant & Washeteria. Listed are the estimates of the annual savings, installed costs, and two
different financial measures of investment return.
Table
1.1
PRIORITY
LIST
–
ENERGY
EFFICIENCY
MEASURES
Rank Feature Improvement Description Annual Energy Savings Installed CostSavings to Investment Ratio, SIR1 Simple Payback (Years)2 1 Other – Pump
Controls Connect well pump and raw water heat add controls; shut off heat add when pumping
$2,855 $2,500 15.45 0.9
2 Other – Reprogram existing generator thermostat
Lower unit heater set point
from 60 to 45 degrees $373 $350 14.42 0.9
3 Lighting - Tank
Hallway Replace lighting with new energy-efficient LED bulbs $19 $40 6.88 2.1 4 Lighting - Exterior
Lighting Replace lighting with new energy-efficient LED fixtures $308 $700 6.42 2.3 5 Lighting - Washeteria
Lighting Replace lighting with new energy-efficient LED bulbs $354 $1,560 3.32 4.4 6 Lighting – Water
Treatment Plant Replace lighting with new energy-efficient LED bulbs $357 $3,120 1.67 8.7 7 Lighting - Office Replace lighting with new
energy-efficient LED bulbs $59 $520 1.67 8.8
8 Lighting - Restroom
Table
1.1
PRIORITY
LIST
–
ENERGY
EFFICIENCY
MEASURES
Rank Feature Improvement Description Annual Energy Savings Installed CostSavings to Investment Ratio, SIR1 Simple Payback (Years)2 9 Lighting - Mechanical
Room Lighting Replace lighting with new energy-efficient LED bulbs $36 $500 1.04 14.1
TOTAL, all measures $4,390 $9,680 6.27 2.2
The following measures were not found to be cost-effective: 10 HVAC and
Circulating Water Heating
Add a Garn 2000 biomass boiler, Tekmar 256
controller, and shut off the boilers in the summer except when the washeteria is open. $10,358 + $1,000 Maint. Savings $276,000 10 HVAC And DHW
TOTAL, all measures $14,748
+ $1,000 Maint. Savings $285,680 TOTAL, all measures Table Notes:
1 Savings to Investment Ratio (SIR) is a life‐cycle cost measure calculated by dividing the total savings over the life of a project (expressed in today’s dollars) by its investment costs. The SIR is
an indication of the profitability of a measure; the higher the SIR, the more profitable the
project. An SIR greater than 1.0 indicates a cost‐effective project (i.e. more savings than cost).
Remember that this profitability is based on the position of that Energy Efficiency Measure
(EEM) in the overall list and assumes that the measures above it are implemented first.
2 Simple Payback (SP) is a measure of the length of time required for the savings from an EEM to payback the investment cost, not counting interest on the investment and any future changes in
energy prices. It is calculated by dividing the investment cost by the expected first‐year savings
of the EEM.
With all of these energy efficiency measures in place, the annual utility cost can be reduced by
$4,390 per year, or 8.6% of the buildings’ total energy costs. These measures are estimated to
cost $9,680, for an overall simple payback period of 2.2 years. The City of Huslia will see $663
of electricity savings after PCE while the State of Alaska PCE program will see $1,116 of
electricity savings.
It should be noted that the biomass boiler, while not cost effective for installation at the water
plant alone, will also serve the nearby Huslia clinic. With the additional economy of scale, the
biomass boiler can be a cost effective energy option for the community of Huslia. Even if the
project should prove to be ineffective at reducing costs, replacing fuel oil consumption with
local jobs and income from spruce wood harvesting is an appealing alternative.
Table 1.2 below is a breakdown of the annual energy cost across various energy end use types,
such as space heating and water heating. The first row in the table shows the breakdown for
the building as it is now. The second row shows the expected breakdown of energy cost for the
building assuming all of the retrofits in this report are implemented. Finally, the last row shows
the annual energy savings that will be achieved from the retrofits.
Table 1.2
Annual Energy Cost Estimate
Description Space Heating Space Cooling Water Heating Ventilation Fans Lighting Other Electrical Raw Water Heat Add Water Circulation Heat Tank
Heat Other Total Cost
Existing Building $529 $0 $3,899 $0 $3,486 $20,809 $9,650 $7,377 $4,201 $1,243 $51,254 With Proposed Retrofits $771 $0 $2,246 $0 $2,281 $20,871 $3,507 $4,019 $2,292 $458 $36,506 Savings ‐$242 $0 $1,653 $0 $1,205 ‐$62 $6,142 $3,358 $1,909 $785 $0 $14,748
2.
AUDIT
AND
ANALYSIS
BACKGROUND
2.1
Program
Description
This audit included services to identify, develop, and evaluate energy efficiency measures at the
Water Treatment Plant & Washeteria. The scope of this project included evaluating building
shell, lighting and other electrical systems, and heating and ventilating equipment, motors and
pumps. Measures were analyzed based on life‐cycle‐cost techniques, which include the initial
cost of the equipment, life of the equipment, annual energy cost, annual maintenance cost, and
a discount rate of 3.0%/year in excess of general inflation.
2.2
Audit
Description
Preliminary audit information was gathered in preparation for the site survey. The site survey
provides critical information in deciphering where energy is used and what opportunities exist
within a building. The entire site was surveyed to inventory the following to gain an
understanding of how each building operates:
• Building envelope (roof, windows, etc.)
• Heating and ventilation equipment
• Lighting systems and controls
• Building‐specific equipment
Water consumption, treatment & disposal
The building site visit was performed to survey all major building components and systems. The
site visit included detailed inspection of energy consuming components. Summary of building
occupancy schedules, operating and maintenance practices, and energy management programs
provided by the building manager were collected along with the system and components to
determine a more accurate impact on energy consumption.
Details collected from Water Treatment Plant & Washeteria enable a model of the building’s
energy usage to be developed, highlighting the building’s total energy consumption, energy
consumption by specific building component, and equivalent energy cost. The analysis involves
distinguishing the different fuels used on site, and analyzing their consumption in different
activity areas of the building.
Water Treatment Plant & Washeteria is classified as being made up of the following activity
areas:
1) Water Treatment Plant: 1,606 square feet 2) Washeteria: 561 square feet
In addition, the methodology involves taking into account a wide range of factors specific to the
building. These factors are used in the construction of the model of energy used. The factors
include:
• Occupancy hours
• Local climate conditions
• Prices paid for energy
2.3.
Method
of
Analysis
Data collected was processed using AkWarm© Energy Use Software to estimate energy savings
for each of the proposed energy efficiency measures (EEMs). The recommendations focus on
the building envelope; heating and ventilating; lighting, plug load, and other electrical
improvements; and motor and pump systems that will reduce annual energy consumption.
EEMs are evaluated based on building use and processes, local climate conditions, building
construction type, function, operational schedule, existing conditions, and foreseen future
plans. Energy savings are calculated based on industry standard methods and engineering
estimations.
Our analysis provides a number of tools for assessing the cost effectiveness of various
improvement options. These tools utilize Life‐Cycle Costing, which is defined in this context as
a method of cost analysis that estimates the total cost of a project over the period of time that
includes both the construction cost and ongoing maintenance and operating costs.
Savings to Investment Ratio (SIR) = Savings divided by Investment
Savings includes the total discounted dollar savings considered over the life of the
improvement. When these savings are added up, changes in future fuel prices as projected by
the Department of Energy are included. Future savings are discounted to the present to
account for the time‐value of money (i.e. money’s ability to earn interest over time). The
Investment in the SIR calculation includes the labor and materials required to install the
measure. An SIR value of at least 1.0 indicates that the project is cost‐effective—total savings
exceed the investment costs.
Simple payback is a cost analysis method whereby the investment cost of a project is divided
by the first year’s savings of the project to give the number of years required to recover the
cost of the investment. This may be compared to the expected time before replacement of the
system or component will be required. For example, if a boiler costs $12,000 and results in a
savings of $1,000 in the first year, the payback time is 12 years. If the boiler has an expected
life to replacement of 10 years, it would not be financially viable to make the investment since
the payback period of 12 years is greater than the project life.
The Simple Payback calculation does not consider likely increases in future annual savings due
to energy price increases. As an offsetting simplification, simple payback does not consider the
need to earn interest on the investment (i.e. it does not consider the time‐value of money).
Because of these simplifications, the SIR figure is considered to be a better financial investment
indicator than the Simple Payback measure.
Measures are implemented in order of cost‐effectiveness. The program first calculates
individual SIRs, and ranks all measures by SIR, higher SIRs at the top of the list. An individual
measure must have an individual SIR>=1 to make the cut. Next the building is modified and re‐
simulated with the highest ranked measure included. Now all remaining measures are re‐
evaluated and ranked, and the next most cost‐effective measure is implemented. AkWarm
goes through this iterative process until all appropriate measures have been evaluated and
installed.
It is important to note that the savings for each recommendation is calculated based on
implementing the most cost effective measure first, and then cycling through the list to find the
next most cost effective measure. Implementation of more than one EEM often affects the
savings of other EEMs. The savings may in some cases be relatively higher if an individual EEM is
implemented in lieu of multiple recommended EEMs. For example implementing a reduced
operating schedule for inefficient lighting will result in relatively high savings. Implementing a
reduced operating schedule for newly installed efficient lighting will result in lower relative
savings, because the efficient lighting system uses less energy during each hour of operation. If
multiple EEM’s are recommended to be implemented, AkWarm calculates the combined
savings appropriately.
Cost savings are calculated based on estimated initial costs for each measure. Installation costs
include labor and equipment to estimate the full up‐front investment required to implement a
change. Costs are derived from Means Cost Data, industry publications, and local contractors
and equipment suppliers.
2.4
Limitations
of
Study
All results are dependent on the quality of input data provided, and can only act as an
approximation. In some instances, several methods may achieve the identified savings. This
report is not intended as a final design document. The design professional or other persons
following the recommendations shall accept responsibility and liability for the results.
3.
Water
Treatment
Plant
&
Washeteria
3.1.
Building
Description
The 2,167 square foot Water Treatment Plant & Washeteria was constructed in 2008, with a
normal occupancy of 2 people. The number of hours of operation for this building average 10
hours per day, considering all seven days of the week.
The Huslia Water Treatment Plant houses a circulating water system with two loops that
provide water to residents of the community. The system consists of approximately 13,300
feet of pipe. One loop extends approximately 2800 feet to residents near the airport while the
second loop is approximately 10,500 feet long and serves the rest of the residents while also
being circulated through the old water treatment plant building. There is no additional heating
provided at the old water treatment plant building. The water treatment plant also circulates
hot water to the washeteria located in the same building. The washeteria contains four
washers and four dryers that are hydronically heated.
The raw water is treated with 2 vertical pressure filters. A boost pump is used to keep the
pressure up and increase the circulation rate of the system. The water is injected with chlorine
prior to entering the 150,000 gallon water storage tank.
The sewer system is gravity fed with a sewage lagoon located approximately 2000 feet from the
water treatment plant. A force main section is located on the western end of town.
Description of Building Shell
The exterior walls are of 2X6 constructed of frames with 5.5” polyurethane insulation. There is
1920 square feet of wall space.
The 2284 square foot roof of the building is a cathedral ceiling (hot roof). The roof has standard
24” framing with 2x6 construction and 5.5” of polyurethane insulation.
The floor/foundation of the building is constructed with 2x6 lumber and 5.5” polyurethane
insulation. There is 2167 square feet of floor space.
The windows in the building are double‐paned glass with wood frames. The combined window
space area is 32 square feet.
There are two entrances with one for the water treatment plant and one for the washeteria.
The water treatment plant entrance has a single metal door with a polyurethane core. The
washeteria has a single metal door in an arctic entry configuration. The arctic entry has
another door on the exterior. The total area of the doors is 42 square feet.
Description of Heating Plants
Burnham Boiler #1
Nameplate Information: Burnham Model PV89WT‐GBWF25 Fuel Type: #1 Oil
Input Rating: 234,500 BTU/hr Steady State Efficiency: 80 %
Idle Loss: 1.5 % Heat Distribution Type: Glycol Boiler Operation: All Year
Notes: Boilers were new in 2008
Burnham Boiler #2
Nameplate Information: Burnham Model PV89WTGBWF2S Fuel Type: #1 Oil
Input Rating: 234,500 BTU/hr Steady State Efficiency: 80 %
Idle Loss: 1.5 % Heat Distribution Type: Glycol Boiler Operation: All Year
Notes: Boilers were new in 2008
Space Heating Distribution Systems
The water treatment plant is heated with three unit heaters and some baseboard. The unit
heaters can each produce 10000 BTU/hr and had operational thermostats. The washeteria is
heated with baseboard.
Lighting
The water treatment plant is lighted with 12 fixtures with four T8 light bulbs in each fixture.
The mechanical room is lighted with three fixtures with four T8 light bulbs in each fixture. The
restroom is lighted with two fixtures with four T8 light bulbs in each fixture. The office is
lighted with two fixtures with four T8 light bulbs in each fixture. The washeteria is lighted with
six fixtures with four T8 light bulbs in each fixture. The chemical room is lighted with two 150W
incandescent lights. The tank hallway is lighted with two 26W fluorescent CFL lights. The
exterior of the building is lighted with two 70W magnetic lights.
Plug Loads
The WTP has a variety of power tools, a telephone, an electric dryer, and some other
miscellaneous loads that require a plug into an electrical outlet. The use of these items is
infrequent and consumes a small portion of the total energy demand of the building.
Major Equipment
The airport loop has a water circulation pump that uses 1880 watts. This pump is located in the
water treatment plant and is constantly running from approximately November through May.
The downtown loop has a water circulation pump that uses 3320 watts. This pump is located in
the water treatment plant and is constantly running from approximately November through
May.
There are two well pumps that are both operated at the same time. They use approximately
2100 watts combined and operate approximately two days per week.
There are two pressure pumps that combine to use 2984 watts. They are located in the water
treatment plant and run 20% of the time.
The generator building is heated with a temperature controlled block heater that uses 1500
watts when operating. The heater has a setpoint of 60 degrees F. The heater is in operation
50% of the time from November through May.
The washeteria has two electric washer units that combine to use 500 watts. They operate
approximately 15% of the time during a 10‐hour day.
3.2
Predicted
Energy
Use
3.2.1EnergyUsage/Tariffs
The electric usage profile charts (below) represents the predicted electrical usage for the
building. If actual electricity usage records were available, the model used to predict usage was
calibrated to approximately match actual usage. The electric utility measures consumption in
kilowatt‐hours (KWH). One KWH usage is equivalent to 1,000 watts running for one hour. The
basic usage charges are shown as generation service and delivery charges along with several
non‐utility generation charges.
The fuel oil usage profile shows the fuel oil usage for the building. Fuel oil consumption is
measured in gallons. One gallon of #1 Fuel Oil provides approximately 132,000 BTUs of energy.
The following is a list of the utility companies providing energy to the building and the class of
service provided:
Electricity: AVEC‐Huslia ‐ Commercial ‐ Sm
The average cost for each type of fuel used in this building is shown below in Table 3.1. This
figure includes all surcharges and utility customer charges but does not reflect the PCE subsidy:
Table 3.1 – Average Energy Cost
Description Average Energy Cost Electricity $ 0.51/kWh
3.2.1.1
Total
Energy
Use
and
Cost
Breakdown
At current rates, City of Huslia pays approximately $51,254 annually for electricity and other
fuel costs for the Water Treatment Plant & Washeteria.
Figure 3.1 below reflects the estimated distribution of costs across the primary end uses of
energy based on the AkWarm© computer simulation. Comparing the “Retrofit” bar in the
figure to the “Existing” bar shows the potential savings from implementing all of the energy
efficiency measures shown in this report.
Figure
3.1
Annual
Energy
Costs
by
End
Use
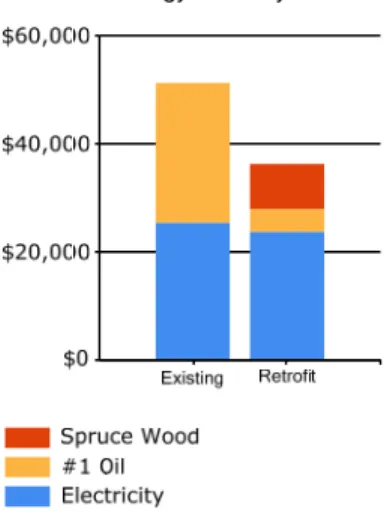
Figure 3.2 below shows how the annual energy cost of the building splits between the different fuels
used by the building. The “Existing” bar shows the breakdown for the building as it is now; the
“Retrofit” bar shows the predicted costs if all of the energy efficiency measures in this report are
implemented. $0 $20,000 $40,000 $60,000 Existing Retrofit Service Fees Other Tank Heat
Water Circulation Heat Raw Water Heat Add Other Electrical Lighting Water Heating Space Heating Annual Energy Costs by End Use
Figure
3.2
Annual
Energy
Costs
by
Fuel
Type
Figure 3.3 below addresses only Space Heating costs. The figure shows how each heat loss component
contributes to those costs; for example, the figure shows how much annual space heating cost is caused
by the heat loss through the Walls/Doors. For each component, the space heating cost for the Existing
building is shown (blue bar) and the space heating cost assuming all retrofits are implemented (yellow
bar) are shown.
Figure
3.3
Annual
Space
Heating
Cost
by
Component
The tables below show AkWarm’s estimate of the monthly fuel use for each of the fuels used in the
building. For each fuel, the fuel use is broken down across the energy end uses. Note, in the tables
below “DHW” refers to Domestic Hot Water heating.
Electrical Consumption (kWh)
Jan Feb Mar Apr May Jun Jul Aug Sept Oct Nov Dec
Space_Heating 24 22 25 24 25 24 25 25 24 35 24 24 DHW 64 59 65 63 65 64 66 66 64 65 62 64 Lighting 573 522 573 554 573 554 573 573 554 573 554 573 Other_Electrical 5340 4867 5340 5168 5340 884 914 914 884 914 5168 5340 Raw_Water_Heat_Add 33 31 34 33 34 36 37 37 35 35 32 33 Water_Circulation_Heat 45 41 46 45 47 0 0 0 0 0 44 45 Tank_Heat 34 28 26 13 0 0 0 0 2 15 26 34 Other 9 7 7 4 1 0 0 1 2 5 7 9
Fuel Oil #1 Consumption (Gallons)
Jan Feb Mar Apr May Jun Jul Aug Sept Oct Nov Dec
Space_Heating 7 6 7 7 8 8 9 9 8 13 7 7 DHW 73 67 74 72 75 78 80 80 77 77 71 73 Raw_Water_Heat_Add 197 180 198 193 202 209 216 215 207 208 192 197 Water_Circulation_Heat 268 245 269 262 274 0 0 0 0 0 260 268 Tank_Heat 203 168 150 79 0 0 0 0 10 86 156 200 Other 52 44 41 26 8 1 0 4 13 29 42 51
3.2.2 EnergyUseIndex(EUI)
Energy Use Index (EUI) is a measure of a building’s annual energy utilization per square foot of
building. This calculation is completed by converting all utility usage consumed by a building for
one year, to British Thermal Units (Btu) or kBtu, and dividing this number by the building square
footage. EUI is a good measure of a building’s energy use and is utilized regularly for
comparison of energy performance for similar building types. The Oak Ridge National
Laboratory (ORNL) Buildings Technology Center under a contract with the U.S. Department of
Energy maintains a Benchmarking Building Energy Performance Program. The ORNL website
determines how a building’s energy use compares with similar facilities throughout the U.S. and
in a specific region or state.
Source use differs from site usage when comparing a building’s energy consumption with the
national average. Site energy use is the energy consumed by the building at the building site
only. Source energy use includes the site energy use as well as all of the losses to create and
distribute the energy to the building. Source energy represents the total amount of raw fuel
that is required to operate the building. It incorporates all transmission, delivery, and
production losses, which allows for a complete assessment of energy efficiency in a building.
The type of utility purchased has a substantial impact on the source energy use of a building.
The EPA has determined that source energy is the most comparable unit for evaluation
purposes and overall global impact. Both the site and source EUI ratings for the building are
provided to understand and compare the differences in energy use.
The site and source EUIs for this building are calculated as follows. (See Table 3.4 for details):
Building Site EUI = (Electric Usage in kBtu + Fuel Oil Usage in kBtu)
Building Square Footage
Building Source EUI = (Electric Usage in kBtu X SS Ratio + Fuel Oil Usage in kBtu X SS Ratio)
Building Square Footage
Table 3.4
Water Treatment Plant & Washeteria EUI Calculations
Energy Type Building Fuel Use per Year Site Energy Use per Year, kBTU Source/Site Ratio Source Energy Use per Year, kBTU Electricity 49,846 kWh 170,123 3.340 568,212 #1 Oil 6,614 gallons 873,018 1.010 881,748 Total 1,043,141 1,449,960
BUILDING AREA 2,167 Square Feet
BUILDING SITE EUI 481 kBTU/Ft²/Yr
BUILDING SOURCE EUI 669 kBTU/Ft²/Yr
* Site ‐ Source Ratio data is provided by the Energy Star Performance Rating Methodology for Incorporating Source Energy Use document issued March 2011.
3.3
AkWarm©
Building
Simulation
An accurate model of the building performance can be created by simulating the thermal
performance of the walls, roof, windows and floors of the building. The HVAC system and
central plant are modeled as well, accounting for the outside air ventilation required by the
building and the heat recovery equipment in place.
The model uses local weather data and is trued up to historical energy use to ensure its
accuracy. The model can be used now and in the future to measure the utility bill impact of all
types of energy projects, including improving building insulation, modifying glazing, changing air
handler schedules, increasing heat recovery, installing high efficiency boilers, using variable air
volume air handlers, adjusting outside air ventilation and adding cogeneration systems.
For the purposes of this study, the Water Treatment Plant & Washeteria was modeled using
AkWarm© energy use software to establish a baseline space heating and cooling energy usage.
Climate data from Huslia was used for analysis. From this, the model was be calibrated to
predict the impact of theoretical energy savings measures. Once annual energy savings from a
particular measure were predicted and the initial capital cost was estimated, payback scenarios
were approximated. Equipment cost estimate calculations are provided in Appendix D.
Limitations of AkWarm© Models
• The model is based on typical mean year weather data for Huslia. This data represents the
average ambient weather profile as observed over approximately 30 years. As such, the gas and
electric profiles generated will not likely compare perfectly with actual energy billing
information from any single year. This is especially true for years with extreme warm or cold
periods, or even years with unexpectedly moderate weather.
• The heating and cooling load model is a simple two‐zone model consisting of the building’s
core interior spaces and the building’s perimeter spaces. This simplified approach loses
accuracy for buildings that have large variations in cooling/heating loads across different parts
of the building.
• The model does not model HVAC systems that simultaneously provide both heating and
cooling to the same building space (typically done as a means of providing temperature control
The energy balances shown in Section 3.1 were derived from the output generated by the
AkWarm© simulations.
4.
ENERGY
COST
SAVING
MEASURES
4.1
Summary
of
Results
The energy saving measures are summarized in Table 4.1. Please refer to the individual measure
descriptions later in this report for more detail.
Table
4.1
Water
Treatment
Plant
&
Washeteria,
Huslia,
Alaska
PRIORITY
LIST
–
ENERGY
EFFICIENCY
MEASURES
Rank Feature Improvement Description Annual Energy Savings Installed CostSavings to Investment Ratio, SIR Simple Payback (Years) 1 Other – Pump
Controls Connect well pump and raw water heat add controls; shut off heat add when pumping
$2,855 $2,500 15.45 0.9
2 Other – Reprogram existing generator thermostat
Lower unit heater set point
from 60 to 45 degrees $373 $350 14.42 0.9
3 Lighting - Tank
Hallway Replace lighting with new energy-efficient LED bulbs $19 $40 6.88 2.1 4 Lighting - Exterior
Lighting Replace lighting with new energy-efficient LED bulbs $308 $700 6.42 2.3 5 Lighting - Washeteria
Lighting Replace lighting with new energy-efficient LED bulbs $354 $1,560 3.32 4.4 6 Lighting – Water
Treatment Plant Replace lighting with new energy-efficient LED bulbs $357 $3,120 1.67 8.7 7 Lighting - Office Replace lighting with new
energy-efficient LED bulbs $59 $520 1.67 8.8
8 Lighting - Restroom
Lighting Replace lighting with new energy-efficient LED bulbs $30 $390 1.11 13.2 9 Lighting - Mechanical
Room Lighting Replace lighting with new energy-efficient LED bulbs $36 $500 1.04 14.1 TOTAL, cost-effective
measures $4,390 $9,680 6.27 2.2
The following measures were not found to be cost-effective:
10 HVAC and Circulating Water Heating
Add a Garn 2000 biomass boiler, Tekmar 256
controller, and shut off the boilers in the summer except when the washeteria is open.
$10,358 + $1,000 Maint. Savings
$276,000 0.94 24.3
TOTAL, all measures $14,748
+ $1,000 Maint. Savings
$285,680 1.12 18.1
4.2
Interactive
Effects
of
Projects
The savings for a particular measure are calculated assuming all recommended EEMs coming before that
measure in the list are implemented. If some EEMs are not implemented, savings for the remaining
EEMs will be affected. For example, if ceiling insulation is not added, then savings from a project to
replace the heating system will be increased, because the heating system for the building supplies a
larger load.
In general, all projects are evaluated sequentially so energy savings associated with one EEM would not
also be attributed to another EEM. By modeling the recommended project sequentially, the analysis
accounts for interactive affects among the EEMs and does not “double count” savings.
Interior lighting, plug loads, facility equipment, and occupants generate heat within the building. When
the building is in cooling mode, these items contribute to the overall cooling demands of the building;
therefore, lighting efficiency improvements will reduce cooling requirements in air‐conditioned
buildings. Conversely, lighting‐efficiency improvements are anticipated to slightly increase heating
requirements. Heating penalties and cooling benefits were included in the lighting project analysis.
4.3
Mechanical
Equipment
Measures
4.3.1
Heating
Domestic
Hot
Water
Measure
4.4
Electrical
&
Appliance
Measures
4.4.1 Lighting Measures
The goal of this section is to present any lighting energy conservation measures that may also be cost
beneficial. It should be noted that replacing current bulbs with more energy‐efficient equivalents will
have a small effect on the building heating and cooling loads. The building cooling load will see a small
decrease from an upgrade to more efficient bulbs and the heating load will see a small increase, as the
more energy efficient bulbs give off less heat.
4.4.1a
Lighting
Measures
–
Replace
Existing
Fixtures/Bulbs
Rank Recommendation
10 Add a Garn 2000 biomass boiler, Tekmar 256 controller, and shut off the boilers in the summer except when the washeteria is open.
Installation Cost $276,000 Estimated Life of Measure (yrs) 25 Energy Savings (/yr) $10,358
Maintenance Savings (/yr) $1,000
Breakeven Cost $259,655 Savings‐to‐Investment Ratio 0.9 Simple Payback yrs 24
Auditor’s Notes: The Huslia area is located within a forest that can produce enough wood to operate a cordwood boiler. The Huslia clinic is
Rank Location Existing Condition Recommendation
3 Tank Hallway 2 FLUOR CFL, Spiral 26 W with Manual Switching Replace lighting with new energy‐efficient LED bulbs
and improve controls.
Installation Cost $40 Estimated Life of Measure (yrs) 20 Energy Savings (/yr) $19
Breakeven Cost $275 Savings‐to‐Investment Ratio 6.9 Simple Payback yrs 2
Auditor’s Notes: Convert tank hallway CFL lamps to LED. Replace with 2 LED 12W module standard electronic lights. LED lights should last
longer, use less energy, and perform better in the cold climate than other alternatives.
Rank Location Existing Condition Recommendation
4 Exterior Lighting 2 HPS 70 Watt Magnetic with Manual Switching Replace lighting with new energy‐efficient LED bulbs
and improve controls.
Installation Cost $700 Estimated Life of Measure (yrs) 20 Energy Savings (/yr) $308
Breakeven Cost $4,497 Savings‐to‐Investment Ratio 6.4 Simple Payback yrs 2
Auditor’s Notes: Replace existing high pressure sodium exterior fixtures with new LED wall packs. Replace with 2 LED 17W module standard
electronic lights. . LED lights should last longer, use less energy, and perform better in the cold climate than other alternatives.
Rank Location Existing Condition Recommendation
5 Washeteria Lighting 6 FLUOR (4) T8 4' F32T8 32W Standard Instant
Standard Electronic with Manual Switching
Replace lighting with new energy‐efficient LED bulbs
and improve controls.
Installation Cost $1,560 Estimated Life of Measure (yrs) 20 Energy Savings (/yr) $354
Breakeven Cost $5,173 Savings‐to‐Investment Ratio 3.3 Simple Payback yrs 4
Auditor’s Notes: Convert fluorescent fixtures in washeteria to LED. Replace with 6 LED (4) 17W module standard electronic lights. These lights
can be replaced with LED replacement bulbs that are direct wired. The old fluorescent fixtures can be maintained, with the ballast and lights
removed. LED’s should last longer between replacements, and use less energy. Additionally, disposal of LED’s does not require hazmat recycling
as they do not contain mercury like their fluorescent counterparts.
Rank Location Existing Condition Recommendation
6 WTP 12 FLUOR (4) T8 4' F32T8 32W Standard Instant
StandardElectronic with Manual Switching
Replace lighting with new energy‐efficient LED bulbs
and improve controls.
Installation Cost $3,120 Estimated Life of Measure (yrs) 20 Energy Savings (/yr) $357
Breakeven Cost $5,211 Savings‐to‐Investment Ratio 1.7 Simple Payback yrs 9
Auditor’s Notes: Convert water treatment plant fluorescent lighting to LED. Replace with 12 LED (4) 17W module standard electronic lights.
These lights can be replaced with LED replacement bulbs that are direct wired. The old fluorescent fixtures can be maintained, with the ballast
and lights removed. LED’s should last longer between replacements, and use less energy. Additionally, disposal of LED’s does not require hazmat
4.4.6
Other
Measures
Rank Location Existing Condition Recommendation
7 Office 2 FLUOR (4) T8 4' F32T8 32W Standard Instant
Standard Electronic with Manual Switching
Replace lighting with new energy‐efficient LED bulbs
and improve controls.
Installation Cost $520 Estimated Life of Measure (yrs) 20 Energy Savings (/yr) $59
Breakeven Cost $867 Savings‐to‐Investment Ratio 1.7 Simple Payback yrs 9
Auditor’s Notes: Convert office fluorescent lighting to LED. Replace with 2 LED (4) 17W module standard electronic lights. These lights can be
replaced with LED replacement bulbs that are direct wired. The old fluorescent fixtures can be maintained, with the ballast and lights removed.
LED’s should last longer between replacements, and use less energy. Additionally, disposal of LED’s does not require hazmat recycling as they do
not contain mercury like their fluorescent counterparts.
Rank Location Existing Condition Recommendation
8 Restroom Lighting 2 FLUOR (3) T8 4' F32T8 32W Standard (2) Instant
Standard Electronic with Manual Switching
Replace lighting with new energy‐efficient LED bulbs
and improve controls.
Installation Cost $390 Estimated Life of Measure (yrs) 20 Energy Savings (/yr) $30
Breakeven Cost $431 Savings‐to‐Investment Ratio 1.1 Simple Payback yrs 13
Auditor’s Notes: Convert restroom fluorescent lighting to LED. Replace with 2 LED (3) 17W module standard electronic lights. These lights can
be replaced with LED replacement bulbs that are direct wired. The old fluorescent fixtures can be maintained, with the ballast and lights removed.
LED’s should last longer between replacements, and use less energy. Additionally, disposal of LED’s does not require hazmat recycling as they do
not contain mercury like their fluorescent counterparts.
Rank Location Existing Condition Recommendation
9 Mechanical Room
Lighitng
3 FLUOR (4) T8 4' F32T8 32W Standard Instant
Standard Electronic with Manual Switching
Replace lighting with new energy‐efficient LED bulbs
and improve controls.
Installation Cost $500 Estimated Life of Measure (yrs) 20 Energy Savings (/yr) $36
Breakeven Cost $520 Savings‐to‐Investment Ratio 1.0 Simple Payback yrs 14
Auditor’s Notes: Convert mechanical room fluorescent lighting to LED. Replace with 3 LED (4) 17W module standard electronic lights. These
lights can be replaced with LED replacement bulbs that are direct wired. The old fluorescent fixtures can be maintained, with the ballast and lights
removed. LED’s should last longer between replacements, and use less energy. Additionally, disposal of LED’s does not require hazmat recycling
as they do not contain mercury like their fluorescent counterparts.
Rank Location Description of Existing Efficiency Recommendation
1 Raw Water Heat Add Load Connect well pump and raw water heat add controls;
shut off heat add when pumping
Installation Cost $2,500 Estimated Life of Measure (yrs) 15 Energy Savings (/yr) $2,855
Breakeven Cost $38,629 Savings‐to‐Investment Ratio 15.5 Simple Payback yrs 1
5.
ENERGY
EFFICIENCY
ACTION
PLAN
Through inspection of the energy‐using equipment on‐site and discussions with site facilities
personnel, this energy audit has identified several energy‐saving measures. The measures will
reduce the amount of fuel burned and electricity used at the site. The projects will not degrade
the performance of the building and, in some cases, will improve it.
Several types of EEMs can be implemented immediately by building staff, and others will
require various amounts of lead time for engineering and equipment acquisition. In some cases,
there are logical advantages to implementing EEMs concurrently. For example, if the same
electrical contractor is used to install both lighting equipment and motors, implementation of
these measures should be scheduled to occur simultaneously.
In the near future, a representative of ANTHC will be contacting both the City of Huslia and the
water treatment plant operator to follow up on the recommendations made in this audit
report. A Rural Alaska Village Grant from USDA Rural Development has funded ANTHC to
provide the City with assistance in understanding the report and in implementing the
recommendations. Funding for implementation of the recommended retrofits is being partially
provided for by the State of Alaska and the Denali Commission.
Rank Location Description of Existing Efficiency Recommendation
2 Generator Heat Load Lower unit heater set point from 60 to 45 degrees
Installation Cost $350 Estimated Life of Measure (yrs) 15 Energy Savings (/yr) $373
Breakeven Cost $5,047 Savings‐to‐Investment Ratio 14.4 Simple Payback yrs 1
APPENDICES
(PleaseAttachDocumentsforAppendixesAthroughD)
Appendix
A
–
Energy
Audit
Report
–
Project
Summary
ENERGY AUDIT REPORT – PROJECT SUMMARY
General
Project
Information
PROJECT INFORMATION AUDITOR INFORMATION
Building: Water Treatment Plant & Washeteria Auditor Company: ANTHC DEHE
Address: PO Box 10 Auditor Name: Carl Remley, Eric Hanssen, Cody Uhlig
City: Huslia Auditor Address: 3900 Ambassador Drive, Suite 301
Anchorage, AK 99508
Client Name: Darrell Vent & Emil Sam Client Address: PO Box 10
Huslia, AK 99746
Auditor Phone: (907) 729‐3543
Auditor FAX:
Client Phone: (907) 829‐2218 Auditor Comment:
Client FAX: Design Data
Building Area: 2,167 square feet Design Space Heating Load: Design Loss at Space: 0 Btu/hour
with Distribution Losses: 0 Btu/hour
Plant Input Rating assuming 82.0% Plant Efficiency and 25% Safety
Margin: 0 Btu/hour
Note: Additional Capacity should be added for DHW and other
plant loads, if served.
Typical Occupancy: 0 people Design Indoor Temperature: 60 deg F (building average)
Actual City: Huslia Design Outdoor Temperature: ‐39.8 deg F
Weather/Fuel City: Huslia Heating Degree Days: 14,942 deg F‐days
Utility Information
Electric Utility: AVEC‐Huslia ‐ Commercial ‐ Sm Natural Gas Provider: None
Average Annual Cost/kWh: $0.509/kWh Average Annual Cost/ccf: $0.000/ccf
Annual Energy Cost Estimate
Description Space Heating Space Cooling Water Heating Ventilation Fans Lighting Other Electrical Raw Water Heat Add Water Circulation Heat Tank Heat Other Service Fees Total Cost Existing Building $529 $0 $3,899 $0 $3,486 $20,809 $9,650 $7,377 $4,201 $1,243 $60 $51,254 With Proposed Retrofits $771 $0 $2,246 $0 $2,281 $20,871 $3,507 $4,019 $2,292 $458 $60 $36,506 Savings ‐$242 $0 $1,653 $0 $1,205 ‐$62 $6,142 $3,358 $1,909 $785 $0 $14,748
Appendix
B
–
Actual
Fuel
Use
versus
Modeled
Fuel
Use
The Orange bars show Actual fuel use, and the Blue bars are AkWarm’s prediction of fuel use.
Annual Fuel Use
Electricity Fuel Use
#1 Fuel Oil Fuel Use
0 200 400 600 800 1000 Electricit
y Natural Gas Propane #1 Oil #2 Oil WoodBirch Spruce Wood Coal District Steam Ht Hot Wtr District Ht Modeled Actual 0 2000 4000 6000 8000
Jan Feb Mar Apr May Jun Jul Aug Sep Oct Nov Dec
Modeled Actual 0 200 400 600 800 1000
Jan Feb Mar Apr May Jun Jul Aug Sep Oct Nov Dec
Modeled Actual