Title VI Analysis of
FY 2015 & FY 2016 Proposed Fare
Changes
I.
Background
Title VI of the Civil Rights Act of 1964 prohibits discrimination on the basis of race, color or national origin in programs and activities receiving Federal financial assistance. Specifically, Title VI provides that "no person in the United States shall, on the grounds of race, color, or national origin, be excluded from participation in, be denied the
benefits of, or be subjected to discrimination under any program or activity receiving Federal financial assistance." (42 U.S.C. Section 2000d)
The analysis below responds to the reporting requirements contained in the Federal Transit Administration’s (FTA) Circular 4702.1B, "Title VI and Title VI-Dependent
Guidelines," which provides guidance to transit agencies serving large urbanized areas and requires that these agencies "shall evaluate significant system-wide service and fare changes and proposed improvements at the planning and programming stages to determine whether these changes have a discriminatory impact.” (Circular 4702.1B, Chapter IV-10.) The FTA requires that transit providers evaluate the effects of service and fare changes on low-income populations in addition to Title VI-protected
populations.
The San Francisco Municipal Transportation Agency (SFMTA), a department of the City and County of San Francisco, was established by voter proposition in 1999. One of the SFMTA’s primary responsibilities is running the San Francisco Municipal Railway, known universally as “Muni.” Muni is the largest transit system in the Bay Area and the seventh largest in the nation, with approximately 700,000 passenger boardings per day and serving approximately 215 million customers a year. The Muni fleet includes: historic streetcars, biodiesel and electric hybrid buses and electric trolley coaches, light rail vehicles, paratransit cabs and vans and the world-famous cable cars. Muni
provides one of the highest levels of service per capita with 63 bus routes, seven light rail lines, the historic streetcar F Line and three cable car lines and provides seamless connections to other Bay Area public transit systems such as BART, AC Transit, Golden Gate Transit and Ferries, SamTrans, and Caltrain.
In 2009, the SFMTA Board adopted an Automatic Indexing Plan, a formula based on a combination of Bay Area Consumer Price Index for all urban consumers (CPI-U) and SFMTA labor costs. Prior to that time, the SFMTA instituted fare increases less
frequently but at higher rates. The application of the Automatic Indexing Plan results in smaller, more predictable fare increases rather than larger, more infrequent fare
increases.
The proposed FY2015-2016 budget includes two sets of fare changes: the application of the above-referenced fare indexing plan, as well as a second set of fare proposals that serves to either increase prices for specific fare products beyond the indexing formula, or to introduce fare increases or decreases outside of the indexing plan.
This Title VI analysis includes:
• SFMTA’s Board-approved disparate impact and disproportionate burden policies, as well as a summary of the public outreach and engagement process employed in the development of these policies;
• A description of the proposed fare changes and background on why the changes are being proposed;
• A data analysis based on customer survey data to determine the percent of users of each fare media proposed for increase or decrease, including a profile of fare usage by protected group – minority and low-income – and a comparison to their representation system-wide;
• An analysis of potential impacts on minority and/or low-income customers;
• Any required analysis of alternative transit modes, fare payment types or fare media availability for customers who may be impacted by the proposed fare changes;
• A summary of public outreach and engagement efforts.
II.
SFMTA’s Title VI-Related Policies and Definitions
On October 1, 2012, FTA issued updated Circular 4702.1B, which requires a transit agency’s governing board to adopt the following policies related to fare and service changes:
• Major Service Change Definition – establishes a definition for a major service change, which provides the basis for determining when a service equity analysis needs to be conducted.
• Disparate Impact and Disproportionate Burden Policies – establish thresholds to determine when proposed major service changes or fare changes would adversely affect minority and/or low-income populations and when alternatives need to be considered or impacts mitigated.
In response to Circular 4702.1B, the SFMTA developed the following recommended Disparate Impact and Disproportionate Burden Policies, which were approved, after an extensive multilingual public outreach process, by the SFMTA Board of Directors on August 20, 2013:
• Disparate Impact Policy determines the point (“threshold”) when adverse effects of fare or service changes are borne disparately by minority populations. Under this policy, a fare change, or package of changes, or major service change, or package of changes, will be deemed to have a disparate impact on minority populations if the difference between the percentage of the minority population impacted by the
changes and the percentage of the minority population system-wide is eight percentage points or more. Packages of major service changes across multiple routes will be evaluated cumulatively and packages of fare increases across multiple fare instruments will be evaluated cumulatively.
service changes are borne disproportionately by low-income populations. Under this policy, a fare change, or package of changes, or major service change, or package of changes, will be deemed to have a disproportionate burden on low-income populations if the difference between the percentage of the low-income population impacted by the changes and the percentage of the low-income population system-wide is eight percentage points or more. Packages of major service changes across multiple routes will be evaluated cumulatively and packages of fare increases across multiple fare instruments will be evaluated cumulatively.
The SFMTA Board of Directors approved the Title VI policies (see Resolution No. 13-192).
Stakeholder Outreach and Engagement
As part of the SFMTA’s process to develop the proposed Title VI policies, the SFMTA conducted a multilingual stakeholder outreach campaign to receive input on the
proposed policies and engage the public in the decision making process for adoption of these policies by the SFMTA Board. This effort included presentations to the SFMTA Citizens Advisory Council (CAC) and Muni Accessible Advisory Committee (MAAC), as well as two public workshops. The workshops were promoted through email, telephone calls to community groups, and in nine languages on the SFMTA website. Outreach was also targeted to approximately 30 Community Based Organizations and
transportation advocates with broad representation among low-income and minority communities. Staff also offered to meet with some community groups if they were unable to attend the public workshops. In addition, staff presented the Title VI recommendations at the SFMTA Board of Directors meeting on July 16, 2013. The policies were approved at the Board of Directors meeting on August 20, 2013. Definition of Minority
For the purpose of the Title VI analysis, “minority” is defined as a person who self-identifies as any race/ethnicity other than white. Minority includes those self-identifying as multi-racial including white.
Definition of Low Income
The SFMTA defines low-income as a person self-reporting their household income at 200% below the 2013 Federal Poverty Levels (FPL). The table below shows the 2013 household income levels meeting the 200% FPL threshold. This definition of low-income matches the SFMTA’s criteria for Lifeline Muni passes for low-low-income households in San Francisco.
Household Size Household Income 200% of the 2013 Federal Poverty Levels
1 $22,980
2 $31,020
3 $39,060
Household Size Household Income 200% of the 2013 Federal Poverty Levels
5 $55,140
6 $63,180
7 $71,220
8 $79,260
For each additional
person, add: $8,040
III.
Assessing Impacts of the Proposed Fare Changes on Minority
and/or Low-Income Communities
As detailed in FTA Circular 4702.1B, transit providers shall evaluate the impacts of their proposed fare changes (either increases or decreases) on minority and low-income populations separately, and within the context of their Disparate Impact and Disproportionate Burden policies, to determine whether minority and/or low-income riders are bearing a disproportionate impact of the change between the existing cost and the proposed cost. The impact may be defined as a statistical percentage. The disparate impact and disproportionate burden thresholds must be applied uniformly, regardless of fare media.
Minority Disparate Impact: If the SFMTA finds potential disparate impacts and then modifies the proposed changes in order to avoid, minimize or mitigate those impacts, it is required to reanalyze the proposed changes in order to determine whether the modifications actually removed the potential disparate impacts of the changes. If SFMTA chooses not to alter the proposed fare changes despite the disparate impact on minority ridership, or if it finds, even after the revisions, that minority riders will continue to bear a disproportionate share of the proposed fare change, the fare change may only be implemented if:
(i) There is a substantial legitimate justification for the proposed fare change, and
(ii) SFMTA can show that there are no alternatives that would have a less disparate impact on minority riders but would still accomplish the transit provider’s legitimate program goals.
In order to make this showing, any alternatives must be considered and analyzed to determine whether those alternatives would have less of a disparate impact on the basis of race, color, or national origin, and then only the least discriminatory alternative can be implemented.
Low-Income Disproportionate Burden: If at the conclusion of the analysis, the SFMTA finds that low-income populations will bear a disproportionate burden of the proposed fare change, steps must be taken to avoid, minimize or mitigate impacts where practicable and descriptions of alternatives available to low-income populations affected by the fare changes must be provided.
IV.
Data Analysis and Methodology
In order to make an appropriate assessment of disparate impact or disproportionate burden in regard to fare changes, the transit provider must compare available customer survey data and show the number and percent of minority riders and low-income riders using a particular fare media, in order to establish whether minority and/or low-income riders are disproportionately more likely to use the mode of service, payment type or payment media that would be subject to the fare change. (Circular 4702.1B, Chapter IV-19). Unlike previous Title VI analyses, the SFMTA has data on ridership demographics by transit line based on a comprehensive On-Board Customer Survey conducted in Spring 2013. The survey asked demographics questions for race/ethnicity, household income, household size, gender, age, vehicle ownership, and other information
including fare type used on the trip and origin/destination information. Consultants collected over 22,000 survey responses, providing a statistically significant snapshot of ridership patterns. This provides the basis for determining the potential impacts of fare changes on our customers. A copy of the survey is available upon request.
As noted above, in August 2013, the SFMTA Board approved a methodology for
analyzing Title VI impacts. In the case of fare changes, both increases and decreases of any amount, this methodology relies on comparing the percentage of protected
customers using a particular fare product or instrument to their representation system-wide. When protected customers’ usage of said fare product or instrument exceeds their system-wide average by eight percent or more, and the cost of that product or
instrument is being increased, then a finding of disparate impact (minority-based impact) and/or disproportionate burden (low-income based impact) is indicated. Conversely, Title VI also requires that fare decreases be evaluated to determine whether they disproportionately benefit populations that are not protected by Title VI, thereby diverting the allocation of transit resources away from Title VI-protected groups. As a result, when Title VI-protected customers’ usage of a fare product or instrument falls below their system-wide average by eight percent or more, and the cost of that product or instrument is being reduced, then a finding of disparate impact (minority-based impact) and/or disproportionate burden (low income-(minority-based impact) is indicated. Respondents who declined to answer questions about income or ethnicity are excluded from the analysis. The overall system-wide averages were determined from National Transit Database and Automatic Passenger Counter (APC) data weighted by the weekly ridership share by line. The system-wide average for minority customers was determined to be 58%, and the system-wide average for low-income customers was determined to be 51%.
In order to protect privacy, survey respondents were asked to report their income bracket as opposed to their specific income. As a result, the analysis made
assumptions about whether the combination of a particular respondent’s household size and income bracket fell into a “low-income” category based on the Agency’s definition of low-income described above. Generally, the analysis erred on the side of caution and placed possibly low-income respondents into the low-income category.
V.
Description of Proposed Fare Changes and Analysis of Impacts
As noted in Section I, the SFMTA’s FY2015-2016 budget includes proposals to change fares per the Automatic Fare Indexing Policy as well as a second group of additional proposals that increases prices for specific fare products beyond the indexing formula, or introduces fare increases or decreases outside of the indexing plan. Tables 1 through 4 provide an analysis of the effects of the fare changes included in both sets of fare proposals on minority and low-income customers. Tables 1 and 2 examine all fare increases together, and Tables 3 and 4 examine all fare decreases together. Both tables include current and proposed fares by planned year of implementation, as well as the demographic characteristics of the customers who use each fare type. Finally, they compare the cumulative usage of these fare types by minority and low-income
customers to their representation system-wide. A disparate impact and/or
disproportionate burden finding is indicated if the total usage by minority and/or low-income customers deviates from their system-wide averages by eight percent or more. Based on applying this analysis, the proposed fare changes do not result in either a disparate impact or disproportionate burden.
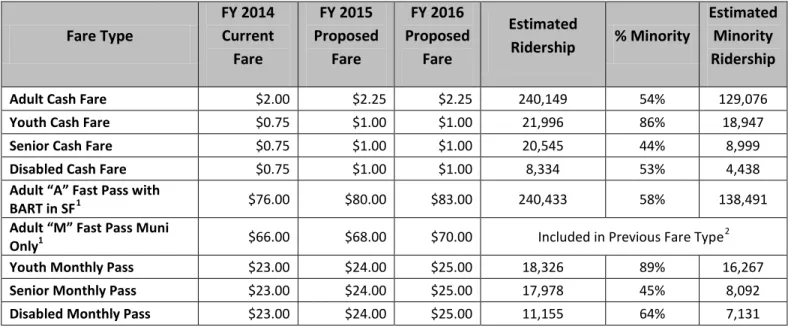
Table 1: All Fare Increases - Assessment of Disparate Impact
Fare Type
FY 2014 Current Fare
FY 2015 Proposed
Fare
FY 2016 Proposed
Fare
Estimated
Ridership % Minority
Estimated Minority Ridership
Adult Cash Fare $2.00 $2.25 $2.25 240,149 54% 129,076
Youth Cash Fare $0.75 $1.00 $1.00 21,996 86% 18,947
Senior Cash Fare $0.75 $1.00 $1.00 20,545 44% 8,999
Disabled Cash Fare $0.75 $1.00 $1.00 8,334 53% 4,438
Adult “A” Fast Pass with
BART in SF1 $76.00 $80.00 $83.00 240,433 58% 138,491
Adult “M” Fast Pass Muni
Only1 $66.00 $68.00 $70.00 Included in Previous Fare Type2
Youth Monthly Pass $23.00 $24.00 $25.00 18,326 89% 16,267
Senior Monthly Pass $23.00 $24.00 $25.00 17,978 45% 8,092
Disabled Monthly Pass $23.00 $24.00 $25.00 11,155 64% 7,131
1 Survey responses did not distinguish between “A” and “M” Muni monthly passes. All riders indicating payment with an adult monthly pass are included in these figures.
2 These fare changes impact the same group of customers as the fare change listed immediately above them. They are listed separately for the purpose of clarifying the fare options; however, ridership and demographics are tabulated only once to avoid double-counting.
Fare Type FY 2014 Current Fare FY 2015 Proposed Fare FY 2016 Proposed Fare Estimated
Ridership % Minority
Estimated Minority Ridership
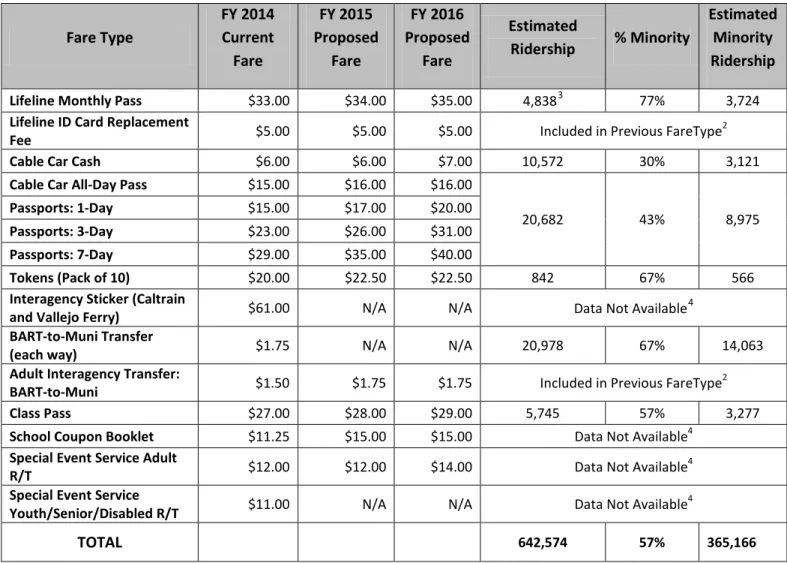
Lifeline Monthly Pass $33.00 $34.00 $35.00 4,8383 77% 3,724
Lifeline ID Card Replacement
Fee $5.00 $5.00 $5.00 Included in Previous FareType2
Cable Car Cash $6.00 $6.00 $7.00 10,572 30% 3,121
Cable Car All-Day Pass $15.00 $16.00 $16.00
20,682 43% 8,975
Passports: 1-Day $15.00 $17.00 $20.00
Passports: 3-Day $23.00 $26.00 $31.00
Passports: 7-Day $29.00 $35.00 $40.00
Tokens (Pack of 10) $20.00 $22.50 $22.50 842 67% 566
Interagency Sticker (Caltrain
and Vallejo Ferry) $61.00 N/A N/A Data Not Available4
BART-to-Muni Transfer
(each way) $1.75 N/A N/A 20,978 67% 14,063
Adult Interagency Transfer:
BART-to-Muni $1.50 $1.75 $1.75 Included in Previous FareType2
Class Pass $27.00 $28.00 $29.00 5,745 57% 3,277
School Coupon Booklet $11.25 $15.00 $15.00 Data Not Available4 Special Event Service Adult
R/T $12.00 $12.00 $14.00 Data Not Available4
Special Event Service
Youth/Senior/Disabled R/T $11.00 N/A N/A Data Not Available4
TOTAL 642,574 57% 365,166
Table 2: All Fare Increases – Assessment of Disproportionate Burden
Fare Type FY 2014 Current Fare FY 2015 Proposed Fare FY 2016 Proposed Fare Estimated Ridership % Low-Income Estimated Low-Income Ridership
Adult Cash Fare $2.00 $2.25 $2.25 240,149 50% 119,555
Youth Cash Fare $0.75 $1.00 $1.00 21,996 75% 16,482
Senior Cash Fare $0.75 $1.00 $1.00 20,545 52% 10,683
Disabled Cash Fare $0.75 $1.00 $1.00 8,334 80% 6,705
Adult “A” Fast Pass with
BART in SF1 $76.00 $80.00 $83.00 240,433 44% 104,507
3 “Lifeline Pass” was not included as a standard response in the customer survey. The ridership number shown here is low relative to the amount of passes purchased monthly; however, it is possible that survey respondents indicated use of an adult monthly pass instead of specifying use of a Lifeline pass.
4 For these fare types, there was either an extremely limited number of or no survey responses received upon which to base an assessment.
Fare Type FY 2014 Current Fare FY 2015 Proposed Fare FY 2016 Proposed Fare Estimated Ridership % Low-Income Estimated Low-Income Ridership
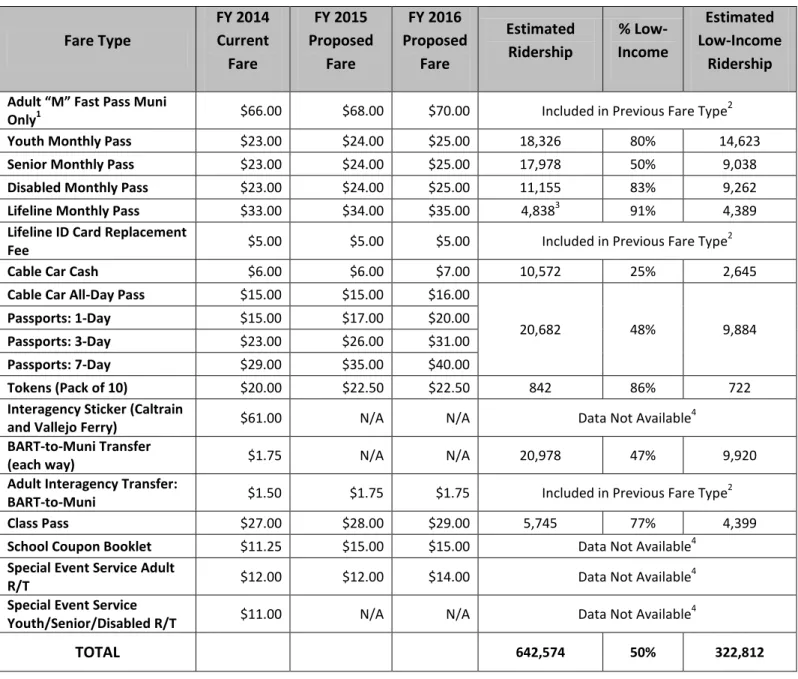
Adult “M” Fast Pass Muni
Only1 $66.00 $68.00 $70.00 Included in Previous Fare Type2
Youth Monthly Pass $23.00 $24.00 $25.00 18,326 80% 14,623
Senior Monthly Pass $23.00 $24.00 $25.00 17,978 50% 9,038
Disabled Monthly Pass $23.00 $24.00 $25.00 11,155 83% 9,262
Lifeline Monthly Pass $33.00 $34.00 $35.00 4,8383 91% 4,389
Lifeline ID Card Replacement
Fee $5.00 $5.00 $5.00 Included in Previous Fare Type2
Cable Car Cash $6.00 $6.00 $7.00 10,572 25% 2,645
Cable Car All-Day Pass $15.00 $15.00 $16.00
20,682 48% 9,884
Passports: 1-Day $15.00 $17.00 $20.00
Passports: 3-Day $23.00 $26.00 $31.00
Passports: 7-Day $29.00 $35.00 $40.00
Tokens (Pack of 10) $20.00 $22.50 $22.50 842 86% 722
Interagency Sticker (Caltrain
and Vallejo Ferry) $61.00 N/A N/A Data Not Available4
BART-to-Muni Transfer
(each way) $1.75 N/A N/A 20,978 47% 9,920
Adult Interagency Transfer:
BART-to-Muni $1.50 $1.75 $1.75 Included in Previous Fare Type2
Class Pass $27.00 $28.00 $29.00 5,745 77% 4,399
School Coupon Booklet $11.25 $15.00 $15.00 Data Not Available4
Special Event Service Adult
R/T $12.00 $12.00 $14.00 Data Not Available4
Special Event Service
Youth/Senior/Disabled R/T $11.00 N/A N/A Data Not Available4
TOTAL 642,574 50% 322,812
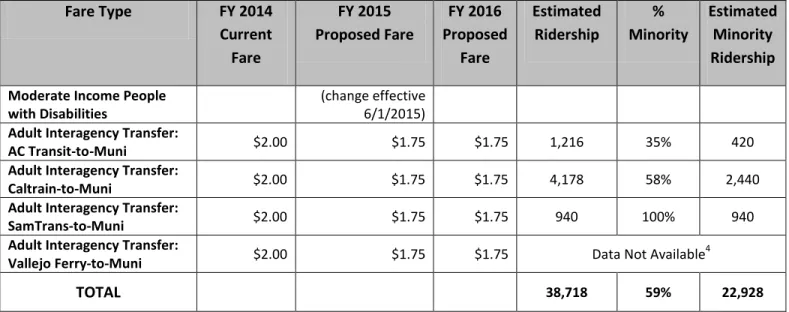
Table 3: All Fare Decreases - Assessment of Disparate Impact
Fare Type FY 2014
Current Fare FY 2015 Proposed Fare FY 2016 Proposed Fare Estimated Ridership % Minority Estimated Minority Ridership
Free Muni for Low and Moderate Income Youth –
Inclusion of 18-Year-Olds $2.00/$66.00
$2.25/$68.00/$0.00 (change effective
6/1/2015) $0.00 Data Not Available 4
Free Muni for Low and
Moderate Income Seniors $0.75/$23.00
$1.00/$24.00/$0.00 (change effective
6/1/2015) $0.00 17,351 61% 10,515 Free Muni for Low and $0.75/$23.00 $1.00/$24.00/$0.00 $0.00 15,032 57% 8,613
Fare Type FY 2014 Current Fare FY 2015 Proposed Fare FY 2016 Proposed Fare Estimated Ridership % Minority Estimated Minority Ridership
Moderate Income People
with Disabilities (change effective 6/1/2015) Adult Interagency Transfer:
AC Transit-to-Muni $2.00 $1.75 $1.75 1,216 35% 420
Adult Interagency Transfer:
Caltrain-to-Muni $2.00 $1.75 $1.75 4,178 58% 2,440
Adult Interagency Transfer:
SamTrans-to-Muni $2.00 $1.75 $1.75 940 100% 940
Adult Interagency Transfer:
Vallejo Ferry-to-Muni $2.00 $1.75 $1.75 Data Not Available4
TOTAL 38,718 59% 22,928
Table 4: All Fare Decreases – Assessment of Disproportionate Burden
Fare Type FY 2014
Current Fare FY 2015 Proposed Fare FY 2016 Proposed Fare Estimated Ridership % Low-Income Estimated Low-Income Ridership
Free Muni for Low and Moderate Income Youth –
Inclusion of 18-Year-Olds $2.00/$66.00
$2.25/$68.00/$0.00 (change effective
6/1/2015) $0.00 Data Not Available 4
Free Muni for Low and
Moderate Income Seniors $0.75/$23.00
$1.00/$24.00/$0.00 (change effective
6/1/2015) $0.00 17,351 100% 17,351 Free Muni for Low and
Moderate Income People
with Disabilities $0.75/$23.00
$1.00/$24.00/$0.00 (change effective
6/1/2015) $0.00 15,032 100% 15,032 Adult Interagency Transfer:
AC Transit-to-Muni $2.00 $1.75 $1.75 1,216 36% 435
Adult Interagency Transfer:
Caltrain-to-Muni $2.00 $1.75 $1.75 4,178 36% 1,487
Adult Interagency Transfer:
SamTrans-to-Muni $2.00 $1.75 $1.75 940 77% 726
Adult Interagency Transfer:
Vallejo Ferry-to-Muni $2.00 $1.75 $1.75 Data Not Available4
TOTAL 38,718 91% 35,032
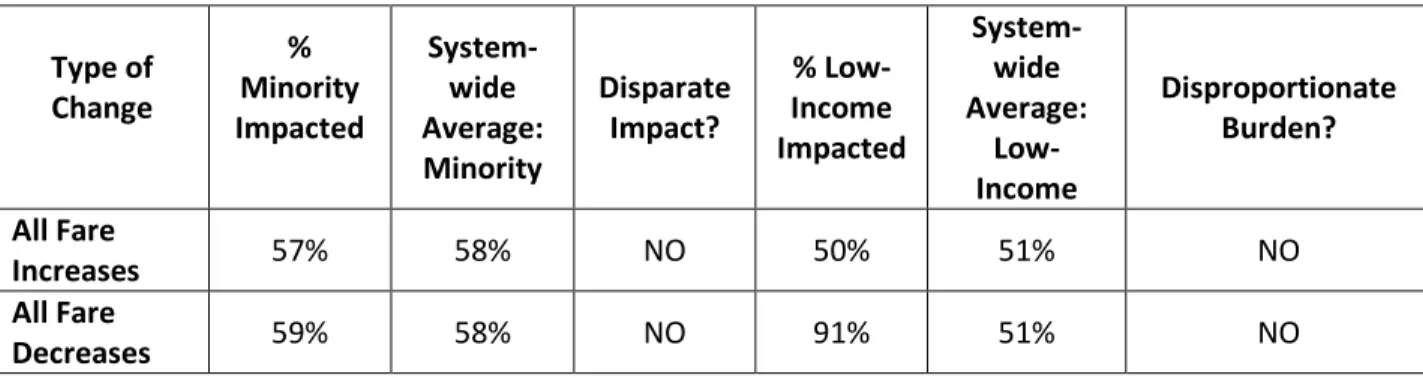
As Table 5 indicates, none of the proposed fare changes results in disparate impacts or disproportionate burdens on minority and low-income Muni customers:
Table 5: Summary of Disparate Impact and Disproportionate Burden Analysis, All Fare Changes
Type of Change
% Minority Impacted
System-wide Average: Minority
Disparate Impact?
% Low-Income Impacted
System-wide Average:
Low-Income
Disproportionate Burden? All Fare
Increases 57% 58% NO 50% 51% NO
All Fare
Decreases 59% 58% NO 91% 51% NO
For the package of fare increases, the percent of impacted minority riders is only slightly below the system-wide average of minority riders, and the percent of impacted low-income riders is also just below the system-wide average of low-low-income riders, so no disparate impact or disproportionate burden is shown. In other words, the fare increases do not impact minority and low-income customers disproportionately by eight percent or more relative to their representation system-wide.
For the package of fare decreases, the percent of impacted minority riders is slightly above the system-wide average of minority riders. Since fare decreases carry a positive effect, the assessment of impact or burden focuses on whether the fare decreases will benefit populations not protected by Title VI disproportionately to their representation system-wide. Therefore, an impact or burden is indicated only if the percentages of low-income and minority riders is more than eight percent lower than their system-wide averages. In this case, the fare decreases do not result in a disparate impact since they benefit minority riders slightly more than their system-wide average. Similarly, the fare decreases do not result in a disproportionate burden for low-income riders since they benefit these riders at a significantly greater percentage when compared to their system-wide average.
Automatic Fare Indexing Policy
As noted above, in 2009 the SFMTA Board adopted an Automatic Indexing Plan, a formula based on the combination of Bay Area Consumer Price Index for all urban consumers (CPI-U) and SFMTA labor costs that serves as a policy for incremental fare increases. Automatic Indexing is critical to ensure that service levels are not compromised given the increase in operating costs annually due to inflation. Operating costs include labor costs, fuel, material and parts for vehicle maintenance costs and all other costs needed to support service availability. Application of the Automatic Indexing Plan also ensures that riders can expect and anticipate small incremental fare increases over time rather than unknown larger increases sporadically.
Furthermore, as demonstrated by the tables in Appendix A, Muni’s fares are consistent with fares for other transit systems in major metropolitan areas around the nation. In addition, over the past decade, the SFMTA has developed and/or proposed a number of programs geared specifically towards qualified low-income customers in every fare category: the Lifeline Pass (adults) and Free Muni for Low and Moderate Income Youth have both been implemented, and Free Muni for Low and Moderate Income Seniors and People with Disabilities is being proposed as part of this budget package contingent upon Board of Director’s review of the Agency’s fiscal health in January 2015. These programs will be described in more detail below.
Adult Fares Lifeline Pass
The SFMTA offers its Lifeline Pass at a 50% discount relative to the adult Muni-Only monthly pass. The Lifeline Pass, which was created by the SFMTA in 2005 in conjunction with the Human Services Agency in order to minimize the impact of fare increases being implemented at that time, will continue to be offered at a 50% discount off the regular pass price. Eligibility for the Lifeline Fast Pass is based on three criteria: (1) enrollment in the Working Families Tax Credit, the local version of the Earned Income Tax Credit; (2) enrollment in another income support program administered by the Human Services Agency (e.g., food stamps, County Adult Assistance Program, or CalWORKS); or (3) income at or below 200 percent of the 2013 Federal Poverty Levels, which is a pre-tax income of approximately $47,100 for a family of four people. Based on recent survey data, SFMTA estimates that about one-third of SFMTA customers are eligible for the Lifeline Pass.
A new feature of the Lifeline pass program is the implementation of a “Lifeline ID” card to streamline monthly access for the pass. In lieu of receiving a magnetic stripe pass each month, Lifeline program participants will now be able to purchase a monthly sticker to affix to their personalized ID card. This will significantly reduce the processing time associated with distribution of the monthly pass, and will also allow for the expansion of locations where the pass can be sold. In conjunction with this ID card, a $5 card replacement fee is being implemented. This fee serves to offset the administrative cost of processing replacement cards.
Youth, Senior and Disabled Fares
The SFMTA’s FY2015-2016 budget proposes increasing youth, senior, and disabled single-ride and monthly pass fares per the Automatic Fare Indexing Policy. For youth, the Free Muni for Low and Moderate Income Youth pilot program provides eligible youth with free access to Muni services, and offers the clearest way to mitigate the impacts of this fare increase for low-income customers. This pilot program was initiated in 2013 and is proposed to be extended in the SFMTA’s FY2015-2016 budget.
In addition to the continuation of the Free Muni for Low and Moderate Income Youth pilot program, this budget proposes implementing three discounts that are contingent upon Board of Director’s review of the Agency’s fiscal health in January 2015:
1. Expanding the age eligibility for the Free Muni for Low and Moderate Income Youth program. The current youth definition is from 5 to 17 years of age. This budget package proposes increasing eligibility from 17 years to 18 years. While there is no demographic data available that is specific to 18-year-olds, it is anticipated that this would help minimize the impact of any proposed increase in fares, as it would provide low and moderate income 18-year-olds with an additional year of eligibility for a free fare, rather than having to pay the adult fare at age 18.
2. Introduction of Free Muni for Low and Moderate Income Seniors. This would extend the benefit of the Free Muni for Low and Moderate Income Youth pilot program to eligible seniors and provide them with free access to Muni services. 3. Introduction of Free Muni for Low and Moderate Income People with Disabilities.
This would extend the benefit of the Free Muni for Low and Moderate Income Youth pilot program to eligible people with disabilities and provide them with free access to Muni services.
If approved, the target implementation date for all of these proposals is June 1, 2015.
VII. Public Comment and Outreach
Given the diversity of the SFMTA’s service area and ridership and pursuant to Title VI of the Civil Rights Act of 1964 and its implementing regulations, the SFMTA takes responsible steps to ensure meaningful access to the benefits, services, information, and other important portions of SFMTA’s programs and activities for low-income,
minority, and Limited-English Proficient individuals and regardless of race, color or national origin.
In order to inform our riders and gather public comment regarding the proposed fare changes, the SFMTA undertook a multilingual public information campaign that included multilingual “Take One” information cards on Muni vehicles, Metro booth agent posters, Metro service sign holder on platforms, and bus stop posters. Multilingual information was posted on SFMTA’s website in Spanish, Chinese, Tagalog, Russian, Vietnamese, Korean, French, Thai and Japanese, including meeting notices. Budget Town Hall meetings were held on Thursday, February 27, 2014 at 6:30pm at 1 South Van Ness and on Saturday, March 8, 2014 at 11am at the Main Public Library. Budget
hearings before the SFMTA Board of Directors were scheduled as follows:
3/14/14, 8 a.m. (Special session) City Hall, Room 400
4/1/14, 1 p.m. City Hall, Room 400 4/15/14, 1 p.m. City Hall, Room 400
Pursuant to Charter Section 16.112 and state law, advertisements were placed in the City’s official newspaper regarding the Board of Directors hearing on April 1, 2014, to consider the proposed changes. The advertisement ran in the San Francisco Chronicle beginning on March 21, 2014. In the interest of providing more notice, the
advertisement ran for five days. In addition to the required legal notice, advertisements were placed in the Sing Tao and El Mensajero papers to reach our limited-English proficient customers.
In addition, information was distributed through press releases and through SFMTA/Muni’s Twitter account and Facebook posts.
Note that based on the public feedback received as a result this multi-lingual outreach process, the SFMTA Board chose not to proceed with the following fare changes:
Introducing a single-ride fare differential between Clipper payments and cash payments;
Increasing the F-Line Fare; and
Implementing premium fares for express and limited service.
VIII. Conclusion
In summary, the SFMTA is proposing a package of both fare increases and decreases as part of its FY2015-2016 budget. The Agency performed a demographic analysis of the ridership impacted by these proposed changes, based on recent customer survey data and Title VI-related policies and methodology adopted by the SFMTA Board in August 2013. The analysis indicates that there are neither disparate impacts nor disproportionate burdens associated with any of the proposed fare changes.
Appendix A: Comparison of Pass Prices to Peer Agencies
Base
Fare Pass Prices Number of Rides to Break Even
City Adult 1-Day 3-Day 7-Day 1-Day 3-Day 7-Day
Atlanta, GA $2.50 $9.00 $16.00 $23.75 3.6 6.4 9.5
Baltimore, MD $1.60 $3.50 NA $16.50 2.2 NA 10.3
Boston, MA* $2.00 $11.00 NA $18.00 5.5 NA 9.0
Chicago, IL* $2.00 $10.00 $20.00 $28.00 5.0 10.0 14.0
Denver, CO $2.25 $6.75 NA NA 3.0 NA NA
Houston, TX $1.25 $3.00 NA NA 2.4 NA NA
Los Angeles, CA $1.50 $5.00 NA $20.00 3.3 NA 13.3
Miami, FL $2.25 $5.65 NA $29.25 2.5 NA 13.0
Minneapolis, MN* $2.25 NA NA $22.00 NA NA 9.8
New York, NY $2.25 NA NA $30.00 NA NA 13.3
Oakland, CA $2.10 $5.00 NA NA 2.4 NA NA
Philadelphia, PA $2.25 $12.00 NA $24.00 5.3 NA 10.7
Portland, OR $2.50 $7.00 NA $26.00 2.8 NA 10.4
San Carlos, CA $2.50 $5.00 NA NA 2.0 NA NA
San Diego, CA $2.25 $5.00 $12.00 NA 2.2 5.3 NA
San Francisco, CA (regular service) (FY15
proposed)* $2.25 $17.00 $26.00 $35.00 7.6 11.6 15.6
San Francisco, CA (cable cars) (FY15 proposed)* $6.00 $17.00 $26.00 $35.00 2.8 4.3 5.8 San Francisco, CA (regular service) (FY16
proposed)* $2.25 $20.00 $31.00 $40.00 8.9 13.8 17.8
San Francisco, CA (cable cars) (FY16 proposed)* $7.00 $20.00 $31.00 $40.00 2.9 4.4 5.7
San Jose, CA $2.00 $6.00 NA NA 3.0 NA NA
San Rafael, CA $2.00 $5.00 NA $20.00 2.5 NA 10.0
Seattle, WA $2.50 NA NA NA NA NA NA
Washington, DC* $1.95 $14.00 NA $35.00 7.2 NA 17.9
* Notes
Boston, MA - rail fare with Charlie Card Chicago, IL - with Ventra Card or Transit Card Minneapolis, MN - peak prices
San Francisco, CA - Passport prices tied to cable car fares. Seattle, WA - peak prices
Monthly Pass Discount compared to Adult Fare
City Adult Senior Disabled Youth Senior Disabled Youth
Atlanta, GA $95.00 NA NA NA NA NA NA
Baltimore, MD $64.00 $16.50 $16.50 NA 74% 74% NA
Boston, MA $70.00 $28.00 $28.00 $28.00 60% 60% 60%
Chicago, IL $100.00 $50.00 $50.00 NA 50% 50% NA
Denver, CO $72.00 $39.50 $39.50 $39.50 45% 45% 45%
Houston, TX NA NA NA NA NA NA NA
Los Angeles, CA $75.00 $14.00 $14.00 $24.00 81% 81% 68% Miami, FL $112.50 $56.25 $56.25 $56.25 50% 50% 50%
Minneapolis, MN $85.00 NA NA NA NA NA NA
New York, NY $112.00 $56.00 $56.00 NA 50% 50% NA
Oakland, CA $75.00 $23.00 $23.00 $23.00 69% 69% 69%
Philadelphia, PA $91.00 $0.00 NA NA 100% NA NA
Portland, OR $100.00 $26.00 $26.00 $30.00 74% 74% 70% San Carlos, CA $64.00 $25.00 $25.00 $36.00 61% 61% 44% San Diego, CA $72.00 $18.00 $18.00 $36.00 75% 75% 50% San Francisco, CA
(FY15 proposed) $68.00 $24.00 $24.00 $24.00 65% 65% 65%
San Francisco, CA
(FY16 proposed) $70.00 $25.00 $25.00 $25.00 65% 65% 65%
San Jose, CA $70.00 $25.00 $25.00 $40.00 64% 64% 43% San Rafael, CA $80.00 $40.00 $40.00 $40.00 50% 50% 50% Seattle, WA $90.00 $27.00 $27.00 $45.00 70% 70% 50% Washington, DC* $72.00 $36.00 $36.00 $30.00 50% 50% 58%
* Notes
Washington, DC (buses only) - 4.5 weekly bus passes used to calculate the price of a monthly pass for adults, seniors and disabled