SYNTHESIS AND SPECTRAL STUDIES OF METAL
COMPLEXES WITH
3,4,6,7-O,O,O,O-TETRAKIS-(CARBOXY(CHLORO)METHYL)-L-ASCORBIC ACID (H
4L)
Salah Mohammed Fizea
[a]*, Falih Hassan Musa
[a], Huda Ahmed Fidhel
[a]Keywords: synthesis, 3,4,6,7-O,O,O,O-tetrakis(carboxy(chloro)methyl)-L-ascorbic acid, metal complexes; analysis.
The reaction of L-ascorbic acid with the dichloroacetic acid in the presence of potassium hydroxide gave new product 3,4,6,7-O,O,O,O-tetrakis(carboxy(chloro)methyl)-L-ascorbic acid (H4L), which was isolated and characterized by 1H,13C-NMR, elemental analysis (CHN),
thermogravimetric analysis (TGA), UV-visible and Fourier Transform infrared (FTIR) methods. The complexes of the ligand (H4L) with
metal ions, M+2= (Cu, Co, Ni, Cd and Hg) were synthesized and characterized by FTIR, UV-Visible, molar conductance, atomic
absorption, magnetic susceptibility, thermogravimetric analysis (TGA) and molar ratio methods. The analysis showed the evidence of binding of the metal ions with (H4L) through the bidendate carboxylato group manner resulting in six-coordinated metal ion. The TLC for
(H4L) and complexes showed one spot for each indicating the purity of these compounds.
* Corresponding Authors
E-Mail: [email protected]
[a] Department of Chemistry, College of Education for Pure Science, Ibn Al-Haitham, University of Baghdad
Introduction
L-Ascorbic acid (vitamin C) is an important molecule in both chemistry and biology, and its complexes with metals are of particular interest in both of these areas.1-3 This
vitamin is present in various foods, particularly of plant origin, that are several orders of magnitude higher than those of other vitamins.4 Structurally, ascorbic acid (H
2A) is
a sugar acid, a -lactone and an ene-diol. As a weak dibasic acid (pKa1 = 4.25 and pKa2 = 11.79), the monoanion (HA)
forms at pH 4–5 with deprotonation of O(3)–H and the dianion (A) forms at pH 11–12 with deprotonation of the O(2)–H.5 The mono-anionic form is more stable due to the
delocalization of the negative charge between the oxygen atoms at the 1- and 3-positions.6 Musa et al.7-9 synthesized
derivatives of L-ascorbic acid such as 5,6-O-isopropylidene-2,3-(2-X,1-carboxyl)deoxy-L-ascorbic acid, where X = H, Cl, 1,2-dihydroxyethyl-1-(2-mercaptophenyl)-5-(2-mercap-tophenyl)-2,5-dihydro-1H-pyrrol-3,4-diol.
In the present work we show the result on synthesis of a new ligand, 3,4,6,7-O,O,O,O-tetrakis(carboxy (chloro) methyl)-L-ascorbic acid (H4L) and its complexes with
various divalent metal ions such as Cu, Co, Ni, Cd and Hg. The properties and characterization of these new metal complexes are also presented.
Experimental part
Instruments, materials and methods
All chemicals were purchased from BDH, and used without further purifications. FTIR spectra were recorded in KBr on Shimadzu- spectrophotometer in the range of 4000-400 cm-1. Electronic spectra in distilled water were recorded
using the UV-visible spectrophotometer type Shimadzu in the range of 200-1100 nm with quartz cell of (1 cm) path leangth. Melting points where measured with an electrothermal Stuart apparatus, model SMP30. Electrical conductivity measurements of the complexes were recorded at (25 oC) for 10-3 mol L-1 solution of the samples in distilled
water using Ltd 4071 digital conductivity meter. 1H NMR
and 13C NMR spectra were recorded on a Bruker 300-MHz
spectrometer in DMSO-d6. Chemical shifts in ppm relative
to internal Me4Si was performed. Elemental microanalyses
of the ligand were carried out by using Euro Vectro-3000A.
Metal content of the complexes were measured using atomic absorption technique by Perkin-Elmer 5000, while Hg metal is determined using Biotech Eng. Management Co. Ltd. (UK), Thermogravimetric analysis (TGA) was carried out using a Perkin-Elmer TGA 4000. The measurement was conducted under helium as inert gas at a heating rate 20 ° ْC min-1. Magnetic susceptibility values were obtained at room
temperature using the Gouy method, Johnson Mattey, model M5B-MKs, were performed. Thin layer chromatography
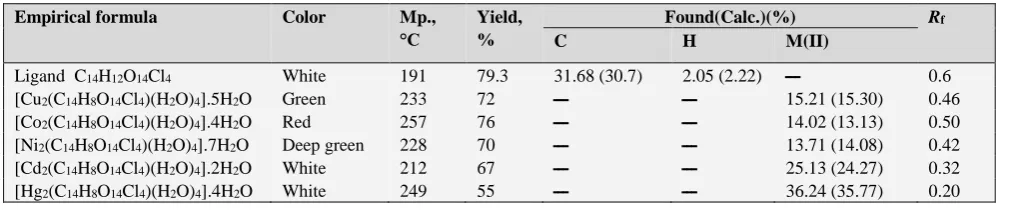
Table 1. Physical properties and analytical data for the synthesized ligand (H4L) and its complexes
Synthesis of ligand (H4L)
L-ascorbic acid (0.18 g, 1 mmol) was dissolved in a mixture of 15 ml ethanol+5ml water. Potassium hydroxide (0.23 g, 4 mmol) in ethanol (10 ml) was added. The solution was stirred for 30 minutes. Dichloroacetic acid (0.52 g, 4 mmol) was added dropwise and stirring was continued for one hour. A pale yellow solution was formed, this solution was left to stand at room temperature for a few days when a yellowish white crystalline mass was crystallized out. The resulted mass was recrystallized from ethanol when a white crystalline material was formed , melting point was found to be 191°C, the yield was 79.3%.
Synthesis of complexes (M = Cu, Co, Ni, Cd, Hg)
To a solution of the (H4L) (0.55 g, 1 mmol) in (20 ml
ethanol) a solution of 2 mmol of metal chloride in 20 ml ethanol 0,34 g CuCl2.2H2O, 0.48 g NiCl2.6H2O, 0.48 g
CoCl2.6H2O, 0.46 g CdCl2.H2O, 0.54 g HgCl2 was added.
The solutions were stirred for one hour and were left to evaporate slowly to bring down the complexes. The complexes were recrystallized from ethanol. The isolated complexes are colored solids, stable in air and insoluble in common organic solvents but completely soluble in water, ethanol, DMSO and DMF. Some physical properties for all synthesized ligand (H4L) and its complexes are shown in
Table 1.
Results and discussion
The 3,4,6,7-O,O,O,O-tetrakis(carboxy(chloro)methyl)-L-ascorbic acid (H4L), was synthesized in a good yield by the
reaction of L-ascorbic acid with dichloroacetic acid in the ratio (1:4) in presence of four mole of potassium hydroxide Scheme 1.
Scheme 1. The reaction of L-ascorbic acid with dichloroacetic acid in base media
FT-IR spectral analysis
The IR spectrum of L-ascorbic acid as starting material is compared with the new ligand (H4L) spectrum, the results
are summarized in Table 2. L-ascorbic acid exhibits bands at 3525, 3410, 3313 and 3213 cm-1 caused by (OH) positions
(C-5,6,2,3) respectively, these are disappeared in the spectrum of the new ligand accompanied by the appearance of three bands in the 3429 (broad), 1595 (asym.), 1435 (sym.) are due to carboxyl group. (C-1=O) stretching vibration appeared at 1716 cm-1. The bands at 1678, and
1647 cm-1 in the starting L-ascorbic acid are due to the (C=C), (C=O) are shifted and appeared as a broad band centre at 1631 cm-1 in the new ligand. The bands located at
1595 and 1435 cm-1 which were assigned to (C=O)
stretching vibration for (COOH) in free ligand (H4L), were
shifted to lower frequency and appeared at 1404 and 1332 cm-1 in the Cu-complex, at 1450 and 1396 cm-1 in the
Co-complex, at 1445 and 1384 cm-1 in the Ni-complex, at 1404
and 1320 cm-1 in the Cd-complex, and at 1404 and 1330
cm-1 in the Hg-complex. Components of the bands were
assignable to the asymmetric and the symmetric stretching frequencies of the carboxylate ion with average separation COO-= 72, 54, 61, 84, 74 cm-1, respectively indicating the
deprotonation of the carboxylic proton and suggests that coordination occurs through the carboxylate ion as a bidentates bonding nature.10,11 New bands appeared in the
range 418-459 cm-1 in the all complexes assignable to
(M-O) vibrations.12,13 A band due to (C=O) of the lacton ring
appeared as a shoulder within the range of 1720-1740 cm-1
in all complexes. A strong broad absorption band appeared around 3552-3410 cm-1 associated with water molecules in
these metal complexes. Coordinated H2O appeared at range
823-827 cm-1 in all complexes.14,15
NMR spectra for the ligand (H4L)
1H-NMR spectrum of the ligand (H
4L) Figure 1 in
DMSO-d6 exhibited several signal at 3.61 ppm is attributed
to CH2-6, CH-5 while CH-4 of lactone ring is appeared at
4.64 ppm. The CH-7, CH-8, CH-9 and CH-10 proton signals are appeared at 5.86 ppm, the weak signal at 6.31 ppm can be assigned to CH-9 and CH-10.
13C-NMR spectrum Figure 2 showed weak signal at 172
ppm which belongs to carboxylic acid, while the C=O carbon signal is appeared at 164 ppm. The two peaks at 123 and 144 ppm are attributed to C-2 and C-3 carbons, respectively. This may be due to the conjugated double bond from C-1 to C-3 causing upfield shift of C-3 carbon signal. The C-Cl carbon signal is appeared at 80 ppm, the signals at 71, 67 and 62 ppm are assigned to C-4, C-5 and C-6 carbon atoms, respectively.
Empirical formula Color Mp., °C
Yield, %
Found(Calc.)(%) Rf
C H M(II)
Ligand C14H12O14Cl4 White 191 79.3 31.68 (30.7) 2.05 (2.22)
ـــ
0.6[Cu2(C14H8O14Cl4)(H2O)4].5H2O Green 233 72
ـــ
ـــ
15.21 (15.30) 0.46[Co2(C14H8O14Cl4)(H2O)4].4H2O Red 257 76
ـــ
ـــ
14.02 (13.13) 0.50[Ni2(C14H8O14Cl4)(H2O)4].7H2O Deep green 228 70
ـــ
ـــ
13.71 (14.08) 0.42[Cd2(C14H8O14Cl4)(H2O)4].2H2O White 212 67
ـــ
ـــ
25.13 (24.27) 0.32[Hg2(C14H8O14Cl4)(H2O)4].4H2O White 249 55
ـــ
ـــ
36.24 (35.77) 0.20O O
O O
Cl
O
O H Cl
O O H
O
Cl O
OH O Cl
O
OH
O O
OH O H O H
OH
+4 KOH + 4 Cl2CHCOOH
Table 2. Assignments of the IR spectral bands of L-ascorbic acid, ligand(H4L) and its complexes(cm-1)
Figure 1. 1H-NMR spectrum of the ligand
Figure 2. 13C-NMR spectrum of the ligand
Spectral studies
The electronic absorption bands as well as the magnetic moment values are summarized in Table 3. The UV-Visible spectrum of the ligand (H4L) showed one absorption at
(41152cm-1) is due to * transition.16
The electronic spectrum of Co-complex in water solution exhibited two bands appeared at (15797 cm-1) and (19646
cm-1) were assigned to the 4T
1g4A2g (2) and 4T
1g4T1g(p) (3) transitions respectively of octahedral
geometry17. From the ratio of (
3)/(2) (1.24) the value of
Dq/B (0.95) was obtained. The value of B' (890.93) as well as the position of 1(10Dq) (8463 cm-1) were calculated by
using Tanaba-Sugano diagram for d7 configuration of the
octahedral configuration geometry.18 The value of (0.91)
indicates some covalent character. The conductivity measurement indicates that the Co-complex is non-ionic.
Spectrum of Ni(II) complex showed three bands in the visible region at (25773 cm-1) 3A
2g3T1g(P) (3), (14556
cm-1) 3A
2g3T1g(F) (2) and the last one is at (9174 cm-1) 3A
2g3T2g, (1). The ratio of 2/1, (1.59) was applied on
Tanaba-Sugano diagram for d8 octahedral complexes,19,20
Bcomplex and , 10Dq(1) were calculated theoretically. The
conductivity showed that the Ni(II)-complex was non-electrolyte. The spectrum of Cu(II) complex showed broad band at (12422 cm-1) assigned to 2Eg2T
2g transition which
refers to Jahn-Teller distortion of octahedral geometry.21
The conductivity measurement of the complex indicates that the complex is non-electrolyte.
The spectra of Cd(II), Hg(II) complexes gave no bands in the visible region, only bands assigned to charge transfer transitions (40983 cm-1) Cd(II), (35211 cm-1) Hg(II)
complexes were observed, compared with free ligand showed one band at (41152 cm-1) confirms the complex
formation.22 The conductivity measurements of the two
complexes indicate that the complexes are non-electrolyte.
Magnetic studies
The magnetic moment values at (294 K) of the [M2LCl4].XH2O M2+ = Cu, Co, Ni Table 3 show values 0.80,
2.76 and 1.62 B.M., respectively which are lower than the total spin-only values indicating a high spin octahedral geometry around metal ion. The lowering of these magnetic moments indicates a dominate antiferromagnetic interaction in all complexes. This may due to the fact that the syn-syn carboxylate provide a small metal-metal distance and results in a good overlap of the magnetic orbitals, an antiferromagnetic coupling is always induced.23-24
Molar ratio
The complexes of the ligand (H4L) with metal ions [Co(II),
Ni(II), Cu(II), Cd(II), Hg(II)] were studied in solution using water as solvent, in order to determine (M:L) ratio in the prepared complexes, following molar ratio method.25 A
series of solutions were prepared having a constant concentration (c) 10-3 M of the hydrated metal salts and the
ligand (H4L). the (M:L) ratio was determined from the
relationship between the absorption of the observed light and mole ratio (M:L) found to be 2:1.
Empirical formula OH, COOH C=O C=C
C=O
as(COO)- s(COO)- Coordinated.H2O M-O
L-ascorbic acid C6H8O6
3525,s; 3410,s; 3313,s 3213,s
1720 1678 1647
ـــ
ـ
ــ
ـــ
ـــ
Ligand C14H12O14Cl4 3429, br 1716 1631,br 1595 1435
ـــ
ـــ
[Cu2(C14H8O14Cl4)(H2O)4].5H2O 3342, m 1730 1662,m 1404 1332 823,m 443
[Co2(C14H8O14Cl4)(H2O)4].4H2O 3448, br 1735 1640,m 1450 1396 827,s 440
[Ni2(C14H8O14Cl4)(H2O)4].7H2O 3377, br 1740 1655,m 1445 1384 825,m 459
[Cd2(C14H8O14Cl4)(H2O)4].2H2O 3473, br 1720 1627 1404 1320 825,s 426
Table 3. Magnetic moments and electronic spectral bands (cm-1) of the complexes.
Table 4. Molar ratio data for H4L-complexes
V, ml L-Cu (=805) L-Co (=509) L-Ni (=710) L-Cd (=290) L-Hg (=284)
(1) 0.5 1.90 1.95 0.78 2.14 1.48
(2) 1 2.64 2.75 1.44 2.68 1.97
(3) 1.5 2.87 2.97 1.38 3.52 2.14
(4) 2 3.42 3.49 1.89 3.72 2.64
(5) 2.5 3.58 3.68 1.95 3.92 2.81
(6) 3 3.78 4.12 2.26 4.12 2.97
(7) 3.5 3.89 4.35 2.47 4.19 3.29
(8) 4 4.11 4.76 2.59 4.34 3.57
(9) 4.5 4.24 4.78 2.74 4.41 3.66
(10) 5 4.27 4.79 2.79 4.57 3.78
The results of complexes formation in solution are shown in Table 4, these data are compatible with the results obtained by atomic absorption for determination metal analysis in the complexes Table 1.
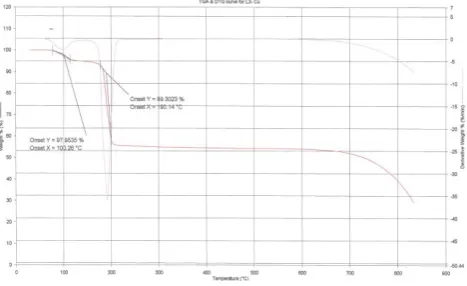
Thermal decomposition measurement
The TGA thermal analysis curve for C14H12O14Cl4 ligand
is shown in Figure 3. The sample decomposes into two decomposition processes with peaks detected over in the 213-440 °C range. About half weight of the complex decompose at the first step occurs at 213 °C with weight loss of 4.5743 mg, 50.0969 % (calc.=4.6825 mg, 51.2820 %) is related to the loss of chlorine containing fragments.
Figure 3. TGA, DTG thermograms of the ligand (H4L)
The second step from 440 °C corresponding to the loss of (CO) molecule, showed a weight loss 0.4656 mg, 5.0991 % (calc.=0.4682 mg, 5.1282 %). The final weight of the residue is 4.0911 mg, 44.8045 %
Figure 4. TGA, DTG thermograms of Cu(II) complex
The TGA curve for [Cu2(C14H8O14Cl4)(H2O)4].5H2O is
shown in Figure 4. The sample found to be stable up to 74 °C as shown by the TG curve. The complex decomposes in two steps over the temperature range 100-190 °C. The first decomposition shows weight loss of 2.0994 mg, 5.4229 % (calc.=2.5188 mg, 6.5060 %) which is due to the loss of three H2O molecules. The second step with weight
loss of 15.5811 mg, 40.2458 % shows a peak in the DTG at 190 °C which is related to the loss of residual water and organic fragments.
Complex eff, B.M. Band position, cm-1
Assignments Bcomplex 10Dq (1) theoretical, cm -1
m
-1 cm2 mol-1
L-Co(II) 2.76 19646 3
15797 2
4T
1g4T1g(p) 4T
1g4A2g
890.93 0.91 8463 10.73
L-Ni(II) 1.62
25773 3
14556 2
9174 1
3A
2g3T1g(P) 3A
2g3T1g(F) 3A
2g3T2g
773.38 0.75 13920
12.35
L-Cu(II) 0.80 12422 2Eg2T
2g
ـــ
ـــ
ـــ
7.19L-Cd(II)
ـــ
40983 ILCTـــ
ـــ
ـــ
13.68Thin layer chromatography (TLC)
The solution of ligand (H4L) and its complexes in water as
solvent appeared in one spot, this is confidence that all these compounds are pure and have one isomer. Table 1 shows the
Rf for complexes and ligand (H4L).
Conclusion
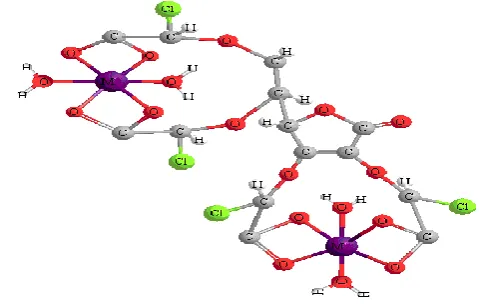
The ligand (H4L) acts as a tetra-dentate dianion with two
metal ions coordinate with each carboxylate group in an octahedral geometry. Figure 5
Figure 5. The proposed molecular structure of complexes, MII= Cu,
Co, Ni, Cd, Hg
Acknowledgment
I wish to express my deepest and sincerest appreciation to Prof. Dr. Falih H. Musa for his positive guidance, enlightened mentoring and encouragement. Sincere thanks are also to the staff members of the Department of the Chemistry.
References
1Martell, A. E., Seib, P. A. and Tolbert, B. M., ACSAdv. Chem.
Ser., 1982, 200, 153−178, Eds., American Chemical Society,
Washington,
2Hughes, D. L., J. Chem. Soc., Dalton Trans.1973, 21, 2209−2215.
3Hollis, L. S., Amundsen, A. R. and Stern, E. W., J. Am. Chem.
Soc., 1985, 107, 274−276.
4Padayatty, S. J., Katz, A., Wang, Y., Eck, P., Kwon, O., Lee, J. H.,
Chen, S., Corpe, C., Dutta, A., Dutta, S. K. and Levine, M., J. Am. Coll. Nutr., 2003, 22, 18-35.
5Jernov, J., Blount J., Oliveto, E., Perrotta, A., Rosen, P. and
Toome. V., Tetrahedron,1979, 35, 1483.
6Andrews, G. C., Crawford, T., Seib, P. A. and Tolbert, B. M.,
Ascorbic Acid: Chemistry, Metabolism and Uses, Advances in Chemistry Series 200, American Chemical Society, Washington, DC, 1989 pp. 59–79.
7Musa, F. H., Mukhlus, A. A. and Sultan, J. S., J. Ibn-Al-Haitham
Pure Appl. Sci., 2011, 24, 2.
8Musa, F. H., Mukhlus, A. A. and Sultan, J. S., J. Ibn-Al-Haitham
Pure Appl. Sci.,2012, 25, 1.
9Fizea, S. M., Musa, F. H. and AL-Bayti, H. A. F., Accepted in J.
Ibn-Al-Haitham Pure Appl. Sci.,2013,
10Nakamoto, K., Infrared and Raman Spectra of Inorganic
Coordination Compounds, 5th Editioin, John Wiley & Sons,
1997.
11Abu-Melha, K. S. and El-Metwaly, N. M., Transit. Met. Chem.,
2007, 32, 828-834.
12Huang, J., Quj, Q., Wang, L. F., Liu, Y. Q., Wang, Y. Y., Song,
Y. M., Zhang, C. J., Zhau, R., Chem. Papers,2005, 59: 267-270.
13Pansuriva, P. B. and Patel, M. N., J. Enzym. Inhib. Med. Chem.,
2008, 23 (1), 108-19.
14Jabs, W. and Gaube, W., Z. Anorg. Allerg. Chem., 1984, 514,
179-184.
15Wimalasena, K. and Mahindrate, M. P. D., J. Org. Chem.,1994,
59, 3427-3432.
16Olabisi, O., Mahindrate, M. P. D. and Wimalasena, K., J. Org.
Chem., 2005, 70, 6782-6789.
17Yadav, P. N., Demertzis, M. A., Demertzi, D., Skoulika, S. and
West, D. X., Inorg. Chem. Acta.,2003, 349, 30-36.
18Chohan, H. Z., Synth. React. Inorg. Met. Org. Chem.,2001, 31, 1.
19Jabs, W. and Gaube, W., Z. anorg. All. Chem.,1986, 538,
166-176.
20Lever, A. B. P., J. Chem. Ed., 1968, 45, 711.
21Lever, A. B. P. Inorganic Electronic Spectroscopy, 2nd Edition,
Elsevier, Amsterdam, 1984.
22Mohamed, G. G. and Abd El-Wahab, Z. H., Spectrochem. Acta,
2005, A61: 1059-1068.
23Cotton, F. A. and Willinson, G. Advanced Inorganic Chemistry,
4th Edition, John Wiley and Sons, 1980.
24Himanshu, A., Francesc, L. and Rabindranath, M., Eur. J. Inorg.
Chem., 2009, 22, 3317-3325.
25Tohyama, T., Saito, T., Mizumaki, M., Agui, A. and Shimakawa,
Y., Inorg. Chem.,2010, 49, 2492-2495.