International Journal Advances in Social Science and Humanities
Available online at: www.ijassh.com
RESEARCH ARTICLE
Analysis of the Relationship between Corporate Success in Public
Institutions and Tax Compliance in Turkey using Logistic
Regression
Gurler Hazman Gulsum*
Faculty of Economic and Administrative Sciences, Finance Department, Afyon Kocatepe University,Turkey.
*Corresponding Author: Email: [email protected]
Abstract
Voluntary tax compliance could be expressed as taxpayers fulfilling their taxation liabilities on time and voluntarily. The role of the public authority is vital in establishing and improving tax compliance. Corporate quality, in particular, influences the trust of individuals in the state. The impact of fundamental changes in public administration that improve the quality and efficiency of tax compliance is addressed. Since corporate taxpayers are studied in the present research, the universe of the study included the top 500 corporations registered at Istanbul Chamber of Industry in Turkey. However, since it would be difficult to reach the universe due to time and cost constraints, the context of the study was limited with 100 corporations. In this study, conducted to determine the effect of corporate success on tax compliance, logistic regression analysis was utilized to test the proposed research model and hypotheses.
Keywords: Tax compliance, Logistic Regression Analysis, Institutional success.
Remark: This study was supported by Scientific Research Project in Afyon Kocatepe University with the number of 12.SOS.BIL.11"
Introduction
Taxes are the main sources of revenue for financing the public goods and services. Enforced by law, tax payments are exposed to several economic, cultural, social factors. These factors are significant in establishing the tax compliance of the individuals. The attitude of the taxpayer towards the taxes should be in the form of awareness for and fulfillment of taxation obligations.
The attitude of taxpayers towards taxes should be one of awareness and fulfilment of
taxation obligations. Tax awareness,
expressed as the taxpayer’s level of willingness to fulfil tax duties and obligations in a timely and complete manner, is affected by individual and environmental factors. Among these factors, administrative factors involving the public authority would contribute to the successful operation of tax administration. This study
examined six related sub-variables
considered to affect and advance corporate success.
Thus, the study’s objective was to establish the relationships between administrative factors such as the efficient operation of public administration, the success of the fiscal system, minimizing the deterioration,
sufficiency, and validity of public
regulations, openness of the fiscal system,
knowledge, and experience of tax
Gurler Hazman Gulsum | January 2016 | Vol.4 | Issue 01 |53-61 54
Corporate Success and Quality in
Public Administration
All corporations have experienced significant changes as a result of globalization. It forced corporations that need to maintain customer satisfaction and their customer base, to ensure total quality management due to the ever-increasing need to pursue quality and address continually changing customer
expectations. Today, quality is the
fundamental variable in the public sector. Reorganization efforts in the public sector have recently started or accelerated due to certain factors. One of these factors was a discussion of the reasons and consequences of the failure of the public sector due to the influence of Public Choice Theory. Because of this and other factors, the public administration, feeling the need for a change, came up with different methods and dimensions.
Efficient corporations would mean an efficient environment in the public sphere as well. With public efficiency, since the citizens and officials would be interacting with one another due to social responsibility, they would be better able to analyze public policies [1]. Based on these fundamental characteristics, significant progress was obtained in the public sector where the reorganization process has been more or less accomplished. Thus, it was reported that institutional quality would contribute to the
elimination of market failures, the
asymmetrical information problem, and the establishment of accountability of the state to the public [2].
Institutional failures and political corruption result in a reduction of trust in the public sector. Furthermore, it is generally accepted that, in addition to the lack of political stability, factors such as the failure of politicians to make rational decisions under political pressure have a negative impact on the perceptions of institutional quality [3].
Studies on institutions show that many of them are administrated unsuccessfully. This not only has political consequences, but economic consequences as well. For instance, a study by [4] identified that democratic and well-managed successful corporations had positive effects on economic indicators and
facilitated growth and development. Similar studies were conducted by [5] and [6], and similar findings were obtained, showing that poor public administration was a serious threat to economic growth.
Empirical studies have shown that unsuccessful public institutions also affect fair income distribution adversely; in fact, they accelerate unfair income distribution. Similar results were obtained in studies conducted using the Gini coefficient and institutional quality indicators [7]. Thus, the linear correlation of institutional quality with economic growth, as well as the correlation of economic growth with fair income distribution support this result [8].
The Relationship between Corporate Success and Corporate Quality and Tax Compliance
In a study conducted by [9] on the relationship between corporate quality and tax compliance, it was reported that efficiency in public administration would improve tax compliance by the taxpayers [10], in their study on good governance and taxation, determined that an operational tax system would result in more qualified and quality tax administration and there was a positive significant relationship between qualified tax administration and voluntary tax compliance.
Corporate quality would result in shorter bureaucratic procedures, decreasing the tax compliance costs of individuals and firms, and of taxpayers in general. In addition, it has been stressed that institutions in good working order could show more resistance to the lobbying efforts of pressure [11].
Gurler Hazman Gulsum | January 2016 | Vol.4 | Issue 01 |53-61 55 expressed that this is more significant in
developing countries. It was concluded that the establishment of public governance quality would be the best strategy to expand tax perception culture among the taxpayers.
Tax objection is an international
phenomenon that exists both in developed and developing nations. However, tax revenue loss due to tax objection in developing countries is considerably higher than developed nations. [15]. Thus, clarification of institutional factors on tax compliance will have an impact on tax capacity as well.
Research Methodology
In the initial stage of the study,
international and national literature
reviewed on studies that are about tax payment habits of taxpayers and their satisfaction levels with public services and about corporate quality and corporate success. In the second stage, a quantitative research method, survey form was used. During the design of the survey form,
national and international studies,
especially these authored by [16], [17] and [18] were reviewed in detail.
Corporate taxpayers in Turkey were considered as the universe of the study. Thus, “ISO 500/2013 List,” prepared by Istanbul Chamber of Industry, which includes the top 500 industrial corporations in Turkey, was set as the study universe. The sample was defined as the 100 corporations from this list that met the availability criterion. Services of a survey and consultancy firm that could conduct countrywide research were recruited for the implementation of the survey forms.
Binary Logistic Regression Analysis
In social sciences, certain variables in causation analysis consist of binary data
such as “yes/no, positive/negative,
satisfied/dissatisfied,successful/unsuccessful. ” Logistic Regression Analysis could be preferred for data formed by binary or categorical dependent variables.
A general definition of the logistic regression model could be given as follows:
L= ln = =
where is the probability of the occurrence of an event and equation 1- is the probability of non-occurrence of the event. Z could be written as Z = β0 +β1X1 +β2X2 +β3X3 +...+βnXn. Regression coefficients are indicated by β.
In logistic regression analysis, after the estimation of logit model coefficients, generally the reliability of the model should be tested. Thus, the hypotheses about the existence of a significant relationship between the independent variables and categorical dependent variables should be tested. The acceptability of the model could be determined using Chi-square test (Model Chi-square test) or Hosmer and Lemes how statistics.
Data Collection
Reliability tests resulted in a Cronbach alpha value (α) of 0.915. This figure could be considered as quite high, therefore it could be accepted that the reliability of the test is high. As a result of the normality test, significant value was calculated as 0.00. (α < 0.05, the data did not demonstrate a normal distribution). To select the appropriate technique of analysis, we need to calculate variance homogeneity test. The results reflected an α > 0.05 value for each variable. Hence, there was homogeneity. However, analysis results showed that, despite homogeneity, non-parametric tests should be preferred since the data did not distribute normally.
Research Hypotheses
The levels of the taxes paid by taxpayers and their satisfaction with the public services they received were considered as being “satisfied” and “not satisfied.” Dependent variable was coded with the expression “COMPLIANCE,” reflecting tax compliance. In addition to the level of the taxes paid and satisfaction levels, sub-variables including 25 questions were considered as independent variables.
Gurler Hazman Gulsum | January 2016 | Vol.4 | Issue 01 |53-61 56 of the public services received, and corporate
success variables.
H0: There is no positive and significant relationship between taxpayers' satisfaction of the public services received and corporate success variables.
Dependent variable was coded (yes/no decision) in SPSS as 0: No and 1: Yes.
Independent variables were determined as follows:
(SYSTEM): Contains questions that express the relationship between changes in the tax system and tax compliance,
(CORRUPTION): Consists of questions related to the effects of the corruption in tax administration and public institutions on tax payment attitude,
(REGULATION): Contains questions about the relationship between satisfactory public regulations and tax compliance,
(OPENNESS): Includes questions that show the relationship on open and comprehensible regulations on taxation and tax payment attitude,
(PERSONNEL): Entails questions on the relationship between the ability of tax administration personnel to create solutions for taxpayer problems and tax payment habits,
(TAX POLICIES): Contains questions that include the relationship between the consideration of taxpayers’ needs in tax policy decisions and tax compliance.
Result and Discussion
Participants’ Demographics
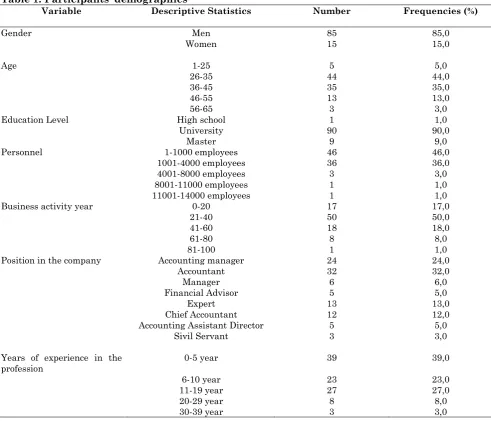
Table 1: Participants’ demographics
Variable Descriptive Statistics Number Frequencies (%)
Gender Men 85 85,0
Women 15 15,0
Age 1-25 5 5,0
26-35 44 44,0
36-45 35 35,0
46-55 13 13,0
56-65 3 3,0
Education Level High school 1 1,0
University 90 90,0
Master 9 9,0
Personnel 1-1000 employees 46 46,0
1001-4000 employees 36 36,0
4001-8000 employees 3 3,0
8001-11000 employees 1 1,0
11001-14000 employees 1 1,0
Business activity year 0-20 17 17,0
21-40 50 50,0
41-60 18 18,0
61-80 8 8,0
81-100 1 1,0
Position in the company Accounting manager 24 24,0
Accountant 32 32,0
Manager 6 6,0
Financial Advisor 5 5,0
Expert 13 13,0
Chief Accountant 12 12,0
Accounting Assistant Director 5 5,0
Sivil Servant 3 3,0
Years of experience in the
profession 0-5 year 39 39,0
6-10 year 23 23,0
11-19 year 27 27,0
20-29 year 8 8,0
Gurler Hazman Gulsum | January 2016 | Vol.4 | Issue 01 |53-61 57 As is presented in Table 1, 85% of the
participants were male and 15% were females and %75 were married, 24% were bachelors and 1% was divorced. 1% of the participants were high school and 90% were college graduates. Remaining 9% were had graduate level education. None of the participants were primary or middle school graduates.
Complementary statistics column in the table demonstrates that the participants were divided into five groups based on their age: 1-25; 26-35; 36-45; 46-55; and 56-65. 5% of the participants were in the 1-25 age range; 44% were in 26-35; 35% were in 36-45 and 13% were in 46-55, and finally 3% were in the 56 – 65 age range. Based on their corporate positions, 24% of the participants were accounting managers, 32% were accountants, 6% were managers, 5% were certified accountants, 13% were experts, 12% were chief accountants, 5% were deputy accounting managers, and 3% were clerks. An analysis of the years in operation of the participating corporations demonstrated that 17% were in operation for 0-20 years; half (50%) were 21-40 years; 18% were 41-60 years, 8% were 61 -80 years, and 1% were in
operation for 81-100 years. 6 out of 100 participating firms did not disclose the years in operation information.
Participants’ years of seniority was grouped as 0-5 years; 6-10 years; 11-19 years; 20-29 years; and 30-39 years. 39% of the participants declared that they worked at their current firm for 05 years; 23% for 6 -10 years; 27% for 11-19 years; 8% for 20-29 years, and 3% stated that they worked at their current firm for 30-39 years.
Analysis of the Research Model (Logistic Regression Analysis Results) and Findings
Logistic regression analysis was used for data analysis, since the effects (the explanatory power) of six independent variables on the dependent variable were scrutinized in the research model. Logistic regression is used when the dependent variable has an absolute binary result such as “yes” and “no” (dichotomous). Since the values did not display a normal distribution, logistic regression analysis was preferred in the study, instead of linear regression.
Table 2: The Significance of the Model Coefficients
Chi-square df Significance
Step 1 Step 42.194 6 0,00
Block 42.194 6 0,00
Model 42.194 6 0,00
Since sign value was p = 0.000 < 0.05, chi-square value was significant. All logit coefficients except the constant term were
not null. In other words, model coefficients were significant. Independent variables contribute the prediction of the dependent variable.
Table 3: Goodness of Variable (Model Summary)
-2 Log likelihood Cox and Snell R Square Nagelkerke R Square
0 128,129 - -
1 86,014 344 476
Comparison of the value observed in logistic regression and the predicted value is based on the log likelihood (-LL) function. In the logistic regression that contains the constant, -2 LL value is 128.219. Goodness of fit statistics for the constant and all independent variables are presented in Block 1. -2 LL value for this model is 86.014. It is smaller than the -2 LL value for the
Gurler Hazman Gulsum | January 2016 | Vol.4 | Issue 01 |53-61 58
Table 4: Hosmer-Lemeshow Test and Classification
Step Chi-square df Sign Observed Predicted Percentage Correct
1 3,676 8 0,885 (satisfaction) 0: no 1:yes
0: no 59 7 89,4
1: yes 12 22 64,7
Overall percentage 81,0
Based on this table, 89.4% of those who were not satisfied with the public services they received due to the tax they paid and 64.7% of those who were satisfied with the same
were estimated correctly, hence it was determined that 81% of the model was estimated correctly.
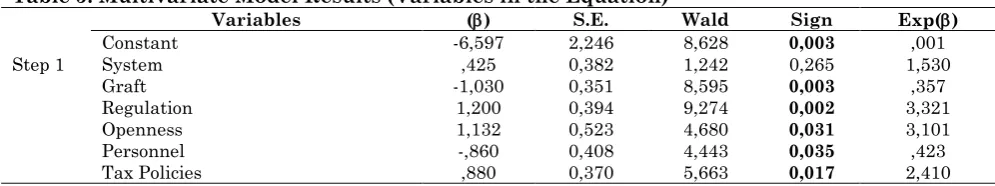
Table 5: Multivariate Model Results (Variables in the Equation)
Variables () S.E. Wald Sign Exp()
Constant -6,597 2,246 8,628 0,003 ,001
Step 1 System ,425 0,382 1,242 0,265 1,530
Graft -1,030 0,351 8,595 0,003 ,357
Regulation 1,200 0,394 9,274 0,002 3,321
Openness 1,132 0,523 4,680 0,031 3,101
Personnel -,860 0,408 4,443 0,035 ,423
Tax Policies ,880 0,370 5,663 0,017 2,410
Conducted analysis showed that the corporate success variable that characterized the constant was significant (p = 0.003 < 0.05). Thus, when the factors that could affect the satisfaction levels for taxes paid and public services received were analyzed, it was observed that corporate success variable was significant.
The first column in the table reflects
values related to each variable. These values would be utilized in formation of the multivariate regression estimation function. In binary logistic regression analysis, these values are limited by two options. For instance, “yes” or “no,” or “to do” or “not to do.” Values in the column reflect the direction of the relationship. Based on the values in this column, (REGULATION) variable affected the the satisfaction levels for taxes paid and public services received (1.200). Related variable included the questions that expressed the correlation between adequate public regulations and tax compliance. Following the “regulation” variable, (OPENNESS) was the second variable that affected the dependent variable the most (1.132). Related variable included the questions that expressed the correlation between the openness and clarity of the legal code on taxation and taxpayer habits. These were followed by (TAX POLICIES) variable (0.880). It was observed that the variable of (SYSTEM), another sub-
variable of corporate success included in the analysis, was not effective. “System” variable included the questions that expressed the correlation between the changes in taxation system and tax compliance.
Thus, it could be concluded that there was a
significant relationship between the
satisfaction levels for taxes paid and public services received (COMPLIANCE) and the six independent variables determined as the variables that affected corporate quality, with the only exception of (SYSTEM) variable.
(GRAFT) (p = 0.003), (REGULATION) (p=
0.002), (OPENNESS) (p=0.031),
(PERSONNEL) (p =0.035), (TAX POLICIES)
(p=0.017) variables were statistically
significant at 0.05 significance level, while (SYSTEM) variable was not significant (p= 0.265).
Gurler Hazman Gulsum | January 2016 | Vol.4 | Issue 01 |53-61 59 When (REGULATION) increases by 1 unit,
log odds increases by 3.321 units. Similarly, if (OPENNESS) increases by 1 unit, log odds increases by 3.101, while (TAX POLICIES) increases by 1 unit, log odds increases by
2.410 units.Therefore, the equation obtained as a result of logistic regression analysis could be written as follows:
Obtained equation demonstrates that the dependent variable of tax compliance is affected by the changes in the tax system, corruption in tax administrations and public institutions, adequate and necessary public
regulation levels, openness and
comprehensiveness of legal code and regulations on taxation, ability of the tax
administration personnel to provide
solutions for the problems of taxpayers, and the success of tax policies. It was concluded that the related independent variables were the factors that affected corporate success.
Although the effects of independent variables on tax compliance were varied, it was observed that there was a negative relationship between tax compliance and (GRAFT) variable. This results shows that an increase in corruption would lower tax compliance and negatively affect fiscal ethics. However, it was also observed that institutional regulations and openness and comprehensiveness of the taxation system increased tax compliance. Especially, the ability of the personnel to create solutions for taxpayer problems administratively and their satisfactory level would increase tax compliance. It was determined that adequate and successful implementation of the changes in tax system and the success of tax policies would affect tax compliance positively as well. Thus, a public authority with institutional success and quality and a more dynamic public authority would be more valuable and trustworthy for the taxpayer, which would in turn would affect tax perception positively.
Conclusion
Public revenues are a significant source of the financing public expenditures and executing public policies. To reach the potential public revenues is one of the targets of the central administration. For
this purpose, the establishment of tax compliance is a sensitive subject as are the other measures that should be implemented.
Tax compliance, which is a psychological approach that the taxpayers must have to fulfil their tax liabilities in a timely manner, could be determined by several factors. Many several studies have reported that economic, social, psychological, and administrative factors determine the tax compliance.
In this framework, the way the tax administration where the tax assessments are conducted and public administration that serves the political authority, which has the capacity of taxation, are perceived by the taxpayers could be a determinant. Other factors that could affect tax compliance and lead to the failure of the public authority include corruption and squandering money, an inefficient public administration, and doubts about whether the taxes are being used for appropriate purposes. The quality and success of services provided by the administration could increase in the state,
positively affecting voluntary tax
compliance.
Thus, the relationship between the tax compliance and the potential sub-variables that reflect corporate success was tested in the present study. Tax compliance was accepted as the dependent variable and “system,” “graft,” “regulation,” “openness,” “personnel,” and “tax policies” were coded as the independent variables. The “system” variable reflects the relationship between the changes in the taxation system and tax compliance, while the “graft” variable measures the effects of the corruption in tax administration and public institutions and
their effects on taxpayer habits.
Furthermore, the “regulation” variable
Gurler Hazman Gulsum | January 2016 | Vol.4 | Issue 01 |53-61 60 expresses the relationship between the
adequacy of public regulations and tax compliance, while the “openness” variable reflects the relationship between the legal code and regulations concerning about taxation and tax payment habits. The
remaining variables were coded as
“personnel” and “tax policies.” These variables stress the relationships between the ability of tax administration personnel to resolve taxpayers’ problems and tax payment habits, and the significance of taxpayers’ needs in determiningation of tax policies.
The analysis conducted to test the alternative hypothesis, “There is a positive and significant relationship between the levels of taxes paid and satisfaction with the public services received, and the corporate success variables,” revealed that all the variables but the graft variable positively affected tax perceptions. The negative effect of graft on tax perception was explained by the fact that the variable was signed as negative. Increasing corruption would negatively affect the tax perceptions of taxpayers, hence decreasing tax revenues. Taxpayers would want to know where and how tax revenues would be spent, because increasing belief in the efficient and productive use of tax revenues would facilitate the attainment of potential tax revenue. If corruption decreased, initial confidence in the public administration would increase, and individuals would act more sensibly in fulfilling their duties and responsibilities due to their citizenship consciousness.
The factors that contributed to increasing tax consciousness by positively affecting tax perceptions were the independent variables coded as “system,” “regulation,” “openness,” and “tax policies.” The coefficient value for the “regulation” variable was 0.12; thus, when compared to the other variables, it could be observed that regulation was the most effective variable on tax perception. Therefore, the adequacy and sufficiency of tax regulations are important to taxpayers. That variable was followed by the “tax policies” (0.88) and “personnel” variables (0.86), which affected tax perception. Since their coefficient values were similar, it could be argued that they both had similar significance for the taxpayer.
These variables, which were accepted as having an effect on public administration services and thus influenced success, represented corporate success. Factors such as an open and comprehensible tax system, success of tax regulations, able and experienced tax administration personnel, successful tax policies, and a decrease in corruption would increase corporate quality and success. Thus, corporate success would influence tax consciousness, contributing to the establishment of fiscal ethics. It is obvious that as public administrations would cease to be bulky and become efficient, as their operations were performed in a timely and successful manner, and as they catered to the needs of tax payers, follow up innovations and become successful, tax perceptions would be affected positively.
References
1.Torgler Benno, Schnider Friedrich (2009) The ımpact of tax morale and ınstitutional quality on the shadow economy, Journal of Economic Psychology, 30:228-245.
2.Barry Thierno A, Tacneng Ruth (2014) The Impact of Governance and Institutional Quality on MFI Outreach and Financial Performance in Sub-Saharan Africa, World Development, 58:1-20.
3.Molinari M Christina (2013) A Second Best Theory of Institutional Quality, Public Organization Review, 1-16.
4.Butkiewicz James L,Yanıkkaya Halit (2006) Institutional Quality and Economic Growty: Maintenance of the Rule of Law or Democratic Institutions, or Both?, Economic Modelling 23:648-661.
5.Shleifer Andrei, Vishny, Robert W (1993) Corruption, The Quarterly Journal of Economics, 108(3):599-617.
Gurler Hazman Gulsum | January 2016 | Vol.4 | Issue 01 |53-61 61 7.Carmignani Fabrizio (2009) The Distributive
Effects of Institutional Quality When Government Stability is Endogenous", European Journal of Political Economy, 25:409-429.
8.Devangi Liyanage, Perera H, Lee Grace (2013) Have Economic Growth and Institutional Quality Contributed to Poverty and Inequality Reduction in Asia?, Journal of Asian Economics, 27:71-86.
9.Buehn Andreas, Lessmann Christian, Markwardt Gunther (2013) Decentralization and the Shadow Economy: Oates Meets Allingham-Sandmo", Applied Economics, 45:2567-2578.
10. Everest Philip M, Sandall R (2009) Linking Business Tax Reform with Governance How to Measure Sucess, Working Paper, Inverstment Climate Department, Worldbank Group. 11. Breen Micheal, Gillanders Robert (2012)
Corruption, Institutions and Regulation, Econ. Grov., 13:263-285.
12. Torgler Benno, Schneider Friedrich G (2007) Shadow Economy, Tax Morale, Governance and Institutional Quality: A Panel Analysis, CESifo Working Paper No: 1923:1-60.
13. Cummings Ronald G, Vazquez Jorge M, Mckee Michael, Torgler Benno (2009) Tax Morale Affects Tax Compliance: Evidence from Surveys and An Artefactual Field Experiment, Journal of Economic Behaviour and Organization, 70:447-457.
14. Alabede James, Ariffin Zaimah Bt. Zainol, Idris Kamil Md (2011) Public governance quality and tax compliance behaviour in Nigeria: The moderating role of financial condition and risk preference, Issues in Social and Environmental Accounting, 5(1/2):4-24.
15. Terkper S (2003) Managing Small and Medium Size Taxpayers in Developing Economies, Tax Note International, 211-234. 16. Palil Mohd Rızal (2010) Tax Knowledge and Tax Compliance Determinants in Self Assessment System in Malasia, Thesis submitted to the Unv. of Birmingham fort he degree of doctor of philosophy.
17. Frey Bruno, Torgler Benno (2007) Tax morale and conditional cooparetion, Journal of Comparative Economics, 35:136-159. 18. Parasuraman A, Zeithansi VA, Berry LL