International Journal Advances in Social Science and Humanities
Available Online at: www.ijassh.com
RESEARCH ARTICLE
Contract Management and Service Delivery in Local Governments
in Uganda
Robert Agwot Komakech
Faculty of Social Sciences and Management Studies, Kumi University P.O Box 178, Kumi-Uganda (East Africa).
Abstract: The main objective of the study was to examine the relationship between contract management and service delivery in Local Governments in Uganda taking Serere District Local Government as a case study. The study used case study and correlation research design where both qualitative and quantitative approaches were used. Questionnaires and interviews were used to collect data from a sample of 134 respondents of which ninety (90) returned their well filled questionnaires giving a response rate of 67.2%. The findings revealed that there was no significant relationship between contract administration and service delivery (r=0.158, p<0.136). The results also shows a significant relationship between delivery management and service delivery (r=0.532, p<0.000). However, none of the variables were highly inter-related. The researcher concludes that delivery management is more significant in contract management than contract administration accounting for 28.3% variation in service delivery in Uganda Local Governments. The researcher recommends the local government’s political and administrative stakeholders as well as the policy makers in Uganda to have keen attention on main component of contract administration (procurement planning) which is the foundation for effective service delivery in the entity. The study also agitate for the establishment independent Contract Management Department within the Procuring and Disposing Entity (PDE) for easy tracking of the contracts in the entity; need for continuous improvement for every procurement conducted, and the need to eliminate informal structure by enhancing communication between the entity and contractor.
Keywords: Contract Management, Contract Administration, Delivery Management, Service Delivery, Local Governments in Uganda.
Article Received: 26 Dec. 2019 Revised: 18 Jan. 2020 Accepted: 22 Jan. 2020
Introduction
Worldwide, there are no clear
documentations of contract management. The most recent year for which statistics are readily available is 2001 when US federal government reported 11,410,869 contract actions spending over $ 234 billion, [1, 2].
By 2009, the US Federal government public procurements spend had increased from $ 394 in 2005 to $ 555in 2009, showing an increase of 40.9% during the 5 years period [3] an amount that increased during the
Clinton and George W. Bush
Administrations, [4]. Between 2013 and 2014, the US procurement value declined by 4.0% (from $ 466 in 2013 to 447 in 2014) as revealed by [3]. The federal contact spending is likely to continue to fall due to budget caps
reveals that Queensland government departments spend about $10.9 billion annually with non-government suppliers. In 2012, Queensland Audit Office conducted a preliminary survey across government departments to determine the extent of goods and services contracts. The survey found that more than 50, 000 contracts were rolled over through extension and renewals; of which 40 per cent of the contracts rolled over (worth $423 million) had no provision for extension, [5].
The report also shows that ineffective governance of contracts caused contract value leakage of 17 to 40 per cent. The losses from all this disorganization could be substantial. For example, Aberdeen Group, [6] argues that enterprises lose some $153 billion each year due to ineffective contract management. Furthermore, Mugazi 2005 cited by Ntayi, Ngoboa, & Kakooza [7] finds that $107 million is lost annually to corruption in Uganda especially through procurement related practices. Therefore, ineffective contract management can result in lower value for money outcomes over time.
With the 2003 procurement law in place, many studies and reports have shown that procurement and contract management in Uganda still lags behind by institutions to initiate procurements; bidding irregularities; requests for reviews during the procurement process; poor supervision and management of contracts; award of contracts to proven incompetent contractors who are unable to complete work in time; disputes resolutions by courts which are costly and unreliable; and unexplained delays in processing contractors’ payments [8,9,10,11] which further affects programme implementation and makes contractors quote high prices. Muhakanizi & Malta [12] adds that contract management is a most neglected stage in procurement and contractors collude with some dishonest civil servants and claims for partially delivered or non-delivered items.
These could be because of increase procurement budget and complexity of contract management. In Uganda, public procurement remains a strategic function since 55-70% of annual government expenditure is spend on public procurement, [13, 14, 15]. Mbabazi et al [16] assert that Uganda channels about US$ 700 million a year from domestic revenue resources and donor funds through the public procurement
processes. On the sad note the World Bank estimates that 10-15% of this amount (US$100 million) is wasted due to weak
procurement structures, policies and
procedures in which weak contract
management is being highlighted as the main cause of loss. According to Basheka & Kabatereine [17] the authors suggested that the reforms have also created a new set of challenges in service delivery.
The procurement practices have not matched the expectations of many stakeholders in ensuring value for money and timely budget execution. Hence procurement is much focused on procedural compliance and less emphasis is put on performance to achieve value for money [12, 9, 17]. Contributing to the same debate, Sabiti, et al [9] adds that Procuring and Disposing Entities (PDEs) procure items way above the market price or indulge in corruption while adhering to the set procedures. This implies that there is still much work that remains to be done to have well functioning procurement system in Uganda.
Statement of the Problem
Contract management is fundamental to ensure that local governments achieve value for money and realize the project intended benefits. The essential contract management
activities include monitoring supplier
performance throughout the life of the contract, efficient contract administration and timely planning for contract expiry. Oluka, [18] emphasizes that; the importance
of contract management in public
procurement cannot be understated if governments are to achieve their objectives of delivering services effectively and efficiently.
Although there are well documented procedures on contract management in Uganda as stipulated in Public Procurement and Disposal of Public Assets Regulation 2006 (as amended); Serere district is still losing billions of shillings as a result of poor contract management which has cause bottleneck in the service delivery. The Public Procurement and Disposal of Public Assets
Report 2013 and Auditor General
procurements were at high risk due to; poor planning/ failure to procure within the approved plan, delays in payments to suppliers, delays completion of works projects, payment for shoddy work or work not delivered, lack of adequate capacity in the Procurement and Disposal Unit, failure to draft appropriate evaluation criteria, and poor record keeping, failure to appoint contract managers, lack of transparency and accountability [19].
Alinaitwe, [20] contends that lack of regular payments and meetings between client and contractor has contributed to substandard work and contract variation. Contributing to the same debate, Ntayi et al [11] studies which found that millions of dollars get wasted in Uganda due to inefficient and ineffective structures, policies and procedures in which contract management is part of the leakages. This trend is threatening and if the situation does not improve service delivery will remain poor amidst the heavy budget allocation to procurement in Serere district. It is in this regards that, the researcher examined the relationship between contract management and service delivery in Uganda Local Governments with specific reference to Serere District Local Government.
Specific Objectives
The Specific Objectives to the Study were
To establish the relationship between
contract administration and service
delivery in Serere District Local
Governments.
To find out the relationship between delivery management and service delivery in Serere District Local Governments. Hypotheses of the Study
The Following Hypothesis Guided the Study
There is significant positive relationship between contract administration and service delivery in Serere District Local Governments.
There is significant positive relationship between delivery management and service
delivery in Serere District Local
Governments.
Significance of the Study
The government seems not to be sensitive to contract management. Therefore, this study is likely to ignite public debate which will attract the attention of policy makers and donors to address the contract management dimensions so as to improve the quality of goods, services or works done by the state on behalf of the tax payers. The findings of the study will contribute to the body of knowledge on the subject in question since there is little empirical study on contract management and service delivery in Local Governments of Uganda.
In addition, the outcome of the study will be useful to government policy makers, the media, researchers, students, as a bench-mark for future researchers. Furthermore,
the results may help procurement
professionals develop contract management plans to avoid or minimize the problems associated with delivery management,
relationship management and contact
administration.
Conceptual Framework
The Conceptual framework provides
connections and relationships between concepts. It’s like a map to decide a route we are taking and why. Mbogo et al [21] defines conceptual framework as a basic structure of a research consisting of a certain abstract ideas and concepts that a researcher wants to observe, experiment or analyze.
The Independent Variable is Contract Management that has two dimensions that is Contract Administration with key factors like risk monitoring and control, contract
payments, change control and cost
monitoring, skills of personnel, and
management reporting; and Delivery
Management (goods/supplies supplied,
services performed and works carried out as agreed, to the required level of performance and quality).
The Dependent Variable is Service Delivery that has four indicators; Quality, Timeliness, Cost and Value for Money. The researcher therefore conceptualized that there is a
positive relationship between contract
objectives of contact management of
delivering goods, services or works in effective and efficient manner that yields value for money and vice versa.
Literature Review
The main purpose of a literature review was to establish the academic and research areas that are relevant to the subject under investigation. The literature was guided by
the conceptual framework/ research
objectives.
Contract Administration and Service Delivery
Contract administration is very critical in service delivery. Kelman [22] defines contract administration as a set of activities performed by government officials (client’s representatives) after a contract has been awarded to determine how well the government (client) and the contractor perform to meet the requirements of the contract. Ahimbisibwe, et al [23] opined that clear administrative procedures ensure that all parties to the contract understand who does what, when and how. Contract administration encompasses all dealings between the government and the contractor from the time the contract is awarded until the work has been completed and accepted or the contract terminated, payment has been made, and disputes have been resolved. While strategizing to ensure that contract
management successfully takes the right course, all the parties involved must pay keen attention to all provisions in the given or existing contract (Saunders, 2000) as cited by [24].
This study therefore examines how contract administration is conducted in Serere District Local Government and establishes how it relates to service delivery. Oluka, [10] highlights that the process of contract administration includes; conducting a pre-performance conference, risk monitoring and control, managing the contract change control process, measuring and reporting contractors’ performance and conducting the milestone reviews. On the other hand, [22] contends that the focus of contract administration is to obtain supplies and services, of requisite quality, on time, and within budget.
While the legal requirements of the contract are determinative of the proper course of
action of government officials in
Serere District Local Government. Despite the need of contract administration for better service delivery, [20] links poor performance of construction projects in Uganda to lack of regular payments and meetings between client and contractor, hence, contributing highly to substandard projects and variation.
This study concurs with Davison & Sebastian [25] findings which found out that construction contracts experience 45.4% contract delays of the time. This delay requires provision of a performance incentive if a vendor exceeds that performance. Furthermore, [26, 27] on his part blames lack of capacity by the domestic construction industry; overwhelming stakeholder/public expectations; delayed approvals by statutory agencies; and uncoordinated and repetitive audits by the various government agencies.
This study therefore established the major contract administration challenges and how it affects service delivery in the study area. Furthermore, several weaknesses have been
identified in contract administration
practices used by civilian agencies, [22]. The principal problem is that contracting officials often allocate more time to awarding contracts rather than administering existing contracts. This often leads to problems in contractor performance, cost overruns, and delays in receiving goods and services.
Several other deficiencies have been noted such as unclear roles and responsibilities of
the Contracting Officer's Technical
Representatives (COTR), excessive backlog in contract closeout and incurred costs audits, improperly trained officials performing contract oversight, unclear statements of work that hinder contractor performance, and inadequate guidance on voucher processing and contract closeout, [22].
Oluka, [10] suggests that the best practices for contact administration is using an integrated performance evaluation method and establishing a contract change control process and efficient two way communication between both parties.
Delivery Management and Service Delivery
Contract management is the active
monitoring and control of the contract between the procuring and disposing entity and the contractor, to ensure delivery of a cost effective and reliable service at an
agreed standard and price [5]. Contract management is the final stage in the bidding process and marks the beginning of a
contractual relationship between the
procuring and disposing entity and
contractor. According to Muhwezi & Ahimbisibwe, [28] delivery management is relatively more important than relation management and contract management.
Davison & Wright [29] study revealed that delivery management includes checking the nature, quantity and quality of: goods supplied, works carried out and services performed. In delivery management, each contract problem always threaten the success of the project by impacting on any or all of the 5 “R’s” in an adverse manner (such as delivery of incorrect product, incorrect quantity, an increase in project costs, a delay in delivery, poor quality or the ultimate unsuccessful result or contract termination).
In order to establish the relationship between delivery management and service delivery,
there is need to monitor supplier
performance throughout a contract term while ensuring that departments receive the goods and services they purchase, according to the required standard, within the required time frames and achieve value for money, [5, 27]. Jackson, [30] rightly observed that donor agencies, governments, tax payers, partner country governments and citizens all want aid to work as well as it can and agree that limited aid budgets need to be well targeted and managed to achieve greater service delivery.
In addition, Prager (1994) as cited by Oluka & Basheka, [10] agrees that proper and effective management and monitoring of contracts helps improve the quality of goods and services and reduces procurement cost thus achieving quality products and services, timely delivery of products and services, and cost effectiveness. In relation to delivery management, Oluka, [10] states that contracts should be designed to facilitate
desirable procurement outcomes and
Furthermore, Davison & Wright [29] points out that delivery management can also be affected by the Proposal designed. He author adds that the proposal which is the legal document should define the item or service procured (the right item), the mutual areas of agreement, and how risks will be allocated and rewarded. This empirical study will review the contract documents for the study and will examine how the proposal documents are designed.
Summary of the Literature Review The literature review above confirms that different scholars have conducted several studies to establish the correlation between contract management and service delivery. However, a numbers of gaps have been identified as per the literature reviewed which this research will bridge. Most of the studies on the subject are based on developed countries with a well-developed private and public sector yet the proposed study will centre on Uganda.
For the studies conducted in Uganda, the authors were more interested in the critical success factors of contract management, public procurement reforms and procurement planning not on the areas of the variables laid down hence leaving the aspects of contract management. Furthermore, most studies were qualitative and do not guide us on the relationship between the study variables; and the authors focused on
descriptive survey design, exploratory
designs and cross sectional survey design as the main research meaning there was no in-depth investigation of the study variables. This therefore, creates knowledge gap. It is imperative to investigate the two variables contract administration management and delivery management and in relation to
service delivery in Uganda Local
Governments.
Research Methodology
The case study and correlation research design was used because most of the studies conducted on contract management used
descriptive survey design, exploratory
designs and cross sectional survey design; meaning there was no in-depth investigation of the study variables. The two designs were deemed fit for the study based on the fact that the designs provide a systematic
description that is as factual and as accurate as possible [31].
A correlation design enabled the researcher to find out the relationship between the study variables as argued by [32] while case study design enabled the researcher to bring about an understanding of the complex issue and added strength to what was already known through previous research. Blends of quantitative and qualitative approaches were applied to analyze the empirical data.
The population under study was 144 consisting of 01 Accounting Officer/ Principal Assistant Secretary (PAS), 10 Local Council V members, 20 Local Council III members, 10 Heads of Department, 03 Procurement and Disposal Unit staff, 15 Contracts Committee/
Evaluation Committee members, 20
Contractors, 15 Civil Society Organizations (CSOs) representatives and 50 User departments/ beneficiaries.
These respondents were involved in the study because of their mandatory role, experience, and knowledge on contract management and service delivery. Hence, this population enabled the researcher to obtain the necessary data for the study. The study used a sample of 134 respondents drawn from a population of 144 using the Krejcie & Morgan [33] sampling determination framework.
The study sampled 110 respondents using simple random sampling and 24 respondents
using purposive sampling. Both
questionnaires and interviews were used to collect primary data while published and unpublished documents were used to obtain secondary data from the study variables.
A questionnaire was formulated in a structured form using a five Likert itemized rating scale of 1 to 5 with 1- Strongly Disagree (SD), 2- Disagree (D), 3- Neural/ Not sure (N), 4- Agree, and 5- Strongly Agree (5). The scale was used because of its flexibility and can be constructed more easily than other types of attitude scales like semantic differential scale, rating scale, Thurston and Guttmann scale [31].
evaluate the relevance of each item in the instrument to the objectives. Each item was rated on the scale of Relevant (2) and Not Relevant (1). All redundant, ambiguous or
not clear questions were removed from the scale and the Content Validity Index (CVI) was calculated using the formula:
100
(N)
ire
questionna
in the
items
of
number
Total
(K)
relevant
as
rated
items
of
Number
CVI
The instrument yields greater validity of 80.0% higher than the recommended minimum coefficients of 70% or 0.70. Creswell [34] argues that items with validity coefficients to at least 70% are accepted as valid and reliable in research; hence the instrument was suitable for use. Researchers also did pretest of the instrument to 14 non sampled respondents in order to establish consistency in their responses.
The pretested results was analyzed computed using SPSS Ver.20 to determine the Cronbach’s Alpha Reliability Coefficient (CARC) of the 31 items in the instrument. The researchers used 31 items for the two objectives because [35] recommends that for researcher(s) to determine the benchmark of 0.70 acceptable reliability; then the items should be more than 7 in the list and for this study the researchers used a minimum of eight (08) items for the two objectives. From the pretest therefore, the instruments yield a Cronbach’s Alpha Reliability Coefficient (α) of 0.984 or 98.4%.
This is consistent with Nunnally, [36] who argued that reliability should be at least 0.90, preferably 0.95 or better where important decisions is made. For this study therefore, the instruments were very reliable and fit for the study since the widely accepted reliability coefficient is 0.70 or higher for a set of items to be considered a scale in social science. However, during interviews, the researcher rephrased the questions in order to seek consistency in responses from respondents while using English and sometimes Ateso language since most contractors had difficulty in using the official Uganda language. Quantitative data obtained from 90 well filled questionnaires was sorted using descriptive statistics in Statistical Package for Social Scientists (SPSS) Ver.20 so as to identify the missing variable(s), outliers and normality of data prior to the multivariate analysis of the questionnaire data.
After running the descriptive statistics in SPSS, the output was printed for thorough review and the missing values and wrongly entered labels were traced from the original
questionnaires and were filled. The
descriptive statistics used include; mean, and standard deviation.
Pearson correlation coefficient (p) and regression analysis was used to analyze and test hypothesizes (relationship between contract administration and service delivery; and examine the relationship between delivery management and service delivery in Uganda Local Governments). According to Sekaran [33], a correlation study is most appropriate to conduct the study in the natural environment of an organization with minimum interference by the researcher and no manipulation.
While qualitative data obtained through interviews from (01 Principal Assistant Secretary, 06 Heads of User Department, 01 PDU Staff, 03 CSOs representatives, 15 beneficiary members and 05 contractors) was analyzed using thematic analysis and content analysis. The researchers adhered to ethical research ethics. All respondents were briefed on the research purpose and informed consent was sort and respondent’s names were withheld to ensure anonymity and confidentiality.
Results of the Study
The study generated a very good response rate among the expected respondents. Chief Administrative Officers/ Principal Assistant Secretary (PAS) yields 100% response, PDU Staff (100%), User Department/ Beneficiaries (95.5%), Contract/ Evaluation Committee Members (74,4%), Heads of Department
moderate participation because their jobs always depend on schedules and some of them have no operating office. The respondents were drawn from District Headquarters staff, two Town Council (Serere and Kasilo), and the eight sub-counties of Serere district (Kyere, Olio, Atiira, Kateta, Pingire, Labor, Kadungulu and Bugondo sub-county).
Out of the population of 144, the researchers sampled 134 for the study; a total of ninety (90) respondents returned their filled questionnaires giving a response rate of 67.2%. As a result researchers considered the returned instruments good for analysis since they were far above 50%. This return rate is in agreement with Mugenda & Mugenda, [37] who urged that, 50% return rate was adequate for analysis, 60% good and 70% very good.
Background Characteristics of
Respondents
The questionnaire asked respondents
background questions such as; gender, age, marital status, educational level, experience
years and capacity involvement in
procurement and contract activities in Serere District Local Government. Because of suitability of respondents in the study, the following responses were generated: Out of the 90 respondents, 77.8% (70) were male while female were only 22.2% (20). The result shows that male dominate the workforce in the district top and middle level management as well as the business industry as evidenced with the procurement records which shows no single construction firm is headed by female director except in service sector where there were three firms headed by female.
This trend of gender distribution in public entities is now normal in Uganda because of weak enforcement of affirmative action at national and district level. The study also showed that 71 (78.9%) of the respondents were married, 17(18.9%) were single while divorced and widow respondents were 2 (2.2%). Since service delivery affects all categories of the population, knowing the marital status of the respondents was very important since each category has interest in a particular procurement for instance the married couples especially female had more interest in health sector related procurement like the wards, maternity facilities, drugs, beds, placenta pits, washrooms while their
male counterparts were interested in roads, schools while the single especially the youth were more interested at procurement of services for their social events during their celebration days.
This implies that the majority of the respondents were able to evaluate service delivery level at the district, thus giving relevant response. In terms of age, 42 (46.7%) of the respondents were in the age category of 26-35 years, 25 (27.8%) were between 36-45 years, while 18 (20.0%) were above 45 years of age, 4 (4.4%) were below 26 years and 1(1.1%) respondent did not disclose the age variable as shown on Table 4.2.
These implies that, the majority of the procurement and contract management stakeholders were between the ages of 26 to 35 which imply that they are more flexible in shifting from task to task, and are more technologically advanced although they are less experience, self-centered and corrupt as noted by majority respondents hence jeopardizing service delivery at the district; while stakeholders of more than 45 years have more experience, more disposed to routine work and reluctant to question unethical behavior in contract management because of intimidation from colleagues as compared to age group of 36-45 who also operate at self-interest because they want to survive.
The study reveals that 41 (45.6%) respondents had at least Bachelors’ degrees, 22 (24.4%) had Diplomas, 12 (13.3%) had “O”-Level, while 10 (11.1%) had “A”-Level certificate, and 5 (5.6%) had primary level
qualification. This implies that the
researchers used highly educated
respondents which understood the
questionnaires and have greater knowledge in contract management and service delivery; and it’s one of the reasons the researcher was able to generate high response because they understand the value of research.
Since procurement is still in its development stage in Uganda; with Serere district having at least 45.5% stakeholders with over 5 and above years experience in procurement
related activities including contract
management is a good indicator that stakeholders know what to do in contract management.
During the study, the respondents were asked to indicate the capacity of their involvement in contract management; the findings revealed that the majority 42 (46.7%) were involved as end users and they included (Senior Assistant Secretaries, Local Council I leaders, staff from finance department, planning unit, education, community base, natural resources, works and technical services department, teachers, and majority tax payers), 10 (11.1 %) were
involved because of being Contract/
Evaluation Committee members, 9 (10.0%) were contractors, 8 (8.9 %) as LC III Executive/Members, 7 (7.8 %) were involved as Heads of Department and CSO Leader/ Member, while 3(3.3 %) were in the capacity of PDU staff and LC V Executive/ member; and 1 (1.1 %) was involved as Principal Assistant Secretary. This implies that the study considered all key stakeholders at the district and their views enhanced the validity of the results.
Contract Administration and Service Delivery in Serere District Local Government
The first research objective for this study was to establish the relationship between contract administration and service delivery in Serere District Local Government. In order to achieve the study objective, the researcher developed twenty (20) items that were relevant to contract administration and service delivery.
The respondents were requested to give their perceptions on statements which were in a
five Likert scale that is; 1=Strongly Disagree (SD), 2=Disagree (D), 3=Neutral/ Not sure (N), 4=Agree (A) and 5=Strongly Agree (SA). The strongly agree and agree are on the positive side indicating the strength while strongly disagree and disagree are on the negative side indicating the weaknesses in the relationship, and neutral means the respondent(s) could not decide.
The researcher also used descriptive statistics to obtain the percentages, mean and standard deviation so as to evaluate the strength of the items as well as areas of concern that need attention by the stakeholders. The key to Decision Rule were: 0.00-1.49= Poor; 1.50-2.49= Fair; 2.50-3.49= Good; 3.50-4.49= Very Good; and 4.50-5.0= Excellent. The minimum value for the mean on scale of 5 is 1 with 5 as maximum.
The 20 key contract administration
constructs yield the Cronbach’s Alpha Reliability Coefficient of 0.924 or 92.4% which indicates that the instrument was very reliable and good for decision making. Table 1 shows the responses. From Table 1, the results show the means for all 20 items were above average (2.5) on a five Likert scale that was used in the study to obtain respondents
perception on contract administration
variables. The researcher assessed the entity ability to planning, record and administer contract and found the mean score of 3.722 with standard deviation (Sdv.) 0.995 computed on the basis of five Likert scale.
This implies that the entity has the required human resource skills and technical skills needed for planning. The study also revealed from that the entity has effective risk monitoring and control as demonstrated by moderate mean of 3.256 and standard deviation of 1.11. This implies that the level of risk monitoring and control in the entity is not very good and can lead to service delivery failure.
Table 1: Descriptive statistics aboutcontract administration (n=90)
Items that Assessed Contract Administration
Responses in Percentages Mean
(Max=5)
Std. Dev.
Remarks
SD D N A SA
The entity have ability to plan, record, and
administer the contract 4.4 12.2 3.3 66.7 13.3 3.7222 .99468 V. Good The entity has effective risk monitoring and
control 10.0 18.9 10.9 57.8 3.3 3.2556 1.11739 Good The entity measure and reports contractors’
performance 4.4 14.4 7.8 62.2 11.1 3.6111 1.01333 V. Good There is evaluation of the specification against
contractors
There is timeliness of requests for info. by both
parties 7.8 16.7 20.0 42.2 13.3 3.3667 1.14607 Good There is timeliness of submission of claims for
payment by contractors
6.7 10.0 15.6 54.4 13.3 3.5778 1.05976 V. Good
The entity approves contractors request for
extensions 8.9 12.2 10.0 54.4 14.4 3.5333 1.15340 V. Good The entity approves variation of contracts
(scope or value) without revalidation 16.5 25.6 16.7 32.2 8.9 2.9111 1.26885 Good All parties involved in contract pay keen
attention to all provisions in the given or existing contract
6.7 23.3 6.7 45.6 17.8 3.4444 1.21887 Good
There has been termination of contracts by entity
15.6 18.9 21.1 32.2 12.2 3.0667 1.27904 Good
The entity conducts a pre-performance
conference 12.2 12.2 16.7 41.1 17.8 3.4000 1.26135 Good The entity provides clear statements of work or
specifications that enhance contractor performance
3.3 12.2 4.4 51.1 28.9 3.9000 1.06053 V. Good
The entity provides adequate guidance on payment voucher processing and contract
closeout
8.9 12.2 13.3 48.9 16.7 3.5222 1.17299 V. Good
The entity and other advisors have appropriate skills and qualifications to carry out the
contract
8.9 14.4 7.8 48.9 20.0 3.5667 1.21831 V. Good
*There is clear reporting line procurement
parties 4.4 18.9 12.2 36.7 26.7 3.6222 1.19529 V. Good The parties have progress meetings 6.7 16.7 15.6 53.3 7.8 3.3889 1.06733 Good Both parties have mutual trust and
understanding
11.1 9.8 6.7 61.1 12.2 3.5444 1.16273 V. Good
There is planning and budgeting for contracts 2.2 7.8 4.4 56.7 28.9 4.0222 .92381 V. Good There are clear procedures for handover of
contract 10.0 8.9 5.6 51.1 24.4 3.7111 1.22010 V. Good Source: Derived from Primary Data Analysis of Instrument, 2017
Note: * Means 1 Question was not answered by One Respondent
The study also found that the entity measure
and reports contractors’ performance
(Mean=3.611, Sdv. =1.013) to the District Executive Committee (DEC) and the report outcome is given to the used department to take action in case of deviation. One beneficiary reported, “… you can’t monitor yourself! Most of the contracts are taken up by the politicians and civil servants at the district and yet they are the very people budgeting, evaluating, awarding, supervising and paying.
That is why payment certificate is issued to the contractor before completion of work,”
(Beneficiary from Atiira Sub-County,
September, 2017). This unethical conduct affects service delivery and reduces public confidence in contract in the district. This raises a question on who supervises the supervisor. The evaluation of specification
against contract performance and
identification of contract changes/ variations obtained a mean of 3.567 and standard deviation of 1.171 which is very good thought qualitative data shows discontentment from contractors.
One contractor pointed that, “…the entity
provide specifications but when it comes to singing of agreement/ implementation, the contract is renegotiated and deliverables are scaled down at the same contract price,” (Works/ Supplies Contractor, Serere District, September 2017). This implies that the contract price is always overestimated or underestimated by the entity so as to cause variations for the officials to share the difference.
parties while timeliness of submission of claims for payment including the adequacy of supporting evidence by contractors was equally very good (Mean=3.578, Sdv. =1.060) as indicated by the results. Furthermore, the study found that, the entity approves contractors request for extensions of contract time as indicated (Mean=3.533, Sdv. =1.154) by the respondents.
This shows that both the contractor and the entity understand the procurement law which provides for contract extension especially when the cause of the delay is justified for instance factors causing the delay is beyond the contractors’ capacity which include earth quakes, floods, and economic crisis. The researcher also thought to establish from the respondents on whether the entity approves variation of contracts (scope or value) without revalidation.
The findings show a mean of 2.911, with standard deviation of 1.269 implying the variations are approved without following the formal procedures of double checking the contractor’s claim which is an indication that the supervisor has a take from variation. According to one of the Key Informants during an interview, the officer acknowledged
the gap by saying; “Procurement is a
learning process and kept changing with time and environment which requires a lot of updating,” (Principal Assistant Secretary, Serere District, September 2017).
By implication it means either there is knowledge and skills gaps in procurement in the entity or its intentional and the gap in the guideline is used to make contractor raise variations for instance the construction of District Administration block contract was initially awarded at about 350 million but more than two variations was raised making the building price to reach over 900 million and the explanation for the increase of cost was that the toilet and water flow was not included in the Accounting Officers’ side.
Hence, these omissions escalated the procurement price to over 157% variations in price leading to a financial loss to the government and tax payers. On whether all parties involved in contract pay keen attention to all provisions in the given or existing contract. The results shows good
indication (Mean=3.444, Sdv.=1.219)
implying each party concentrate in its own section for instance the contractor is
interested in the Bills of Quantities (BOQ) or specifications, the relevant documents, and the areas to be filled while the entity is also interested in filling its address, procurement subject, bid validity period and scope of work or specification while other section of the contract like general condition to contract and terms of contract is just copy and paste since it’s a standard document without review.
Respondents further agreed (Mean=3.067, Sdv. =1.279) that there has been termination of contract due to misunderstanding or misinterpretation of contract between the entity and the contractor. The cause of termination for all the cited contracts were
justifiable because the entity gave
contractor(s) an extension which all failed to comply because they had no financial resources to complete the work as agreed in the contract. Hence the cause for termination was for convenience so as to achieve value for money though value for money was not realized since all the contractors had received part payment of more than what was done causing a financial loss to the entity of over 85 million Uganda shillings.
The mean of 3.400 and standard deviation of 1.261 confirms that the entity conducts a pre-performance conference with contractors. This implies that the entity provides feedback to bidders so that they can make improvement for future procurements. The PDU staff echoed that; “the pre-performance conference is to show the stakeholders the level of transparency in the procurement process so that the public have greater confidence in the fairness of that process1”.
This view was supported by the contractor who adds that “the meeting is called by the PDU with the intension of communicating their expectations, giving clarifications regarding the work schedule and communication lines. However, after bidding the entity does not call contractors for any debriefing meeting unless an individual raise complain”, (PDU Staff Serere District,
September 20171; Contractor from Serere
Town Council, September 20172). This shows
project to high risk thus service delivery failure. This finding is supported by the subsequent question on whether the entity provides clear statements of work or
specifications that enhance contractor
performance as reflected with the mean score of 3.900 and standard deviation of 1.060.
The result shows that the entity provides specifications but when it comes to actual implementations there is alteration of the works and the major reason given is inadequate finance to complete the work. From the findings, majority respondents (Mean=3.522, Sdv. =1.173) agreed that the entity provides adequate guidance on payment voucher processing and contract closeout. All categories of respondents supported that statement and argued that the purpose is to avoid delayed payments after deliveries of works, services and goods.
On whether the entity/ Contract managers and other advisors have appropriate skills and qualifications to carry out the contract management activities the majority of respondents (Mean=3.567, Sdv=1.218) agreed while 23.3% disagreed. This implies that knowledge and contract management skills is still lacking especially among the end users. The study also found that the entity has clear reporting line between the contractor, user department and PDU as supported by mean of 3.622 and standard deviation of 1.195.
This is an indication there is well established structure in the entity and incase of conflict, the process of reporting is well defined within the system. Furthermore, the researchers also found whether the parties have progress meetings. The results (Mean=3.3889, Sdv. =1.067) shows that there is meeting between the parties but not regular. According to the interviewed contractors, they had this to say; “… we don’t meet regularly! The meeting we always have is during the bidding period but after signing the contract we only meet when there is conflict regarding the deliverables where the district political team and technical staff only comes to mediate in the conflict,” (Serere District Contractors, September 2017). This implies that there are no planned meetings and platform for feedback between the entity and the contractor which is the result of non-compliance to service delivery standards in the district. It was also revealed that (Mean=3.544, Sdv. =1.163) both parties have mutual trust and understanding during contract.
This is a very good conduct and shows the reason why the entity does not conduct due-diligence about its contractors for works and supplies. Planning and budgeting for contracts obtain 4.022 means with standard deviation of 0.924.
This is an indication that the entity has procurement plans and budget for the procurement of goods, services and works as supported by the respondents. This is a very good indicator of contract administration where stake holders know what to be procured, when, and how much hence making coordination of the procurement activities easy since gives time for the PDU to integrate the procurement budget hence the needs of the entity is met in an efficient, cost effective and timely manner. Although the entity has procurement plan and budget, section of respondents echoed that the plan and budget is on paper.
In an interview with one of the Senior Assistant Secretary in the traditional sub-county, he had this to say; “The procurement planning and budgeting is done right away from the grass root (village) to parish then sub-county and district respectively. But when it comes to implementation you discover that what is planed is being left out or pushed to the next financial year.
On probing why? He added that all this is done because of political interest since the elected leaders have made so many promises which were out of planed and as a results resources are first channeled in one direction for instance all roads equipment have been taken to Kasilo county for the last four months and yet Serere county roads also need maintenance,” (Senior Assistant Secretary in Serere Dstrict, September 2017).
Contributing to the same debate, one Head of
Department adds; quite often the
This conduct affects service delivery because it derails the resources from the sector and the project is likely to take longer period for completion since the source of funding is not clear and majority stakeholders were not equally involved. Finally, the researchers found the entity has clear procedures for handover from contract award to contract management (Mean=3.711, Sdv. =1.220). This shows that after the contract signing, stakeholders are informed of the launch/ commissioning and advice on how they can access contract, establishing who will be in charge of handling queries from contractors
and internal customers. The above results
therefore show 20 items Local Governments in Uganda especially Serere district need to
pay more attention in order to have successful implementation of contract to
achieve high service delivery hence
improving on the tax payer’s socio-economic welfare.
Testing Hypothesis 1: There is
Significant Positive Relationship
between Contract Administration and Service Delivery
In order to determine the direction and strength of the relationship between contract administration and service delivery in Serere District Local Government, the researcher used SPSS Ver. 20 to test the relationship using Pearson Correlation coefficient as shown in Table 2.
Table 2: Correlation between Contract Administration and service delivery
Contract Administration Service Delivery
Contract Administration
Pearson Correlation 1 .158**
Sig. (2-tailed) .136
N 90 90
Service Delivery
Pearson Correlation .158** 1
Sig. (2-tailed) .136
N 90 90
**. Correlation is significant at the 0.01 level (2-tailed)
The correlation analysis shows weak positive insignificant relationship between contract administration and service delivery (r
=0.158**, p=0.136). The significance value (p
= 0.136) was more than the critical p value of 0.01 hence the null hypothesis was rejected since the research results show no significant positive relationship between contract administration and service delivery. This implies that contract administration and service delivery (variables) are independent, which makes it possible to have all combinations of low/ high levels of contract
administration and service delivery in Serere District Local Government.
Regression Analysis on Contract
Administration and Service Delivery Since correlation analysis reveals weak positive insignificant relationship between contract administration and service delivery in SDLG, the research found it worth to conduct regression analysis so as to determine the magnitude of effect contract administration has on service delivery. The Model summary and Analysis of Variance (ANOVA) results are presented in below.
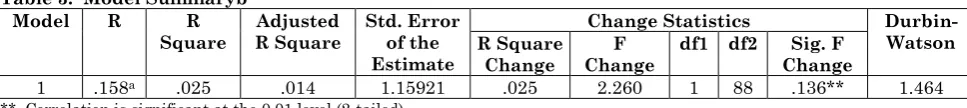
Table 3: Model Summaryb
Model R R
Square R Square Adjusted Std. Error of the
Estimate
Change Statistics
Durbin-Watson R Square
Change Change F df1 df2 Change Sig. F
1 .158a .025 .014 1.15921 .025 2.260 1 88 .136** 1.464 **. Correlation is significant at the 0.01 level (2-tailed).
Predictors: (Constant), Contract Administration
Dependent Variable: Service Delivery
The regression analysis shows correlation coefficient of determination (R2) to be 0.025
and adjusted R2 of 0.14. This implies that
contract administration explain only 2.5% of variation in service delivery in SDLG while the remaining 97.5% variations are caused by other factors such as corruption, influence peddling, low levels of productivity, and poor capacity of local contractors as revealed by
Table 4: Analysis of Variance (ANOVAa)
Model Sum of Squares df Mean Square F Sig.
1
Regression 3.037 1 3.037 2.260 .136b
Residual 118.252 88 1.344
Total 121.289 89
Dependent Variable: Service Delivery
Predictors: (Constant), Contract Administration
The overall goodness of fit of the model had F value of 2.260 with p greater than the critical p <0.01 meaning there was no significant relationship between contract administration
and service delivery. This indicates that the model is not a good predictor of service delivery in Uganda especially in Serere district.
Table 5: Regression Analysis
Model Unstandardized
Coefficients
Standardized Coefficients
t Sig. 95.0% Confidence
Interval for B
B Std.
Error Beta Bound Lower Upper Bound
1 (Constant) 2.333 .517 4.508 .000 1.305 3.361
Contract Administration .193 .129 .158 1.503 .136 -.062 .449
**Correlation is significant at the 0.01 level (2-tailed).
The standardized beta coefficient was found to be 0.158 and the p value was greater than the critical p<0.01. This indicates that there was no significant difference between contract administration and service delivery in SDLG. Hence, Hypothesis 1 was rejected
which states that “There is Significant
Positive Relationship between Contract Administration and Service Delivery”. The 95% confidence interval for the difference between the two means (-0.062 or 0.449) with calculated t-value 4.508 above F (2.260) which confirms that contract administration was not significant in explaining service delivery in Local Governments (LGs) in Uganda especially SDLG.
Delivery Management and Service Delivery in Serere District Local Government
The study was to find out the relationship between delivery management and service delivery in Serere District Local Government. In order to answer the research question, respondents were requested to answer eight
(8) statements related to delivery
management and service delivery in Serere District Local Government (SDLG). Their perceptions were captured in a five-point Likert scale that is; 1=Strongly Disagree (SD), 2=Disagree (D), 3=Neutral/ Not sure (N), 4=Agree (A) and 5=Strongly Agree (SA) so as to gauge their opinion regarding the study variables. The eight (8) items yielded Cronbach’s Alpha Reliability Coefficient of 0.947 or 94.7% implying the tool used was very reliable and is appropriate for taking decision.
The researcher used descriptive statistics to obtain the percentages, mean and standard deviation so as to evaluate the strength of the items as well as areas of concern that need attention by the stakeholders. The key to Decision Rule are: 0.00-1.49= Poor; 1.50-2.49= Fair; 2.50-3.49= Good; 3.50-4.49= Very Good; and 4.50-5.0= Excellent. The minimum value for the mean on scale of 5 is 1 while 5 is the maximum. Table 6 shows the descriptive statistics about delivery management in SDLG.
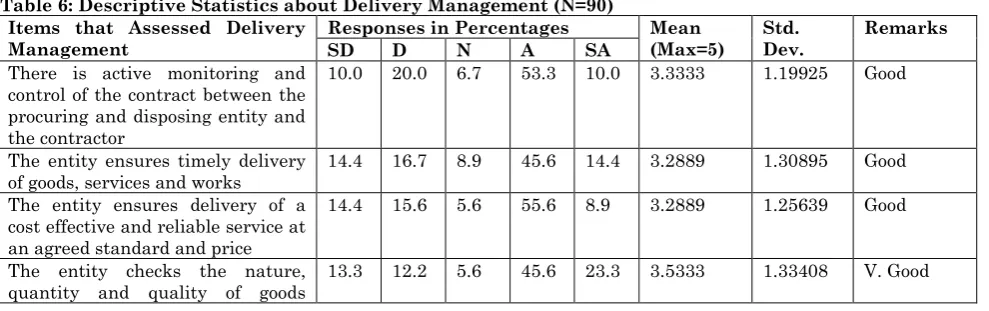
Table 6: Descriptive Statistics about Delivery Management (N=90) Items that Assessed Delivery
Management Responses in Percentages SD D N A SA Mean (Max=5) Std. Dev. Remarks
There is active monitoring and control of the contract between the procuring and disposing entity and the contractor
10.0 20.0 6.7 53.3 10.0 3.3333 1.19925 Good
The entity ensures timely delivery
of goods, services and works 14.4 16.7 8.9 45.6 14.4 3.2889 1.30895 Good The entity ensures delivery of a
cost effective and reliable service at an agreed standard and price
14.4 15.6 5.6 55.6 8.9 3.2889 1.25639 Good
The entity checks the nature,
supplied out by contractors
The entity checks the nature, quantity and quality of works carried by contractors
12.2 11.1 7.8 43.3 25.6 3.5889 1.31452 V. Good
The entity checks the nature, quantity and quality of services performed by contractors
15.6 12.2 6.7 44.4 21.1 3.4333 1.36612 Good
The entity monitors contractor performance throughout a contract term
7.8 20.0 7.0 42.2 22.2 3.5111 1.25639 V. Good
The user departments/ beneficiaries are satisfied with goods, services and works provided by the contractors
15.6 28.9 12.2 35.6 7.8 2.9111 1.25997 Good
Source: Derived from Primary Data Analysis of Instrument
The researcher analyzed respondents
perceptions using the five Likert scale on the major 8 items of delivery management in and
found that (Mean=3.333, Sdv.=1.200)
indicating there is active monitoring and control of the contract between the procuring and disposing entity and the contractor though not very good. On whether the entity ensures timely delivery of goods, services and works, the study found the Mean of 3.289 and standard deviation of 1.309 implying the goods are delivered but not at the right time as planed leading to delay in service delivery.
Contributing to the same debate, one Head of User Department says, “Most of the end users are taken by surprise when it comes to the delivery of goods, supplies or works especially classroom blocks. As a result they don’t know whether procurement has taken long or not but what they are interested at is the quality of what is being delivered and not even the contractor because they feel that the procurement was delivered to them by chance,” (Head of User Department in Serere District, September 2017).
On finding out if the entity ensures delivery of a cost effective and reliable service at an agreed standard and price, the findings reveals (Mean=3.289, Sdv. =1.256) which shows good level of service delivery. While (Mean=3.533, Sdv. =1.334) results was revealed on whether the entity checks the nature, quantity and quality of goods supplied out by contractors; (Mean=3.589, Sdv. =1.314) for the nature, quantity and quality of works carried by contractors; and (Mean=3.433, Sdv. =1.366) for the nature, quantity and quality of services performed by contractors. All this shows a good level of compliance though a number of end users lamented that; “The checking is done and when they are not satisfied with what is
delivered they always reject but after few days politicians would force them to accept the deliveries with a promise that they will get back to the service provider,” (Beneficiary in
Olio Sub-county, September, 2017).
Contributing to the same debate, one
Representative from Civil Society
Organization explains that, “the local communities know what they want only that they are divided for instance when the elite group tells them to reject wrong deliverable one group will turn and say it’s because you are doing well but for us we need it. Hence they look what is delivered as a favour and politicians also intimidate them because they are they are the contractors so they want to protect each other,” (CSO Representative in Olio Town Council, September 2017).
This justify why there is increase in air supply in the district as in the case of lap top supplies which was delivered but returned at night, shoddy works like roads, classrooms and poor craftsmanship in desks. The finding also indicates that entity monitors contractor performance throughout a contract term (Mean=3.511, Sdv. =1.256) which is very good and its evidenced by the existing records which shows joint monitoring of projects by the Executives, user department, security organ like Office of the Residential District Commissioner (RDC) though there is still air supply, shoddy works and poor service delivery at the district.
areas without Citizen Parliament involvement in monitoring. Researcher also confirms that the user departments/ beneficiaries are not satisfied with goods, services and works provided by the contractors as represented by 2.911 mean with standard deviation of 1.260. This implies that the service delivery at the district is average and if attention is not put in delivery management then the tax payers will continue to pay for what they have not consumed.
Testing Hypothesis 2: There is
Significant Positive relationship
between Delivery Management and Service Delivery in Serere District Local Government
In order to determine the direction and strength of relationship between delivery management and service delivery in Serere District Local Government, the researcher used Pearson Correlation coefficient and the result is presented in Table 7.
Table 7: Correlations between delivery management and service delivery
Service Delivery Delivery Management
Service Delivery
Pearson Correlation 1 .532**
Sig. (2-tailed) .000
N 90 90
Delivery Management
Pearson Correlation .532** 1
Sig. (2-tailed) .000
N 90 90
**.Correlation is significant at the 0.01 level (2-tailed).
From the correlation analysis it was revealed that there is a significant positive relationship between delivery management and service delivery. This is evidenced by the obtained Pearson correlation coefficient (r) of 0.532 with a significance p-value of 0.000. The result also indicates a strong positive relationship between the variables.
Therefore, the significance value (p = 0.000) was less than the critical p value of 0.01 hence hypothesis 2 was accepted which states
that “there is a significant positive
relationship between delivery management and service delivery” as claimed by the researcher. The researcher further conducted
regression analysis to establish the cause and effect relationship between the two variables using SPSS Ver. 20.
Regression Analysis on Contract
Administration and Service Delivery Since correlation analysis reveals strong positive significant relationship between delivery management and service delivery in SDLG, the research found it worth to conduct regression analysis so as to determine the influence of independent variable (delivery management) has on dependent variable (service delivery). The Model summary and Analysis of Variance (ANOVA) results are presented Table 8.
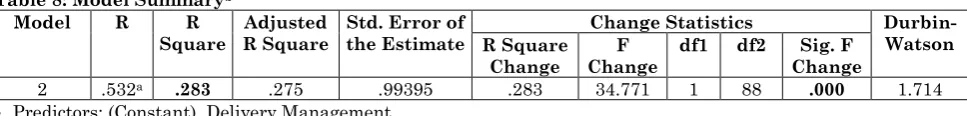
Table 8: Model Summaryb
Model R R
Square R Square Adjusted the Estimate Std. Error of R Square Change Statistics Durbin-Watson
Change Change F df1 df2 Change Sig. F
2 .532a .283 .275 .99395 .283 34.771 1 88 .000 1.714
Predictors: (Constant), Delivery Management
Dependent Variable: Service Delivery
Results in Table 8 indicate that the amount by which a change in delivery management leads to a change in service delivery is 0.283
(R2=0.283). Hence, delivery management
affects service delivery by 28.3% while the remaining 71.7% variation is caused by other factors such as delayed approvals by the relevant stakeholders like the Solicitor General, administrative review, delayed
submission of the procurement requests by the user department, bad weather in case of construction, low technical capacity on mandated service deliver, and delayed
release of funds for the intended
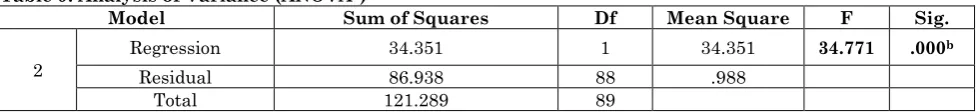
Table 9: Analysis of Variance (ANOVAa)
Model Sum of Squares Df Mean Square F Sig.
2
Regression 34.351 1 34.351 34.771 .000b
Residual 86.938 88 .988
Total 121.289 89
Predictors: (Constant), Delivery Management
Dependent Variable: Service Delivery
From the Table above, the overall fit of the model is good. Statistically, the model is very significant with F value of 34.771 and p=0.000 which is less than p<0.01. This explains 28.3% variance in service delivery. The results in Table 10 show that the standardized Beta coefficient is more than 0.05 and tends towards the absolute value of +1 (strong positive correlation) implies that as delivery management increases, so does service delivery. Thus the set Hypothesis 2
was accepted which states that “there is
significant positive relationship between delivery management and service delivery” because p value is less than the critical p< 0.01. The 95% confidence interval for the difference between the two means (0.358 or 0.721) which implies that the results is true,
correct and accurate because many
stakeholders are only mindful about the quality and quantity delivery but not price and the process involved in the acquisition as revealed by the respondents.
Table 10: Regression Analysis (Coefficienta)
Model 2 Unstandardized Coefficients Standardized Coefficients T Sig. 95.0% Confidence Interval for B
B Std.
Error
Beta Lower
Bound
Upper Bound
2 (Constant) Delivery 1.111 .351 3.160 .002 .412 1.809 Management .540 .092 .532 5.897 .000 .358 .721
Dependent Variable
Service Delivery
Discussion of Findings
The results for the study were done objective by objective
Contract Administration and Service Delivery in Serere District Local Government
In establishing the relationship between contract administration and service delivery in Serere District Local Government, it was found that there was no significant positive relationship between contract administration and service delivery as confirmed by the correlation coefficient of 0.158 with a significant value (p) of 0.136 was obtained.
This implies that contract administration
and service delivery (variables) are
independent, which makes it possible to have all combinations of low/ high levels of contract administration and service delivery in Serere District Local Government. This findings form a firm foundation for further scholarly work since the existing literature shows that, there was no study being done on
establishing the relationship between
contract administration and service delivery. The findings reveal planning and budgeting for contracts as the most important aspect of contract administration. This is an indication that the entity has procurement plans and budget for the procurement of goods, services and works.
Basheka, [38] contends that without adequate attention to planning government procurements, the respective procuring
agencies will only be left with ad hoc
procurement systems, which cannot in most cases, translate into value for money. Kiage
[27] adds that planning influence
procurement performance and guides in
prioritizing and procurement making
decisions. According to [22] the focus of contract administration is to obtain supplies and services, of requisite quality, on time, and within budget.