CORROSION INHIBITION BY TRISODIUM CITRATE (TSC –
Zn
2+SYSTEM)
B. Shyamala Devi
[a]and
S. Rajendran
[b,c]Keywords: Corrosion inhibition, Carbon steel; Trisodium citrate; Synergistic effect
The inhibition efficiency (IE) of various concentrations of a TSC- Zn2+ system in controlling corrosion of mild steel immersed in well water
was evaluated by a weight-loss study. The formulation consisting of 50 ppm of TSC and 25 ppm of Zn2+ showed 70% inhibition efficiency.
A synergistic effect was noticed between trisodium citrate - Zn2+ system. In the presence of Zn2+ TSC has excellent inhibition efficiency.
Polarization studies reveal that TSC - Zn2+ function as a mixed inhibitor. AC impedance spectra suggest that a protective film is formed on
the metal surface. FTIR spectra reveal that the protective film consists of Fe2+ - TSC complex and Zn(OH)
2. SEM micrographs and AFM
reveals that a protective film is formed on the metal surface
* Corresponding Authors
E-Mail: [email protected]
[a] Department of Chemistry, Vivekanandha Institute of Engineering and Technology for Women, Tiruchengodu, Tamil Nadu, India
[b] Corrosion Research Centre, Post Graduate and Research Department of Chemistry, GTN Arts College, Dindigul-624 005, India
[c] Department of Chemistry, RVS School of Engineering and Technology, Dindigul, India
1. INTRODUCTION
Water soluble carboxylic acids have been used as corrosion inhibitor. Much investigation suggests that corrosion inhibitors based on carboxylic acids remain a fruitful field of investigation.1-30
The ability of carboxylic acids to inhibit corrosion in automotive cooling systems was first reported more than 50 years ago. Aromatic carboxylic acids, such as benzoic acid and its derivatives, have been extensively studied and are used in Europe as corrosion inhibitors in commercials coolants. There are few studies of corrosion inhibition by aliphatic carboxylic acids in the open literature. In carboxylic acids the carboxyl groups form strong chemical bonds with Fe2+ which, it is suggested,
compete successfully with Cl- as a complexing agent for
iron. It is suggested that the resulting carboxylate complex with iron is itself electrically neutral; it remains in the vicinity of the anode, thus interrupting the cycle of oxidation of Fe to Fe2+, its complexation, transportation
and further oxidation, to insoluble Fe3+ with release and
recycling of the chloride.
The present work investigated the inhibition efficiency of TSC and Zn2+ on the inhibition efficiency of trisodium
citrate-Zn2+system in controlling corrosion of carbon steel
(CS) immersed in well water. Potentio-dynamic polarization study and alternating current (AC) impedance spectra have been used. FTIR spectra reveal that the protective film consists of Fe2+ -TSC and
Zn(OH)2. SEM micrographs and AFM reveals that a
protective film is formed on the metal surface.
2. EXPERIMENTAL
2.1.Weight loss method
The weighed specimen, in triplicate were suspended by means of glass hooks in 100 ml beakers containing 100 ml of well water containing various concentrations of the inhibitor in the presence and absence of Zn2+ for 3 days of
immersion. After 3 days of immersion the specimens were taken out, washed in running water, dried and weighed. From the change in weights of the specimen, corrosion rates were calculated using the following relationship.
* corr
m R
S t
(1)
where
Rcorr – corrosion rate, mg dm-2 d-1
m – loss in weight (mg) S – surface area of specimen, dm2
t – period of immersion, day
Corrosion inhibition efficiency (IE) was then calculated using the equation
(2)
where
W1 - corrosion rate in the absence of the inhibitor,
W2 - corrosion rate in the presence of the inhibitor
2.2. Potentiodynamic polarization study
This study was carried out in an H and CH electrochemical work station impedance analyzer model CHI 660. A three-electrode cell assemble was used. The working electrode was carbon steel with one face of the electrode of constant l cm2 area exposed and the rest
being shielded with red lacquer. A saturated calomel 2
1 100 * 1 W IE
W
electrode (SCE) was used as reference electrode. A rectangular platinum, foil was used as the counter electrode. The area of the counter electrode was much larger compared to the area of the working electrode. This can exert a uniform potential field on the working electrode and minimized the polarization effect on the counter electrode. The results such as Tafel slopes, Icorr
and Ecorr values were calculated.
The working electrode and platinum electrode were immersed in well water in the absence and presence of inhibitor. Saturated calomel electrode was connected with the test solution through a salt bridge. Potential (E) vs log current (I) plots were then recorded. Corrosion potential (Ecorr) and Tafel slopes ba and bc were
determined from E vs log I plots. Tangents were drawn on the cathodic and anodic polarization curves. From the point of intersection of the two tangents Icorr and Ecorr
were calculated
2.3. AC impedance measurements
H and CH electrochemical work station impedance analyzer model CHI 660 was used to record AC impedance measurements. The cell setup was the same as that used for polarization measurements. The real part (z’) and imaginary part (z’’) of the cell impedance were measured in ohms for various frequencies. The Rt
(charge transfer resistance) and Cdl (double layer
capacitance) values were calculated.
2.4. Surface characterization studies
The carbon steel specimens were immersed in blank, as well as inhibitor solutions, for a period of one day. After 1 day, the specimens were taken out and dried. The nature of the film formed on the surface of the metal specimens was analyzed by various surface analysis techniques.
2.4.1. FTIR spectra
These spectra were recorded in a Perkin – Elmer 1600 spectrophotometer. The film was carefully removed, mixed thoroughly with KBr and made into pellets and the FTIR spectra were recorded. After the immersion period of 1 day in various environments, the specimens were taken out of the test solutions and dried. The film formed on the surface was scratched carefully and it was thoroughly mixed so as to make it uniform throughout. FTIR spectrum of the powder (KBr pellet) was recorded using Perkin – Elmer 1600 FTIR spectrophotometer with a resolving power of 4 cm-1
2.4.2. Scanning Electron Microscopic studies (SEM)
The carbon steel specimen immersed in blank and in the inhibitor solution for a period of one day was removed, rinsed with double distilled water, dried and observed in a scanning electron microscope to examine the surface morphology. The surface morphology measurements of the carbon steel were examined using Hitachi S-3000 H computer controlled scanning electron microscope.
2.4.3. Atomic Force Microscopy characterization (AFM) The carbon steel specimen immersed in blank and in the inhibitor solution for a period of one day was removed, rinsed with double distilled water, dried and subjected to the surface examination. The surface morphology measurements of the carbon steel surface were carried by atomic force microscopy (AFM) using PicoSPM 2100 with the software version of Picoscan version 5.4.
2.5. Determination of biocidal efficiency of the system
The inhibitor formulation that offered the best corrosion inhibition efficiency with the biocide Sodium dodecyl sulphate (SDS) and N-cetyl-N,N,N-trimethyl ammonium bromide (CTAB) was selected. The biocidal efficiency of SDS and CTAB on the inhibitor system was determined. Various concentrations of CTAB and SDS namely 50 ppm, 100 ppm, 150 ppm, 200 ppm and 250 ppm were added to the formulation consisting of the inhibitor system. Polished and degreased carbon steel specimens in triplicate were immersed in these environments for a period of three days. After three days one ml each of test solutions from the environments was pipetted out into sterile Petri dishes containing about 20 ml of the sterilized zobell medium kept in a sterilized environment inside the laminar flow system fabricated and supplied by CECRI – Pilani. The Petri dishes were then kept for 48 hours. The total viable heterotropic bacterial colonies were counted using a bacterial colony counter.
3. RESULTS AND DISCUSSION
3.1. Weight loss method
The corrosion rates (CR) of carbon steel immersed in well water and also inhibition efficiencies (IE) in the absence and presence of inhibitor trisodium citrate (TSC) and Zn2+ obtained by weight loss method are given in
Tables 1 to 3.
It is observed from Table 1 that TSC shows some inhibition efficiencies. 50 ppm of TSC has 22% inhibition efficiency. As the concentration of TSC increases the inhibition efficiency increases. 250 ppm of TSC shows 50 % IE.
Table 1. Corrosion rates of (CR mdd) carbon steel immersed in well water, and inhibition efficiencies (IE%) obtained by weight loss method
Immersion period = 3 days
TSC, ppm Zn2+, ppm CRmdd IE, %
0 0 23.64 -
50 0 18.44 22
100 0 16.07 32
150 0 14.18 40
200 0 12.29 48
3.2. Influence of Zn2+ on the inhibition efficiency of TSC
The influence of Zn2+on the inhibition efficiency of
TSC is given in Tables 2 and 3. It is observed that when Zn2+ is added, the inhibition efficiency of TSC increases.
The increase in IE is more pronounced at 50 ppm of Zn2+
than at lower concentrations of Zn2+, ie at 25 ppm. It is
observed that a synergistic effect exists between TSC and Zn2+ . For example, 25 ppm of Zn2+ has 15% IE. 250
ppm of TSC has 50% IE. Interestingly their combination has 90% IE. This suggests that a synergistic effect exists between TSC and Zn2+.
Table 2 : Corrosion rates of (CR mdd) carbon steel immersed in well water, and inhibition efficiencies (IE%) obtained by weight loss method
Immersion period = 3 days
Table 3 : Corrosion rates of (CR mdd) carbon steel immersed in well water, and inhibitionefficiencies (IE%) obtained by weight loss method
Immersion period = 3 days
3.3. Influence of Immersion period on IE of TSC-Zn2+system
The influence of immersion period on IE of TSC - Zn2+system is given in Tabe. 4. It is observed as the
period of immersion increases (1,3,5,7,9 days) the IE% decreases. This is due to the fact as the immersion period increases the protective film is ruptured by the cl- ,
present in the solution.
3.4. Analysis of results of potentiodynamic plorization study
Polarization study has been used to study the formation of protective film on the metal surface. The potentiodynamic polarization curves of carbon steel immersed in well water in the absence and presence of inhibitors are shown in Fig 1.
The corrosion parameters namely corrosion potential (Ecorr) Tafel slopes, bc and ba, linear polarization
resistance (LPR) and corrosion parameter (Icorr) are given
in Table 5. It is observed (Fig .1a) that when carbon steel
immersed in well water, the corrosion potential is - 701 mV vs SCE (saturated Calomel Electrode). The LPR value is 3.742 x 10⁴ohm cm2. The corrosion current value
is 1.219 x 10 -6 A/cm2.
Figure 1. Polarization curves of mild steel immersed in various test – solutions. a - well water; b - TSC (50 ppm) + Zn2+ (25
ppm)
When 50 ppm of TSC and 25 ppm of Zn2+ are added to
the above environment the corrosion potential is shifted to the anodic side (-706 mV vs SCE) (Fig .1.b). However this shift is very small. Further, the Tafel slopes are almost equal. Hence TSC- Zn2+ system functions as a
mixed inhibitor. It is observed from Table 5. that the LPR value increases and the corrosion current value decreases. These observations suggest the formation of a protective film on the metal surface. This prevents the corrosion of metal.
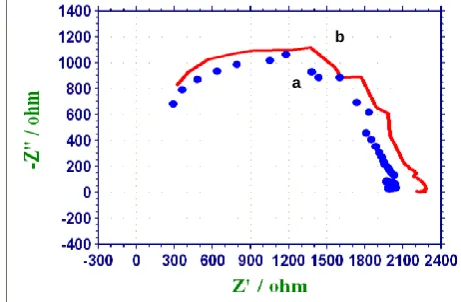
3.5. Analysis of AC impedance spectra
AC impedance spectra of carbon steel immersed in well water in the absence and presence of inhibitors are showm in Fig .2 (Nyquist plots) and Fig .3 (Bode plots).
Figure 2. Ac impedance spectra of carbon steel immersed in various test solutions (Nyquist plot): a- well water; b- well water + TSC (50 ppm) + Zn2+ (25ppm)
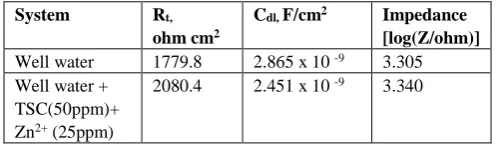
The corrosion parameters namely charge transfer resistance (Rt) and double layer capacitance (Cdl) derived
from Nyquist plots are given in Table 6. The impedance, log (Z/ohm) values derived from Bode plots are also give in Table 6. It is observed that when carbon steel immersed in well water the Rt value is 1779.8 ohm cm2.
The Cdl value is 2.865 x 10 -8 F/cm2 . The impedance
value [log (Z/ohm)] is 3.305. TSC
ppm
Zn2+
ppm
CR mdd
IE %
0 50 22.46 5
50 50 6.38 73
100 50 4.73 80
150 50 3.55 85
200 50 2.36 90
250 50 1. 1895
SC ppm
Zn2+
ppm
CR mdd
IE %
0 25 20.09 15
50 25 7.09 70
100 25 4.96 79
150 25 4.73 80
200 25 4.02 83
250 25 2.36 90
a b
Table 4 : Influence of immersion period on TSC - Zn2+system
Table 5: Corrosion parameters of carbon steel immersed in well water, obtained frompotentiodynamic polarization study
System Ecorr, mV vs
SCE
ba, mV/decade bc, mV/decade LPR, Ohm cm2 Icorr, A/ cm2
Well water -701 249 181 3.742 x 10⁴ 1.219 x 10 -6
Well water+TSC (50ppm)+ Zn2+
(25ppm)
-706 250 201 6.063 x 10⁴ 7.985 x 10 -7
When inhibitors (50ppm of TSC + 25ppm of Zn2+ ) are
added the Rt values increases from 1779.8 to 2080.4 ohm
cm2. The C
dl value decreases from 2.865 x 10 -9 to 2.451
x 10 -9 F/cm2. The impedence value increases from
3.305 to3.340. These observation suggest that a protective film is formed on the metal surface.
Figure 3.i: Ac impedance spectra of carbon steel immersed in various test solutions (Bode plot impedance ) a - well water (blank); (b) well water + TSC (50ppm)+Zn2+ (25ppm)
Figure 3.ii: Ac impedance spectra of carbon steel immersed in various test solutions (Bode plot-phase) (a) - well water (Blank) (b) -well water +TSC (50ppm)+Zn2+ (25ppm)
Table 6. Corrosion parameters of carbon steel immersed in well water obtained form AC impedance spectra
System Rt,
ohm cm2
Cdl, F/cm2 Impedance
[log(Z/ohm)] Well water 1779.8 2.865 x 10 -9 3.305
Well water + TSC(50ppm)+ Zn2+ (25ppm)
2080.4 2.451 x 10 -9 3.340
3.6. Analysis of FTIR spectrum
The structure of trisodium citrate (TSC, C6H5Na3O7,
Mw=258.06) is shown in scheme 1:
FTIR spectrum of pure TSC is shown in Fig.4.a.The C=O stretching frequency occurs at 1599 cm-1. The FTIR
spectrum of the film scratched from the surface of the metal immersed in well water 50 ppm of TSC and 25 ppm of Zn2+ is given in Fig. 4 b . It is seen from the spectrum
that the C=O stretching frequency of TSC in the free state has shifted from 1599cm-1 to 1590 cm-1. This shift
indicates that the carbonyl oxygen atom was coordinated to Fe2+ resulting in the formation of Fe2+-TSC complex on
the anodic sites of the metal surface. The band at 1351 cm-1 was appeared due to the presence of Zn(OH)
2 .
3.7. SEM Analysis of Metal surface
SEM provides a pictorial representation of the surface. To understand the nature of the surface film in the absence and presence of inhibitors and the extent of corrosion of carbon steel, the SEM micrographs of the surface are examined.
Days 1 3 5 7 9
Well water (Blank)
CR mdd 18.32 23.64 25.14 27.36 29.42
TSC ( 50ppm ) + Zn2+ (25ppm)
CR mdd IE%
3.48 81
7.09 70
8.80 65
11.22 59
13.53 54
a b
Figure 4. FTIR Spectra. a - Pure TSC; b- Film formed on surface of metal after immersion in well water + TSC(50ppm) + Zn2+(25ppm)
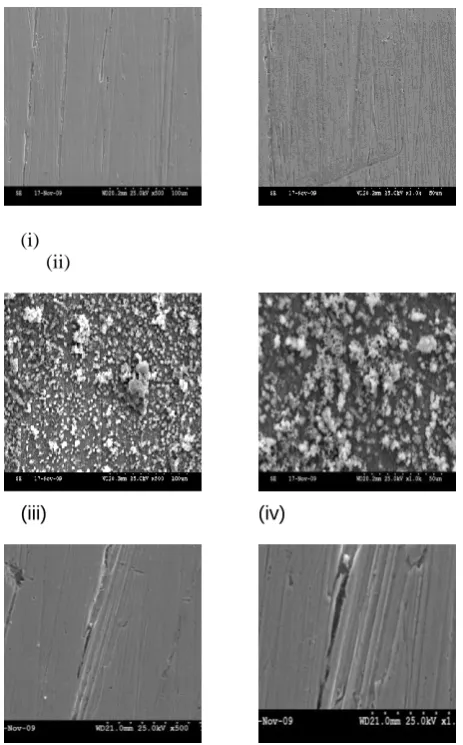
The SEM images of different magnification (X500, X1000) of carbon steel specimen immersed in the well water for 1 day in the absence and presence of inhibitor system are shown in Fig 5 .
(i) (ii)
(iii) (iv)
Figure 5. SEM micrographs: Carbon steel (control), magnification – x500 (i), x1000 (ii); Carbon steel immersed in well water, magnification –x500 (iii), x1000 (iv); Carbon steel immersed in well water containing TSC (50 ppm )+ Zn2+ (25
ppm), magnification - x500 (v), x1000 (vi).
The SEM micrographs of polished carbon steel surface (control) in Fig 5.i and ii show the smooth surface of the metal. This shows the absence of any corrosion products or inhibitors complex formed on the metal surface.
The SEM micrographs of carbon steel surface immersed in well water in Fig 5 iii & iv shows the roughness of the metal surface which indicates the corrosion of carbon steel in well water. Fig.5 v & vi shows the SEM micrographs of the metal surface immersed in well water containing 50 ppm of TSC, 25 ppm of Zn2+ creates a thin protective film, which inhibits
carbon steel dissolution.
3.8. Atomic Force Microscopy Characterization
Atomic force microscopy (AFM) is a powerful technique for the gathering of roughness statistics from a variety of surface.18 AFM is becoming an accepted
method of roughness investigation.19-23
All atomic force microscopy images were obtained on a Veeco di Innova AFM instrument operating in tapping mode in air. The scan sizes of all the AFM images are 5µm x 5µm areas at a scan rate of 2.4 lines per second.
The two dimensional (2D), three dimensional (3D) AFM morphologies and the AFM cross-sectional profile for polished carbon steel surface (reference sample), carbon steel surface immersed in well water (blank sample) and carbon steel surface immersed in well water containing the formulation of 150 ppm of TSC and 25 ppm of Zn2+ are shown in Fig 6 (a,d,g), (b,e,h), (c,f,i)
respectively.
Root-mean-square roughness, average roughness and peak-to-valley value
AFM image analysis was performed to obtain the average roughness, Ra (the average deviation of all points
roughness profile from a mean line over the evaluation length), root-mean-square roughness, Rq (the average of
the measured height deviations taken within the evaluation length and measured form the mean line) and the maximum peak-to-valley (P-V) height values (largest single peak-to-valley height in five adjoining sampling heights [24]. Rq is much more sensitive than Ra to large
and small height deviations from the mean [25].
Table 7 is the summary of the average roughness (Ra),
rms roughness (Rq) maximum peak-to-valley height
(P-V) value for carbon steel surface immersed in different environments.
The values of Rq,Ra and P-V height for the polished
a) b)
c)
Figure 6. 2D AFM images of the surface of polished carbon steel (control) (a); Carbon steel immersed in well water (blank) (b); Carbon steel immersed in well water containing TSC (50 ppm) + Zn2+ (25ppm) (c)
The rms roughness, average roughness and P-V height values for the carbon steel surface immersed in well water are 91.37 nm, 73.10 nm and 411.9 nm respectively. These data suggest that carbon steel surface immersed in well water has a greater surface roughness than the polished metal surface, which shows that the unprotected carbon steel surface is rougher and was due to the corrosion of the carbon steel in well water environment. Fig. 6 (b,e,h) displays corroded metal surface with few pits.
d e
f
Figure 6. 3D AFM images of the surface of polished carbon steel (control) (d); Carbon steel immersed in well water (blank) (e); Carbon steel immersed in well water containing TSC (50 ppm) + Zn2+ (25ppm) (h)
The presence of 150 ppm of TSC and 25 ppm of Zn2+
in the well water environment reduces the Rq by a factor of 49.44nm from 91.37 nm and the average roughness is significantly reduced to 35.24 nm when compared with 73.10 nm of carbon steel surface immersed in well water. The maximum peak-to-valley height also was reduced to 190.0 nm. These parameters confirm that the surface appears smoother. The smoothness of the surface is due to the formation of a compact protective film of Fe2+ -
TSC complex and Zn(OH)2 on the metals surface thereby
inhibiting the corrosion of carbon steel.
Also the above parameters observed for carbon steel immersed in well water are somewhat greater than the AFM data of polished metal surface which confirms the formation of the film on the metal surface, which is protective in nature.
Table .7 AFM data for carbon steel surface immersed in inhibited and uninhibited environments
Samples RMS (Rq)
Roughness (nm)
Average Roughness (Ra) (nm)
Maximum peak-to-valley height (nm) Polished carbon
Steel (control)
3.50 2.211 22
Carbon steel immersed in well water (blank)
91.37 73.10 411.9
Carbon steel immersed in well water containing TSC (50 ppm) + Zn2+ (25ppm)
49.44 35.24 190.0
3.9. Effect of TSC – Zn2+ formulation on the biocidal
efficiency of CTAB
The influence of TSC-Fe2+ system on the biocidal
efficiency of CTAB is shown in Table 8. The biocidal efficiency of TSC – Fe2+ system in the absence of CTAB
is found to be 8 percent. The number of colony forming units/ml is 424 x 10 3, which is objectionable. When 200
ppm of CTAB is added, nil CFµ/ml is obtained. The biocidal efficiency is 100%. Hence the optimum concentration of CTAB is 200 ppm. Thus it is seen in Table 8, that the formulation consisting of 50ppm of TSC, 25ppm of Zn2+ and 200 ppm of CTAB has 49% of
corrosion inhibition efficiency and 100% of biocidal efficiency
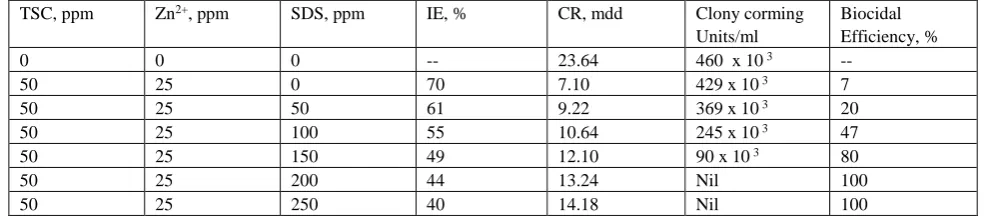
3.10. Effect of TSC –Zn2+ formulation on the biocidal
efficiency of SDS
The biocidal efficiency of TSC –Zn2+ in the absence of
SDS was found to be 7 percent. The number of colony forming units/ml was 429x 10 3 this is objectionable.
When 200 ppm of SDS was added , nil CFµ/ml was obtained. The biocidal efficiency was 100%. Hence the optimum concentrations of SDS are 200 ppm. Thus it was seen from the Table 9 that the formulation consisting of 50 ppm of TSC, 25 ppm of Zn2+ and 150 ppm of SDS has
g h i
Figure 6. The cross-sectional profiles, which are corresponding to as shown broken lines in AFM images of the surface of polished carbon steel (control) (g); carbon steel immersed in well water (blank) (h); carbon steel immersed in well water containing TSC (50 ppm) + Zn2+
(25ppm) (i)
Table 8. The corrosion inhibition efficiency and the biocidal efficiency of the TSC– Zn2+ - CTAB system
Table 9. The corrosion inhibition efficiency and the biocidal efficiency of the TSC – Zn2+ - SDS system
REFERENCES
1 Ghareba S., Omanovic, S. Electrochim. Acta, 2011, 56, 3890. 2 Shi, H. W., Han, E. H., Liu, F. C., Corr. Sci. 2011, 53, 2374. 3 Lowmunkhong, P., Ungthararak, D., Sutthivaiyakit, P., Corr.
Sci., 2010,52, 30.
4Gece, G., Bilgiç, S., Corr. Sci. 2010, 52, 3435.
5 Qiong Deng, Hong-Wei Shi, Na-Na Ding, Bao-Qin Chen,
Xiao-Peng He, Guixia Liu, Yun Tang, Yi-Tao Long, Guo-Rong Chen, Corrosion Science, Volume 57, April 2012, Pages 220-227
6 Garcia-Arriaga, V. Alvarez-Ramirez, J. Amaya, M. Sosa, E.
Corr. Sci., 2010, 52, 2268.
7 Quartarone, G. Battilana, M. Bonaldo, L. Tortato, T. Corr.
Sci., 2008, 50, 3467.
8 Mohammed A. A., Abd El Rehim, S. S., Abdel-Fatah, H. T.
M., Corr. Sci. 2009, 51, 882.
9Lebrini, M. Fontaine, G. Gengembre, L. Traisnel, M. Lerasle,
O. Genet, N., Corr. Sci. 2009, 51, 1201.
10Khaled, K.F. Corr. Sci., 2010, 52, 3225.
11 Galal, A. Atta, N.F. Al-Hassan, M.H.S. Mater. Chem. Phys.,
2005, 89(1), 28.
12 Ein-Eli, Y. Auinat, M. 2005 Meeting Abstracts, (MA) 2005,
584.
13 Saleh, R.M. Shams El Din, A.M. Corr. Sci., 1972, 12(9), 689. 14 Amin, M. A., Khaled, K. F., Corr. Sci., 2010, 52, 1194.
TSC, ppm Zn2+, ppm CTAB, ppm IE, % CR, mdd Clony corming
units/ml
Biocidal efficiency, %
0 0 0 -- 23.64 460 x 10 3 --
50 25 0 70 7.09 424 x 10 3 8
50 25 50 64 8.51 360 x 10 3 22
50 25 100 59 9.69 242 x 10 3 47
50 25 150 53 11.11 89 x 10 3 81
50 25 200 49 12.10 Nil 100
50 25 250 45 13.00 Nil 100
TSC, ppm Zn2+, ppm SDS, ppm IE, % CR, mdd Clony corming
Units/ml
Biocidal Efficiency, %
0 0 0 -- 23.64 460 x 10 3 --
50 25 0 70 7.10 429 x 10 3 7
50 25 50 61 9.22 369 x 10 3 20
50 25 100 55 10.64 245 x 10 3 47
50 25 150 49 12.10 90 x 10 3 80
50 25 200 44 13.24 Nil 100
15 Eddy, N. O. J. Advanced Res., 2011, 2, 35.
16 Singh, S.K. Mukherjee, A.K., J. Mater. Sci. Technol., 2010,
26, 264.
17 Amin, M. A., Ibrahim, M. A. Corr. Sci., 2011, 53, 873. 18 Avci, G. Colloid and Surfaces A: Physicochem. Eng. Aspects,
2008, 317, 730.
19 Lua, Z. L., Qiua, Y. B. and Guo, X. P. Acta Phys-Chim.
Sinica, 2008, 24, 243.
20 Quartarone G., Bonaldoa L. and Tortatoa, C. Appl. Surface
Sci., 2006, 252, 8251.
21 Kern P. and Landolt D. Corr. Sci., 2002, 44, 1809. 22 Bilgiç, S. Mater. Chem. Phys., 2002, 76, 52.
23 Kern P. and Landolt, D. Electrochim. Acta, 2001, 47(4), 589. 24 Agarwal P. and Landolt, D. Corr. Sci. 1998, 40(4-5) 673.
25 Kálmán, E. Kármán, F. H. Telegdi, J. Várhegyi, B. Balla J.
and Kiss, T. Corr. Sci. 1993, 35(5-8), 1477.
26 Yurt, A. Bereket G. and Ogretir, C. J. Mol. Struct.
THEOCHEM, 2005, 725(1-3), 215.
27 Spah, M., Spah, D. C., Deshwal, B., Lee, S. M., Chae, Y. K.
and Park, J. W., Corr. Sci., 2009, 51(6), 1293.
28 Sagoe-Crentsil, K.K. Yilmaz V.T. and Glasser F. P. Cement
Concrete Res., 1993, 23( 6), 1380.
29 Hassan, H. H. Electrochim. Acta, 2005, 51(3), 526. 30 Torchio, S Corr. Sci., 1991, 32(12), 1377.