International Journal of Advances in Management and Economics
Available online at: www.managementjournal.info
RESEARCH ARTICLE
An Empirical Analysis of Employee Engagement on Employee
Performance in Technical Institutions in Kenya
Caroline Jelagat Sitienei Koech
1*, JosphatCheboi
21Department of Management and Economics, Jaramogi Oginga Odinga University of Science and
Technology, Kenya.
2Department of Accounting and Finance, Moi University. Kenya.
*Corresponding Author: Caroline Jelagat Sitienei Koech
Abstract
Purpose The purpose of this paper was to examine the influence of employee engagement on employee performance in technical institutions in Kenya. The study therefore, sought to establish the influence of employee engagement on employee performance. Methodology The paper adopts regression model to test the effect of employee engagement on employee performance Findings –The study findings revealed that there is a positive and significant relationship between employee engagement and employee performance (β=.338; t=6.366; p<.05). Limitations/implications Given that the study looked at, employee engagement and employee performance at one point in time, longitudinal time span research is recommended to provide more insights on these variables. A longitudinal approach may also help in improving the models ability to make causal statements. Theoretical implications - The study contributes to theory by analysing empirically the extent of the relationship between employee engagement and employee performance. Originality/value this is the first study that focuses on testing the influence of employee engagement on employee performance in technical institutions in Kenya.
Keywords: Employee engagement, Employee performance, Technical institutions.
Introduction
Management of human resources has long been considered as an important component of any organization .This is because people add value to organizations through their knowledge, skills and capabilities. Human capital theory posits that people add value to the organisation through their knowledge, skills, experiences, talents and intelligent quotient [1, 2].
Anitha [3] concurs with resource based view and knowledge based view and acknowledges that people is one resource that cannot be duplicated or imitated by competitors and is considered the most valuable asset if
managed and engaged properly in
appropriate tasks. The theory underpins the philosophies of human resource management and human capital management which have employee engagement as a critical component in performance. Employee performance is an indicator which measures how well an employee accomplishes the set targets in line with organizational objectives. Improving
employee performance and overall
organization performance is the focus of every manager in an organization. [4,5] asserted that it is important for an organization to establish a comprehensive measurement index that provides managers and staff with clear directions through the set goals.Evidence show that organisations with superior performance actively engages their employees [6-12].
However empirical results on employee engagement and employee performance show contradicting results both at employee level and organization level. The link between
employee engagement and employee
highly engaged employees were low performers and that those employees who were low in engagement were high performers. Jaupi and Llaci, [14] in their study ‘Employee Engagement and its Relation with Key Economic Indicators’ established that in Albania, the region that reported the lowest income per capita (GDP 24%), had the most employees engaged (76.4%).
These findings indicate a sharp contrast to years of research linking high employee
engagement to increased employee
performance, productivity, profitability and overall organizational performance. This implies that more research is needed to explore the concept of employee engagement because of contradicting findings. The
contrasting findings by researchers
motivated this study. Naicker [15] Nazem, Mozaiini and Seifi [16] agree that most empirical studies on employee engagement and have been done in developed economies and thus need for more studies in developing
economies with varying institutions,
demographics and cultural context.
This stream of thought is further extended by Basu and Sengupta [17], Hussain [18] Nasiruzzaman, Qudaih and Ahmad [15] who acknowledge that relatively few studies have focused on the concept of knowledge management achieved through employee engagement and thus employee performance in learning institutions particularly in
Technical, Vocational Education and
Training (TVET). Technical, Vocational Education and Training (TVET) provides learners with the technical skills. A World Bank report on Integrating TVET into the knowledge economy in Middle East and North Africa (MENA) region covered Egypt, Jordan, Lebanon and Tunisia and one of the recommendations of the report was to refocus the role of TVET as an instrument for the knowledge economy in order to provide highly skilled and knowledgeable individuals of different ages, with experience to meet the demands of the dynamic labor market [19].
Afeti [20] and World Bank [19] pointed out the challenges facing TVET institutions in Africa and asserted that TVET is back on the development agenda of many African countries. Ministry of Education Science and Technology pointed out that to become industrialized, Kenya requires the technical
competencies from TVET institutions that match the requirements of the knowledge economy and this can be partly achieved by engaging employees to enhance retention and thus high performance. Kenya is in the forefront in rebranding TVET as holding the key to rapid industrialization and national development. However the development agenda emphasizes more on infrastructure within TVET and pays little attention on employees who bring knowledge, skills and capabilities for better performance in these institutions leading to high turnover and consequent loss of tacit knowledge [20].
This if further supported Koech, who established that masters and PhD holders in technical institutions in Kenya were exiting to universities because of better terms of service at the universities.Moreover, the Inter University Council for East Africa- IUCEA reported that in Kenya, Uganda, Tanzania, Rwanda and Burundi, there is a general agreement that technical vocational education and training (TVET) is seen as having a lower status than school and university qualifications.
Therefore, the society at large considers TVET as a fall-back option for learners for whom all other routes have been exhausted, or as an entry route to the university.The consequence of this is that the economy, the emerging and incumbent workers suffer. In Kenya today there is an acute shortage of technicians, artisans, plumbers all products of TVET and organizations in Kenya particularly the private sector outsource these skills from other countries (IUCEA Report, 2014; Ministry of Industrialization and Enterprise Development, 2014).
The government of Kenya in outsourcing
medical equipment for the county
Literature Review and Hypothesis
Development
The Concept of Employee Performance
According to Campbell, [21] employee performances are behaviors which employees display they are observable, measurable and are valued by the organization because of its relevance to organizational goals. It is also evident from extant literature that most research on employee performance has focused on variables relevant to particular occupations rather than identifying broad dimensions of employee performance which would allow for greater generalizability of results beyond one occupation.
However according Viswesvaran and Ones [22] individual employee performance has been a central variable in much research in relation to overall organization performance but as a construct, employee performance for a long time received little attention when compared with other relevant variables. Therefore, this study considered employee performance as a dependent variable based on this gap in literature. The little attention that employee performance received over the years has been attributed partly to more emphasis on wider systemic issues in attempting to understand organizational performance and also because researchers tend to put more emphasis on independent variables [23].
Campbell [21] further articulates that the measurement of employee performance as a variable tends to be controlled by employees other than the researcher. The issue here is that employees tend to rate themselves highly as posited by Donaldson, Thomas, and Graham [24] and Donaldson and Grant- Vallone [25]. This limitation was mitigated by the study by keenly considering the specific questions being asked and the type of research questions as argued by Donaldson and Grant- Vallone [25].
Further to note is that employee performance has often been confused with activities and measures over which employees have little or no control such as productivity, efficiency and output [21]. Output for instance is a measure which has been used for individual performance but in practice it is a reflection of many factors such as the work environment, availability of equipment,
standard of equipment, resources,
management support and other systemic issues as pointed out by the total quality
management literature. These factors
contribute to employee performance but are not part of the individual workers efforts [26]. The measurement of job performance is also complicated by the fact that what counts for job performance is itself complex, changes over time and varies according to situations and organizations as commended by Hough and Oswald [27].
This lack of comparability of performance dimensions from one occupation to another affects the generalizability of the research findings and therefore, there is need to build on what scholars have done in identifying broad dimensions of employee performance
which would allow for greater
generalizability of results and cross-level inferences to be made. In response to this complexity, researchers have adopted a range of approaches in dealing with employee performance. In a review of models of job performance, Viswesvaran and Ones, [22] used ideas developed by Binning and Barrett [28] to analyze the approaches for handling employee performance. The Campbell et al.
[29] model is based on a review of the job
performance literature and extensive
confirmatory research conducted in United States military settings. On the basis of this research they settled on eight components of job performance which are; Job specific task proficiency, non-job specific task proficiency, written and oral communication, task
proficiency, demonstration of effort,
maintenance of personal discipline,
facilitation of peer and team performance, supervision or Leadership and management or administration .
However Campbell et al. [29] cautioned that these components are not necessarily present in every job and are not the last word for defining the employee performance domain. They also argued that the various components are relatively independent and are relevant for performance research. This gives room for researchers to explore more on employee performance. This means more effort on the part of scholars to generate
more general models of individual
competence quality, communication competence, leadership, compliance with authority and overall performance .There are significant differences between these models, Productivity and Quality for instance appear on the Viswesvaran et al. [30] model and are
supported by Office of Personnel
Management, [31] and Hakala, [32] but not among the Campbell et al.[29]dimensions, whereas there seems to be no equivalent for non-job specific task proficiency in the Viswesvaran et al.[30] list. However the overlap between the lists is substantial and that these models both appear to reflect broader and more fundamental structures of employee performance.
Office of Personnel Management, [31] considers quality, quantity, timeliness and cost effectiveness as general measures of employee performance which are used to generate specific measures of employee performance. The performance elements that are measured in the employee include both individual and group assignments and responsibilities. Group assignment includes internal group dynamics processes, such as
decision-making or problem solving
processes, or group or team development.
Office of Personnel Managementhowever, agrees that there are certain aspects of performance at the individual level that may not be able to measure because the employee has no control over them. Hakala [32] builds on Office of Personnel Management [31] arguments that employee performance is
indicated by quantity, quality, and
timeliness, cost-effectiveness by adding absenteeism, creativity, and adherence to policy, personal habits and personal grooming components.
Hakala, further commends that these measures are broad and that some components for instance quality, cost effectiveness are beyond the control of the individual employee and therefore is need for more to be done by researchers. The study acknowledged the diversity and measurable. These include; task proficiency competence or job knowledge, demonstration of effort, interpersonal competence, communication competence, leadership, maintenance of personal discipline, facilitation of peer and team performance, creativity and adherence to policy. From these components of employee performance the study developed nine items.
Employee Engagement and
Performance
Employee engagement was first used by Khan in 1990 [33] in his study “Psychological conditions of personal engagement and disengagement at work” which was published in the academy of management journal. It was until the mid-1990s when Gallup started to refine and extend employee engagement by developing twelve items (Q12) to measure employee engagement which were then adopted and validated by many researchers through studies as well as practical considerations concerning its usefulness in the workplace [6,34,35,11,13].
There were many and conflicting definitions of employee engagement in the early years, however the construct as grown over time and there is evidence of consensus among researchers. Ameta-analysis study by Shuck and Wollard of 140 articles that mentioned the word employee engagement revealed an emergent and working definition. They defined employee engagement as a positive cognitive, emotional and behavioral state directed towards organizational outcomes. The study concurs with Shuck and Wollard and operation alizes employee engagement as a rational and emotional connection an employee feels toward the organization which in turn influences the employee to consistently speak positively about the
organization to co-workers, potential
employees, and customers. The employee also has an intense desire to be part of the organization and therefore exert extra effort and engage in behavior that contributes to organizational success. This view is in tandem with the argument by Hewitt [36] Murphy [13].
Since the inception of engagement construct, researchers have studied various aspects of employee engagement. It is evident from extant literature that employee engagement has an impact on organization results both at employee level and organization level. From employee level perspective, a study by Hakanen, Perhoniemi, Toppinen-Tanner found a positive relationship between
employee engagement and employee
were consistent when employee performance was rated by supervisors, co-workers and even self. Fredrickson [37] in his study established that engaged employees are more receptive to new experiences thus they tend to explore their environments leading to more innovation and creativity at work.
This view is supported by Bakker,Demerouti, Ten Brummelhuis [38] who posited that engaged employees are more willing to learn new things. This shows that engaged employees are able to translate their thoughts to action and therefore achieve high performance in the work place [8,9]. Kim, Kolb, and Kim [10] reviewed empirical studies on employee engagement and performance and established that existing empirical studies confirms direct and/or
indirect positive effects of employee
engagement on employee performance within organizations. Kruse (2012) did an analysis of 28 research studies by different scholars and revealed that there is a correlation between employee engagement and service, sales, quality, safety, retention, profits and total shareholder returns.
The link between employee engagement and employee outcome is further supported by Wagner and Saks, Harter and Fleming and Asplund who articulated that engaged employees often portray a deep positive emotional connection with their work and are consistently more productive, profitable, safer, healthier and less likely to leave their employer. This finding further agrees with Harter et al. [6] who conducted a
meta-analysis and found that employee
engagement relates to higher profitability and customer satisfaction hence customer loyalty. This view is further supported by a four year longitudinal study by Winkler et al.
Who used 755 retail bank employees to assess employee engagement on business unit metrics and established that employee engagement had more impact on business results. A significant amount of research shows that engaged employees tend to outperform their disengaged counterparts [39].
A study by Rampersad pointed out that disengaged employees can be a serious liability to the organization as it causes organizations to incur excess costs as a result of underperformance on crucial tasks, leading to widespread customer dissatisfaction. The
study pointed out major causes of employee disengagement as lack of trust between employee and management, unhealthy competition, bullying, harassment, excess control, toxic politics and poor level of equity in pay packages. Therefore, a disengaged employee or team is ready for exit from the organization and thus, there is need for organizations to engage employees at all levels.
However according to Murphy, [13] it is no longer the case anymore that highly engaged employees are high performers in all areas. The link between employee engagement and
employee performance was sharply
contrasted by Murphy [13] in his study which linked employee engagement scores and employee appraisal scores. Murphy found that workers who were deemed to be low performers in their annual review scored higher than those employees who were viewed as high performers. He further established that highly engaged employees were low performers and that those employees who were low in engagement were high performers.
These findings indicate a sharp contrast to years of research linking high employee
engagement to increased employee
performance, productivity, profitability and overall organizational performance. This implies that more research is needed to explore the concept of employee engagement because of the contradicting findings. This confirms the theoretical perspectives of Rana and Ardichvili [40] who articulated that there is no consensus on the relationships between
employee engagement and other
organizational variables. This inconsistencies evidenced in literature leads to the development of the following hypothesis;
Employee Engagement Influences
Employee Performance
Materials and Methods
Rift Valley Technical Training Institute, Kaiboi Technical Training Institute, Kitale
Technical Training Institute, Ollessos
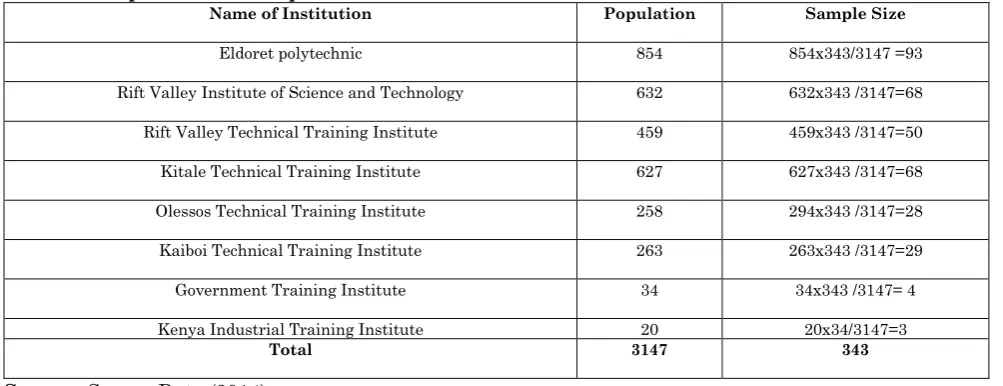
Technical Training Institute, Government Training Institute and Kenya Industrial trainingas indicated in Table 1 (Appendix 1). The target population was 3147 employees and 343 formed the sample size as per Cochran’s formulaas shown in Table 2 (Appendix 2).
Random sampling technique was used to identify the respondents who filled the questionnaires. However, out of 343 respondents, 326 responded, hence giving a response rate of 95.04% .After data cleaning 316 questionnaires were found to be complete and were used in data analysis. All items in the study were anchored on a five point likert scale. Questionnaires were validated through pretest and a panel of experts. Croncbach alpha tests were used to assess the reliability of the instrument and the computed Cronbach alpha coefficient results were all above 0.7 and this fall within the accepted limit by [41].
Data were screened to assess whether the assumptions of regression were met. Normality of the distribution of data was tested graphically by inspection of histogram and p-p plots and numerically by Shapiro-Wilk test and the findings were within the accepted thresholds of .05 and above. Linearity of study variables was tested using Pearson moment correlation and the inspection of the correlation matrix revealed that there is a linear relationship between the study variables. Independence of errors was checked using Durbin–Watson statistic and it was within the accepted threshold of 1.5 to 2.5 according to Hayes [42]. Multicolinearity was tested by running the Variance Inflation Factors (VIF) and the tolerance levels and standard cut-off points suggested by Scott [43] were observed.
Results
The respondents were asked to provide information regarding their age, gender, level of education. The purpose of this information was to help the researcher to understand the demographic context within which the study was conducted. The results presented in Table 3 (Appendix 3) shows that women were the majority comprising 165 (52.2%) and men were 151 (47.8%).
Regarding the level of education, majority of the respondents were aged between 35 and 44 years 128 (40.5%), followed by 25 to 34 years 95 (30.1%), followed by 45 to 54 years 60 (19.0%), followed by 18-24 years 24 (7.6%) and over 55 years 9 (2.8%).Concerning the level of education, majority of the respondents 107 (33.9%) have first degree, followed by holders of master’s degree 70 (22.2%). Diploma 64 (20.3%) and higher diploma holders were comprised of 63 respondents (19.9%). PhD holders were the least 12(3.8%).
Correlation Analysis
Results in Table 4 (Appendix 4) revealed that employee engagement significantly and
positively correlate with employee
performance as shown correlation coefficient value of .338. The results signify that increased levels of employee engagement are
associated with increased employee
performance. Therefore, evidence of linear relationship between employee engagement and employee performance paved way for regression analysis.
Hypothesis Testing
The hypothesis states that employee
engagement influences employee
performance. This hypothesis failed to reject as shown by results in Table 5 (Appendix 5). The coefficient of estimates (β=.338; t=6.366; p<.05) confirmed that employee engagement
significantly influences employee
performance. Results in Table 6 (Appendix 6) revealed that employee engagement
significantly influences employee
performance. The R 2 value of 0.114 implies that the employee engagement contributes 11.4% of variation in employee performance. The overall regression model is statistically significant (40.527; p<.05) as shown by the F change statistic in Table 7 (Appendix 7)
Discussion and Conclusion
This research investigated and tested the influence of employee engagement on employee performance in TIVET institutions in Kenya. The findings indicate a positive
and significant relationship between
employee engagement and employee
This result links well with the conclusions of that an important way to enhance employee performance is to focus on fostering employee engagement because employees who are fully engaged are positive, energetic, dedicated, resilient and perform better.Engagement model by Corporate Leadership Council 2004 links well with this result. The theory argues that employee rational and emotional commitment leads to discretionary effort thus high performance.
The findings of this studycontradicts the findings of Murphy, [13] and Jaupi and Llaci, [14] who found that employees who bring value to the organization in terms of performance are those employees who are low in engagement. Employee engagement positively influences employee performance. Based on this finding, the study argues that
Managersin TVET institutions should
develop policies that recognize engaged employees by rewarding their performance.
The institutions should also develop policies to address issues that disengage employees at work as pointed out by Rampersad who observed that lack of trust between employees and management, unhealthy competition, bullying, harassment, excess control, toxic politics and poor level of equity in pay packages. These factors that push valuable employees out the organization and therefore, managers in their quest to retain talent must purpose to discover and act on the factors that push valuable employees out the organization and build on the factors that hold employees to stay.
Implication to Managers and
Researchers
The findings of the study provide a basis to TIVET managers in making policy guidelines and interventions on employee engagement in order to improve employee performance. Merry (2013) argued that annual employee survey help organizations to get beyond thinking of engagement as just a survey but also as a tool to support organizational development in terms of employee career development.
Hewitt [36] contend that career opportunities remain one of the top drivers of employee engagement. Based on previous empirical studies and the results of this study, it is
evident that more enlightening of
interpretation of results between employee engagement and employee performance can be reflected better if an initiative is taken by researchers to assess the role of the third variable in the relationship. This view is supported by Rana, Ardichvili and Tkachenk [40] who observed that moderation analyses would best reflects on the relationships and offer more accurate estimation of the relationships under study.
Limitations of the Study
This study was confined on knowledge management, employee engagement and employee performance in TVET institutions in rift valley Kenya hence, limiting the generalizability of the findings. To augment the research findings of this study, the study recommends a replica study to explore these findings in different environments and cultures.
References
1. Boxall P (1996) The Strategic HRM
Debate and the Resource-based View of the Firm. Human Resource Management Journal, 6: 59-75.
2. Armstrong M (2006) Strategic Human
Resource Management: A Guide to Action (3rdEd.). London and Philadelphia: Kogan Page Ltd.
3. Anitha J (2014) "Determinants of
employee engagement and their impact on employee performance", International Journal of Productivity and Performance Management,63(3): 308 - 323
4. Ho LA (2008) What affects organizational
performance? The linking of learning and
knowledge management. Industrial
Management & Data Systems, 108(9), 1234-1254.
5. Tseng Sh, M Lee, P Sh (2014) The effect of knowledge management capability and dynamic capability on organizational performance. Journal of Enterprise Information Management, 27 (2): 158-179.
6. Harter JK, Schmidt FL, Hayes TL (2002)
Business-unit-level relationship between
engagement, and business outcomes: a meta-analysis. J. Appl. Psychol. 87:268– 79
7. Fleming JH, Asplund J (2007) Human
sigma. Gallup Press, New York, NY.
8. Halbesleben JRB, Wheeler AR (2008) The
relative role of engagement and
embeddedness in predicting job
performance and turnover intention. Work Stress 22:242–56.
9. Demerouti E, Cropanzano R (2010) From
thought to action: employee work engagement and job performance. See Bakker & Leiter 147–63.
10.Kim W, Kolb JA, Kim T (2012) The
relationship between work engagement and Performance: A review of empirical literature and a proposed research agenda. Human Resource Development Review.
11.Kruse K (2012) Why Employee
Engagement. Retrieved Febuary 5, 2015, from
http://www.kevinkruse.com/employee- engagement-research-master-list-of-29-studies
12.Sang Hellen, Wario Guyo, Odhiambo
Romanus (2014) The Moderating Role of
Employee Engagement on the
Relationship between Labour
Productivity with Training and Career Development International Journal of Business and Behavioral Sciences. 4,7. 13.Murphy M (2013) New analysis linking
engagement scores with appraisal scores.
Retrieved March 3, 2015, from
https://www.leadershipiq.com/white- papers/job-performance-not-a-predictor-of-employee-engagement/
14.Jaupi F, Llaci S (2014) Employee
Engagement and its Relation with Key Economic Indicators.Journal of IT and Economic Development, 5(2): 112-122.
15.Nasiruzzaman HA, Qudaih R, Ahmad D
(2013) Project success and knowledge management (km) practices in Malaysian institution of higher learning (IHL). Journal of Education and Vocational Research, 4(5): 159-164.
16.Nazem F, Mozaiini M, Seifi A (2014) A structural equation model of knowledge management based on organizational climate in universities world academy of
science, engineering and technology.
International Journal of Social
Management, Economics and Business Engineering, 8(2): 462-466.
17.Basu B, Sengupta, K (2007) Assessing
Success. Factors of Knowledge
Management Initiatives of Academic Institutions a Case of an Indian Business School. The Electronic Journal of Knowledge Management, 5(3): 273 – 282.
18.Hussain H (2009) Knowledge
Management Systems for Education, training and development Organization,
Unpublished paper, CPSC Manila
Philippine.
19.World Bank (2005) Collaboration on
Knowledge and Skills in the New Economy Integrating TVET into the
Knowledge Economy: Reform and
Challenges in the Middle East and North Africa, Turin ,Italy
20.Afeti, G (2012) Technical and Vocational
Education and Training for
Industrialization. The African Research and Resource Forum: Occasional Paper; Kenya.
21.Campbell JP (1990) Modeling and the
performance prediction problem in industrial and organizational psychology. In M. Dunnette and L.M. Hough (eds),
Handbook of Industrial and
organizational Psychology, 1 687-781. Palo Alto, CA: Consulting Psychologists Press.
22.Viswesvaran C, Ones DS (2000)
Perspectives on models of job
performance. International Journal of Selection and Assessment, 8(4): 216-226. 23.Addison JT, Belfield CR (2001) Updating
the Determinants of Firm Performance: Estimation using the 1998 UK Workplace Employee Relations Survey. British Journal of Industrial Relations, 39(3): 341-366.
24.Donaldson SI, Thomas CW, Graham JW
(2002) Understanding self-report bias in prevention research. Manuscript under review.
25.Donaldson SI, Grant-Vallone EJ (2002)
Understanding self-report bias in
organisational behaviour research.
26.Hakala D (2008) Ways to Measure
Employee Performance. Retrieved
December
08,2014,fromhttps://www.google.co.ke/sea rch?hl=enKE&source=hp&biw=&bih=&q =hakala+2008employee+measures&gbv= 2&oq=hakala+2008employee+measures& gs_=heirloomhp.12...1747.25054.0.27347. 31.21.0.9.0.0.702.3822.43j3j1.7....0...1ac.1. 34.heirloom-hp...26.5.2761. XfI0IirwbHo. 27.Hough LM, Oswald FL (2001) Personnel
Selection: Looking toward the future - remembering the past. Annual Review of Psychology, 51, 631-664.
28.Binning JF, Barrett GV (1989) Validity of
personnel decisions: A conceptual
analysis of the inferential and evidential bases. Journal of Applied Psychology, 74, 478-494.
29.Campbell JP, Glaser MB, Oswald FL
(1996) The substantive nature of job performance variability. In K. R. Murphy (ed.), Individual Differences and Behavior in Organizations. San Francisco: Jossey-Bass, 258-299.
30.Ones DS, Viswesvaran C (1996) A general
theory of conscientiousness at work: Theoretical underpinnings and empirical
findings. In JM Collins (Chair),
Personality predictors of job performance:
Controversial issues. Symposium
conducted at the eleventh annual meeting of the Society for Industrial and Organizational Psychology, San Diego, CA, April.
31.United States Office of Personnel
Management (2001) A Handbook for
Measuring Employee Performance:
Aligning Employee Performance Plans with Organizational Goals.
32.Hakanen JJ, Perhoniemi R,
Toppinen-Tanner S (2008) Positive gain spirals at work: from job resources to work engagement, personal initiative and work-unit innovativeness. J. Vocat. Behav. 73:78–91
33.Kahn WA (1990) ‘Psychological conditions
of personal engagement and
disengagement at work’. Academy of Management Journal, 33, 692-724.
34.Schaufeli WB, Van Rhenen W (2006)
Over de rol van positive
ennegatieveemotiesbij het welbevinden van managers: eenstudie met de
Job-related Affective Well-being Scale (JAWS) [About the role of positive and negative emotions in managers’ well-being: a study using the Job-related Affective Well-being Scale (JAWS)]. Gedrag Organ. 19:323–44
35.Vance RJ (2006) Employee Engagement
and Commitment a Guide to
Understanding, Measuring and
Increasing Engagement in your
Organization. Alexandria: SHRM
Foundation.
36.Hewitt A (2012) Global Employee
Engagement database. Retrieved
December 08.
37.Fredrickson B (2001) The role of positive emotions in positive psychology: the broaden-and-build theory of positive emotions. Am. Psychol. 56:218–26.
38.Bakker AB, Demerouti E, Ten
Brummelhuis LL (2012) Work
engagement, performance, and active learning: the role of conscientiousness. J. Vocat. Behav. 80:555–64
39.Shuck B, Reio TG (2011) The employee engagement landscape and HRD: How do we Link theory and scholarship to current practice? Advances in Developing Human Resources, 13(4), 419-428.
40.Rana S, Ardichvili A, Tkachenko O
(2013) Theoretical model of the
antecedents and outcomes of employee engagement: Dubin’s method. The 13th European HRD Conference, Brighton, UK, June.
41.Hair JF, Black CW, Babin BJ, Anderson
RE (2006) Multivariate data analysis (6th Ed.). Pearson: Prentice-Hall.
42.Hayes FA (2013) Introduction to
Mediation Moderation and Conditional Process Analysis: Regression Based Approach. New York: Guilford Press.
43.Sonnentag S (2003) Recovery, work
engagement, and proactive behavior: a new look at the interface between non work and work. J. Appl. Psychol. 88:518– 28.
44.Rurkkhum S, Bartlett KR (2012) The
relationship between employee
engagement and Organizational
45.Dubin R (1978) Theory building (Rev. Ed.). New York: Free Press.
Appendix 1
Table 1: Proportionate Sample Size for Each Institution
Name of Institution Population Sample Size
Eldoret polytechnic 854 854x343/3147 =93
Rift Valley Institute of Science and Technology 632 632x343 /3147=68
Rift Valley Technical Training Institute 459 459x343 /3147=50
Kitale Technical Training Institute 627 627x343 /3147=68
Olessos Technical Training Institute 258 294x343 /3147=28
Kaiboi Technical Training Institute 263 263x343 /3147=29
Government Training Institute 34 34x343 /3147= 4
Kenya Industrial Training Institute 20 20x34/3147=3
Total 3147 343
Source: Survey Data (2014)
Appendix 2
Table 2: List OF Registered Public Tvet Institutions as At December 2013 NAME OF INSTITUTION AND REGION
RIFT VALLEY
1 EldoretNational polytechnic UasinGishu
2 Rift Valley Institute of Science and Technology Nakuru
3 Rift Valley Technical Training Institute UasinGishu
4 Kaiboi Technical Training Institute Nandi
5 Kitale Technical Training Institute Tranzoia
6 Ollessos Technical Training Institute Nandi
7 Government Training Institute Baringo
8 Kenya Industrial training Nakuru
WESTERN REGION
1 Bumbe Technical Training Institute Busia
2 Bushiangala Technical Training Institute Kakamega
3 Friends College Kaimosi Hamisi
4 Kisiwa Technical Training Institute Bungoma
5 Matui Technical Training Institute Kakamega
6 Nayera Technical Training Institute Busia
7 Sangalo Institute of Science and Technology Bungoma
8 Sigalagala Technical Training Institute Kakamega
9 Shamberere Technical Training Institute Kakamega
NAIROBI REGION
1 Kabete Technical Training Institute Nairobi
2 Kenya Technical Teacher College Nairobi
3 Kiambu Institute of Science and Technology Kiambu
4 Masaai Technical Training Institute Kajiado
5 Nairobi Technical Training Institute Nairobi
6 Thika Technical Training Institute Thika
NYANZA REGION
1 Keroka Technical Training Institute Kisii
2 Kisumu Polytechnic Kisumu
3 Gusii Institute of Technology Kisii
4 Mawego Technical Training Institute Rachuonyo
5 Siaya Institute of Technology Siaya
CENTRAL REGION
1 Kavangua Institute of Technology Kirinyaga
2 Nyandarua Institute of Science and Technology Nyandarua
3 Michuki Technical Training Institute Kangema
4 Mathenge Technical Training Institute Nyeri South
5 Kiirua Technical Training Institute Meru
6 Nyeri Technical Training Institute Nyeri
7 Pc Kinyanjui Technical TraininingIstitute Nairobi
EASTERN REGION
1 Wote Technical Trining Institute Makueni
2 Meru Technical Training Institute North Imenti
3 Rwika Technical Training Institute Mbeere
4 Nkabune Technical Training Institute Meru
6 Meru Technical Training Institute North Imenti
COAST REGION
1 Mombasa Technical Training Institute
Appendix 3
Table3: Demographic Profile of the Respondents
Variable Frequency Percentage
Gender
Male 151 47.8% Female 165 52.2%
Age
18-24 years 24 7.6% 25-34 years 95 30.1%
35-44 years 128 40.5% 45-54 years 60 19.0%
Over 55 years 9 2.8%
Level of education
Diploma 64 20.1% Higher Diploma 63 20.1% Degree 107 34.2% Masters 70 21.9%
PhD 12 3.8 %
Source: Survey Data (2015)
Appendix 4
Table 4: Correlations
Employee performance Employee engagement
Employee performance Pearson Correlation 1 .338**
Sig. (2-tailed) .000
N 316 316
Employee engagement Pearson Correlation .338** 1
Sig. (2-tailed) .000
N 316 316
**. Correlation is significant at the 0.01 level (2-tailed).
Appendix 5
Table 5: Coefficients
Model
Unstandardized Coefficients Standardized Coefficients
t Sig.
B Std. Error Beta
1 (Constant) 1.272 .099 12.913 .000
Employee engagement .292 .046 .338 6.366 .000
Appendix 6
Table 6: Model Summary
Model R Square R R Square Adjusted
Std. Error of the Estimate
Change Statistics
Durbin-Watson R Square
Change Change F df1 df2 Change Sig. F
1 .338a .114 .111 .49355 .114 40.527 1 314 .000 1.630
Appendix 7
Table 7: ANOVA a
Model Sum of Squares df Mean Square F Sig.
1 Regression 9.872 1 9.872 40.527 .000b
Residual 76.488 314 .244