International Journal of Advances in Management and Economics Available online at: www.managementjournal.info
RESEARCH ARTICLE
Samia Hmani| July.-August. 2017| Vol.6| Issue 4|35-48 35
Interaction between FDI, Poverty and Inequality: Analysis in
Simultaneous Equations
Samia Hmani
Faculty of Economics and Management of Sousse, sousse university, Tunisia.
Abstract
Developing countries have had, from the late 1980s, large imbalances in their balance of payments. These are characterized by a lack of domestic resources relative to their financing needs. Hence the recourse to foreign direct investment as an alternative source of funding. The present research aims to identify the determinants of foreign direct investment on reducing poverty and inequality in the MENA region during the period 1990-2014. The results of econometric estimates based on simultaneous equation analysis suggest that FDI reduces both poverty and inequality. Furthermore the Kuznets hypothesis has not been validated for all sample countries.
Keywords: FDI, Poverty reduction, Inequality, Kuznets.
JEL Classification: I32, P45, F21, F43, O15
Introduction
Today, most countries seek to attract and promote foreign direct investment, which has
been treated with great mistrust1 before,
considering that the latter have beneficial effects on economic development. These beneficial effects are reflected in capital inflows to the host country, technological
input and know-how2, and access to new
markets3.
Moreover, eradicating poverty in all its forms as well as reducing inequalities are the objectives sought to be achieved in most countries.
These combined phenomena lead us to the heart of this work: "Can foreign direct investment (FDI) be seen as a means of
simultaneously reducing poverty and
inequality in the countries of the MENA region?"
The economic literature on the relationship between foreign direct investment and poverty is not as abundant, this relationship
1Being seen by some as a detriment to economic development. 2Learning effects, technology transfer ...
3Opening to international markets ...
has rarely been addressed. While, the same literature states that the relationship between economic growth, poverty and inequality can be broken down into a « growth effect » and an « inequality effect »,
which should be combined.
Hence, in our analysis, we need to take account of inequalities in order to explain the relationship between FDI and poverty reduction; and the use of a simultaneous equation model.
To study the impact of foreign direct investment on poverty, taking into account inequalities, we will first present the theoretical foundations of this relationship followed by a review of the literature. Then we will expose the variables as well as the model used and finally the main results.
Foreign Direct Investment and
Reduction of Poverty and Inequality Theoretical Basis
Samia Hmani| July.-August. 2017| Vol.6| Issue 4|35-48 36
This renewed interest in foreign direct investment today can be explained by the fact that developing countries, often faced with the problem of financing their economic activity with inadequate domestic resources,
use new sources of investment 4 . The
countries of South Asia, which have received the most FDI in recent decades, have experienced a sharp decline in poverty. According to no region has seen an increase in income and a decline in poverty in such a short time.
Although the economic literature on the impact of FDI on economic growth is abundant, that of FDI and poverty is rare due mainly to the complexity of the relationship. This can be explained, among others, by economic mechanisms. These effects may be microeconomic by affecting the structure of the labor market and consequently the level of poverty or of a macroeconomic nature, where FDI can be seen as an engine of economic growth, affecting, among other things, poverty reduction.
Microeconomic effects depend largely on the
investment climate in an economy 5 and
therefore on the quality of these investments. According to the economic literature, foreign direct investment can generate:
Eviction Effects
The confrontation of both domestic and foreign supply creates crowding-out effects through competition mechanisms. These effects are essentially due to a clear superiority in terms of technology, finance and the productive process of multinationals. Local firms that cannot cope with this
strength of foreign companies are
disappearing from the market. Training or Stimulating Effects
According to the microeconomic approach, foreign direct investment can stimulate
domestic investment by increasing
productivity either through : the competition (technological innovations), the creation of new domestic demands or the orientation of exports.
4Other than traditional sources of debt.
5Through tax advantages, administrative facilities good
infrastructure.
The macroeconomic approach, as for her, focuses on the impact of FDI on economic growth.
Developing countries, characterized by low savings and high unemployment, are using
FDI6 as a means of reduction of these
problems.In general, the conclusions
concerning theoretical and empirical studies consider that:
*Growth is good for the poor by improving the standard of living of the poorest population.
Dollar and Kraay [1]. in their study "Growth is good for the poor", suggest to governments
to increase economic growth 7 indefinitely
(irrespective of its nature) by neglecting the issues of income distribution.Economic growth is therefore a necessary element for
poverty reduction; Except that the
proportional gains of growth for the poor are identical to those enjoyed by the rest of the population.
*Growth is a necessary but not sufficient condition: although it is good for the poor, growth is seen as a necessary but not sufficient condition to eradicate poverty: «Economic growth is a crucial factor in poverty reduction, but the level of inequality affects its impact on poverty8». Inequality is
therefore a dimension that should not be omitted in the analysis of poverty reduction.
Despite the fact that it reduces poverty, economic growth in no way ensures that the corresponding gains will be distributed equitably among the different households. Ravallion [2] in his article entitled "Inequality is bad for the poor", considers that the integration of inequality or changes in the distribution of income is paramount since it is harmful to the poor. To reduce poverty, we must, therefore, not only focus on economic growth, but also on the struggle against a major socio-economic problem, namely the inequality between the haves and the have-nots. The analysis of poverty will therefore depend simultaneously on economic
6Perceived rather as a means of transferring technology Romer
(1990), Grossman and Helpman (1991), Barro (2001)
7 The elasticity of poverty in relation to growth is on average
equal to 1.
Samia Hmani| July.-August. 2017| Vol.6| Issue 4|35-48 37
growth and distribution, which in turn will affect each other.
According to the economic literature, economic growth can be seen as a source of poverty reduction, while the relationship between growth and inequality is not so obvious:
*For some it is in the form of the inverted U curve9: nonlinear relation.
*For others inequality increases with economic growth: linear relationship
Poverty reduction depends, therefore, on the combined effects of economic growth and distribution; with a certain supremacy of the distribution effect.
Review of the Literature
In the following, we present the various economic studies that have examined the relationship between FDI, poverty and inequality:
Fauzel, Seetanah and Vinesh examined the impact of FDI on poverty reduction in Mauritius, using time series data for the
period 1980-2013.
The results showed that FDI contributes to poverty reduction; With a relatively lower coefficient in the short term than in the long term. In addition, they found unidirectional causality from FDI to poverty reduction, and that FDI reduces poverty through the employment channel. Other factors have in turn contributed to poverty reduction such as public spending on trade openness.
Assadzadeh and Pourqoly [3] sought to examine the effects of FDI and institutional quality (Rule of Law) on poverty reduction. Using the Human Development Index as an indicator of poverty reduction over the period 2000-2009 for a panel of countries in the MENA region, they concluded that FDI and institutional quality have a significant positive effect on the reduction of poverty and consequently the improvement of well-being.
Focuses on the relationship between FDI and domestic investment and its impact on the economic growth of host countries. To do so, it uses a sample of 91 developing countries during the period 1970-2000 using
9 Kuznets (1955)
the Generalized Moments Method (GMM), and concluded that foreign investment
stimulates domestic investment. This
positive effect in low-income countries depends on the stock of human capital available in the economy.
Zaman, Mushtaq, Khan and Ikram [4] studied the relationship between growth, inequality and poverty in Pakistan during the period 1964-2006 and conclude that distribution variables have a positive impact on Poverty and that there is a short-term causality between economic growth and income inequality over poverty. This article by Zaman, Rachid, Khan and Ahmad [5].
Empirically examines the impact of economic growth and income inequality on poverty for a panel of developing countries over the period 1988-2009. The least squares estimation results show that if economic growth increases by 1%, poverty falls by 0.05%; While it decreased by 0.78% for an increase in income inequality of 1%.
This may be related to the recent wave of
privatization in developing countries.
Education and foreign direct investment have a positive impact on the process of poverty reduction. While that of trade opening and health expenditure is considered negligible.
Gohou and Soumaré [6] re-examined the
relationship between foreign direct
investment (FDI) and poverty reduction in Africa. To do this, this study was based on a sample of 52 African countries studied over a period from 1990 to 2007.
The authors selected net inflows of FDI per capita and the human development index adopted by the United Nations Development Program as the main variables. The results confirm the positive and highly significant relationship between net inflows of FDI and poverty reduction in Africa. However, they showed significant differences between African regions.
Samia Hmani| July.-August. 2017| Vol.6| Issue 4|35-48 38
and South Africa. Moreover, this relationship is considered ambiguous in West Africa.
Noomen Lahimer [7] sought to study the effects of FDI on poverty. For this purpose, he constructed a model of simultaneous equations applied to panel data for 18 countries in sub-Saharan Africa during the period 1990-2005.
It has subdivided the effects of FDI on poverty into two opposite effects: a growth effect and an inequality effect; He also tested
the causalities between growth and
inequalities via the Kuznets hypothesis. The results of this work show that the impact of FDI on poverty reduction is negative when the inequality effect is greater than the growth effect.
Ucal, Bilgin and Haug [8] seek to determine the impact of FDI and other determinants on inequality in Turkey over the period 1970-2008. For this they adopted an ARDL
modeling10. The empirical results obtained
indicate the existence of a cointegration relation between the variables. In the short term, FDI and growth have a positive impact on income inequality (worsening inequality), but this impact becomes quantitatively weak in the long term (at the 10% significance level).
In other words, FDI slightly increases income inequality initially, but this effect disappears in the long run. In turn, the literacy rate clearly reduces inequality both in the short and long term. As for population growth, it aggravates long-term inequalities (the effect is quite high), but in the short term the effect is not statistically significant on inequalities. Finally, an increase in GDP growth reduces inequality in particular in the short term (at a level of significance of 5%), but also in the long term (but only at the level of 10%).
McLaren and Im [9] studied the effects of FDI on income distribution and poverty in 127 developing countries over the period 1977-2012. They base their analysis on panel data using instrumental variables such as the attractiveness shock of FDI in neighboring countries and the discovery of oil in the host country. Without taking into account the instruments, FDI appears to have no effect on income inequality and a
10 Autoregressive distributed lag.
weak positive effect on poverty. By introducing instruments, in contrast to previous findings, FDI contributes to reducing both inequality and poverty in the host country.
In order to analyze whether foreign direct investment contributes to the generally large income gaps in five host countries in Latin America, namely Bolivia, Chile, Colombia, Mexico and Uruguay during the period 1980-2000; Herzer, Hühne and Nunnenkamp [10] conclude that the cointegration analysis reveals a positive and significant effect on income inequality in the short term. FDI contributed to the increase in the income gap in all the countries in the sample with the exception of Uruguay. Moreover, there is no inverse causality.
Chintrakarn, Herzer and Nunnenkamp [11] use panel data to study the relationship between foreign direct investment (FDI) and income inequality in the United States. Using cointegration techniques, they find that the short-term effects of FDI on income inequality are either insignificant or negative and of little significance; While in the long run, FDI has a significant and robust negative effect on income inequality in the United States. This result for the United States as a whole does not mean that long-term FDI reduces income gaps of the same magnitude in each state. There is considerable heterogeneity in the long-term effects of FDI on income inequality among states, with 21 states out of 48 (43% of states) having a positive relationship between FDI and income inequality.
In order to study the relationship between foreign direct investment (FDI) and income inequality for a sample of ten European countries over the period 1980 to 2000, Herzer and Nunnenkamp [12] use And conclude that: FDI has a positive effect in the short term on income inequality in Europe, the long-term effect of FDI on inequality is on average negative, we have a two-way causality relationship, long Term, such that an increase in FDI reduces income inequality and, in turn, greater inequality leads to a
decline in FDI inflows
Samia Hmani| July.-August. 2017| Vol.6| Issue 4|35-48 39
Thus, to understand the nature of the relationship between FDI and poverty is to
answer the following questions: Do
multinational firms play the role of a leverage first on economic growth and then on the reduction of poverty? Is there a compensation between the impact of FDI on inequality and the impact on growth? What is the ultimate impact on poverty?
Model Specification and Presentation of Variables
As some variables simultaneously influence FDI inflows, poverty and inequality, it is more appropriate to base our empirical study on a model with simultaneous equations in panel data. This type of model takes into account the interdependence and / or dual
status of certain variables, and considerably reduces the estimation bias equation by equation.
Specification of the Model
This model is based on a bilateral relationship between poverty and inequality. The introduction of FDI in the form of an external exogenous shock makes it possible to estimate its effect on poverty by taking into account its simultaneous effect on inequality. It therefore makes it possible to estimate the direct and indirect effects.
The model consists of two equations and ten variables, two of which are endogenous. To reduce the risk of endogeneity and avoid statistical bias, we will determine the matrix of correlation between the variables.
Table1: matrix of correlation
Moreover, and in order to maximize the number of degrees of freedom, the number of explanatory variables per equation will be restricted; In order to guarantee the
statistical validity of the results, especially since the number of observations is not high enough.
The system of equations is written as follows:
Ldcfmi,t Lithi,t + Lide i,t + Lgdpi,t+ Linvti,t
+ Ltsi,t it (E1)
Lithi,t Ldcfmi,t Lide i,t+ Lgdpi,t+ Louvi,t
+ Lteli,t + Linfi,t+ Lgdp2i,t it (E2)
0.8467 0.0000 0.0000 0.2894 0.1217 0.1428 0.0000 0.1630 0.0000 ltel -0.0089 0.2566* 0.4297* -0.0487 -0.0711 -0.0673 0.3501* -0.0641 -0.2751* 1.0000
0.7969 0.0000 0.0000 0.1766 0.2941 0.1154 0.0000 0.0000 linf -0.0118 -0.2265* -0.2714* 0.0621 0.0482 0.0723 -0.4811* 0.4522* 1.0000
0.7199 0.2209 0.0000 0.0056 0.2652 0.1614 0.0000 lts 0.0165 -0.0563 -0.1955* 0.1269* 0.0512 -0.0644 -0.6908* 1.0000
0.0556 0.0472 0.0000 0.0465 0.0536 0.0156 louv 0.0879 0.0911 0.3230* -0.0914 -0.0886 0.1110 1.0000
0.0000 0.2793 0.9452 0.0000 0.0002 linvt 0.2931* -0.0497 -0.0032 0.2063* 0.1691* 1.0000
0.0005 0.9028 0.1418 0.0000 lgdpg2 0.1592* 0.0056 0.0675 0.7597* 1.0000
0.0000 0.1953 0.1161 lgdpg 0.2665* -0.0595 0.0722 1.0000
0.2327 0.7595 lfdic -0.0549 -0.0141 1.0000
0.5163 lith -0.0299 1.0000
ldcfm 1.0000
Samia Hmani| July.-August. 2017| Vol.6| Issue 4|35-48 40
Where Ldcfm : represents the log of household final consumption expenditure per capita, Lith : represents the logarithm of Theil Index, Lide : represents the logarithm of FDI inflows to GDP, Lgdp :represents the
logarithm of per capita GDP, Linvt:
represents the logarithm of fbcf as a percentage of GDP, Louv: represents the logarithm of the ratio of the sum of imports and exports as a percentage of GDP, Lts :represents the logarithm of the share of the population accessing a secondary level in relation to the total population, Linf: represents the logarithm of the consumer price index, Ltel: represents the logarithm of the number of telephones per 100 persons et
Lgdp2 : représents the logarithm ofthe square
of per capita GDP.
The first equation, relating to poverty,
depends on FDI, growth, domestic
investment and humain capital; while the second, on inequality, depends on FDI, growth, trade openness, infrastructure, inflation and the square of per capita GDP.This last indicator is introduced in the model in order to verify the hypothesis of Kuznets [13]. FDI and economic growth are introduced as explanatory variables common to both equations.
It is a model with two equations, two endogenous variables: «Ldcfm» and «Lith» and eight exogenous variables: «Lide»,«Lgdp»,
«Lgdp2», «Linvt», «Louv»,«Lts» , «Linf» and
«Ltel» . The variable«Ldcfm» appears as an explanatory variable in the first equation and similarly for the variable «Lith» in the second equation; which is in contradiction with their status as endogenous variables.
Description of Variables
On the basis of the economic literature, our model consists of a series of variables generally used in this type of estimate:
*Endogenous variables:Poverty Indicator : final household consumption per capita constitutes, according to Ravallion [14] and
others 11 , the most reliable and stable
indicator compared to income. We will, therefore, consider the per capita final consumption expenditure rate as a measure of poverty.
11Woolard et Leibbrandt(1999), Odhiambo (2009), Kar, Agir et
Peker (2009)…
LDCFM : denotes the logarithm of household final consumption expenditure per capita in the country i at the time t.-Inequality Indicator: The measure of inequality most
commonly used is the Gini index12, but since
it is not available for a number of countries and for a number of years, the Theil index has been chosen. This has the advantage of being available for a large sample; it measures the gap between a uniform egalitarian distribution and a distributed distribution.The higher the index, the more dispersed the income (the more equitable the distribution of income).
LITH : represents the logarithm of Theil Index,
*Exogenous variables:Foreign Direct
Investment: In our study, we are interested in the inflows of FDI; mainly the ratio of net inflows of FDI as a percentage of GDP as a measure of FDI.
Lide : denotes the logarithm of FDI inflows to GDP in the country i at the time t.
Economic Growth: GDP per capita, often seen as an indicator of improvement in individual wealth or standard of living, is a good indicator of economic growth. We will use this indicator as a proxy for economic growth.
LGDP : denotes the logarithm of per capita GDP in the country i at the time t.
Domestic investment: This indicator informs us about the state of health of the economic environment in the host country. An increase in this indicator indicates good economic activity in this country. It is measured by the ratio of gross fixed capital formation to GDP.
Linvt: denotes the logarithm of fbcf as a
percentage of GDP in the country i at the time t
Trade Openness: this indicator is introduced in the model in order to take into account the influence of a trade integration policy on poverty. This indicator will therefore be
12The Gini coefficient takes into account the influence of
Samia Hmani| July.-August. 2017| Vol.6| Issue 4|35-48 41
measured by the sum of exports and imports of goods and services relative to GDP.
LOUV: represents the logarithm of the ratio of the sum of imports and exports as a percentage of GDP.
Human capital: it improves the productivity of individuals and their well-being. We assume that countries with better and wider access to education are generally expected to
have fewer income inequalities and
subsequently less poverty.
LTS:represents the logarithm of the share of the population accessing a secondary level in relation to the total population.
Inflation: the introduction of this variable in the model aims at capturing the impact of macroeconomic stabilization on poverty. This indicator will be measured by the Consumer Price Index.
LINF: represents the logarithm of the consumer price index
The number of telephones per 100 people: it represents the degree of development in the field of information and communication
technologies. It plays the role of
infrastructure in reducing poverty.
LTEL: represents the logarithm of the number of telephones per 100 persons.
Identification of the Model
In the case of simultaneous equation models, the estimation method depends on the model identification criterion13. This can be either:
under-identified, just-identified or over-identified.
We limit our analysis to the conditions of order of identification.The order condition is written as follows:
lj =1+ nj* + kj* ≥ n kj* ≥ njk ≥ kj + nj
where: lj =1+nj* + kj*, nj : number of
endogenous variables other than yj present in
equation, nj*:number of endogenous variables
absent from equation: n – nj– 1, kj : number of
exogenous variables present in equation, kj*:
13Bourbonnais. R (2003), " Econométrie", Dunod, 5ème édition,
Paris.
number of exogenous variables absent from equation: k – kj , n : number of endogenous
variables in the model, k: number of exogenous variables in the model.
According to the order condition relating to the first equation:
l1 = 1 + n1*+ k1*=1 +0 + 4 = 5 > 2 = n, over-identified equation.
And that relating to the second equation:
l2 =1+ n2*+ k2*= 1 + 0 +2 = 3 > 2 = n, over-identified equation.
The implementation of the ordering conditions shows that our model is over-identified, so the resolution of the model becomes possible and it is therefore necessary to use the most appropriate econometric methods.
Econometric Study
Descriptive Statistics and Preliminary Tests
The purpose of our study is to estimate the impact of foreign direct investment on reducing both poverty and inequality in the MENA countries, which generally includes all countries in the Middle East and Of North Africa. Our sample is made up of 19 countries14 divided by income based on the latest World Bank15 ranking (2014): 6 high-income countries (12,736$ or more),6 upper-middle-income countries (from 4,086$ to 12,735$) And 7 lower-middle-income countries (from 1,046$ to 4,126$).
Data used include indicators from the World Bank and the UNCTAD report. The study period is from 1990 to 2014. The technique used is that of panel data characterized by both individual and temporal analysis. Our study is still of interest since it is based on a sample of developed and developing countries; Despite a relatively low number of observations. Indeed, econometric studies of poverty and inequality have always been constrained by the quality and size of data.
14Algérie, Chypre, Egypte, Gaza, Iran, Israël, Jordanie,
Kuwait, Liban, Malte, Maroc, Mauritanie, Oman, Qatar, Soudan, Syrie, Tunisie, Turquie, Yemen.
15
Samia Hmani| July.-August. 2017| Vol.6| Issue 4|35-48 42 Before performing the specification tests, we
will first describe the main variables used in the subsequent estimates:
*The per capita household final consumption indicator has an average per capita of 1.24; Whereas for the Theil index, corresponding to the inequality indicator, the average is rather negative in the order of -2.65. The final
consumption distribution of households is rather symmetrical as the median is equivalent to the mean whereas the inequality indicator does not.
Evolution on average of growth, FDI, Consumption Finale des Ménage and Theil index: Countries of the MENA region
Source: graphic made by the author
*The average for the foreign direct investment indicator is 1.72. This is the indicator with the highest dispersion of data.Our sample has two extreme values equivalent to: -11.84 corresponding to Algeria for 1993, this fall in foreign investment can be explained by the uncertain and unstable climate that characterized Algeria following the conflicts that exposed the government to the groups extremists and 6.83 corresponding to Malta for the year 2011, corresponding to the various revolutions that the countries of the MENA region mainly Tunisia, Libya, Egypt ...
*Economic growth, represented by the Gross Domestic Product per capita, has an average of 1.07 for our sample, this one does not have extreme value.
In the following, we will first carry out tests relating to stationarity, collinearity bi-varied and collinearity multi-varied:
*Tests of stationarity: Using the tests, the results obtained show that all variables are stationary in level.
*The bi-varied correlation or collinearity test: all the coefficients corresponding to the different correlation matrices illustrating the links between the variables are less than 8%
and consequently we can conclude that there
is no problem of correlation or multi-collinearity between the various variables16.
*The multivariate collinearity test: the study of the multi-collinearity relative to our sample shows that all the values of the "VIF" do not exceed the tolerated limit of namely 10, which makes it possible to exclude the existence of the problem of multi-collinearity.
Given the existence of problems of endogeneity and simultaneity, we will opt for techniques of triple least squares namely: triple least squares, double least squares and triple least squares iterative.
Results of Estimates and interpretations
Overall Sample
In the following, we will present the panel data estimates for the period 1990-2014 for the countries of the MENA region. These estimates are, respectively, summarized in Table 1.
A- Poverty Equation
In the following, we are interested in the direct effects on poverty of the endogenous variable: the Theil index and exogenous variables: foreign direct investment,
16The correlation matrix allows the detection of the bi-varied multi
collinearity, in our analysis we will refer to the limit set by Kennedy (1985) namely 8%.
-4
-2
0
2
4
1990 1995 2000 2005 2010 2015
Années
ldcfm lith
Samia Hmani| July.-August. 2017| Vol.6| Issue 4|35-48 43 economic growth, domestic investment and humain capital.
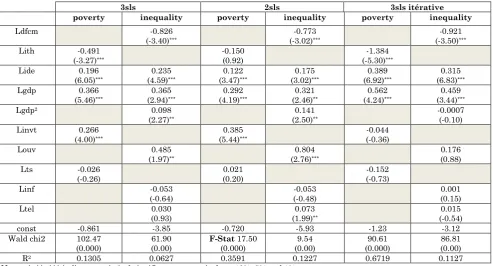
Table 2: Estimation of the simultaneous equation model: MENA countries
3sls 2sls 3sls itérative
poverty inequality poverty inequality poverty inequality
Ldfcm 0.134
(0.76) (0.75) 0.134 (0.76) 0.134 Lith -0.005
(-0.04) (-0.04) -0.005 (-0.04) -0.005 Lide 0.38
(1.77)*
-0.064 (-2.48)**
0.038 (1.77)*
-0.063 (-2.40)**
0.038 (1.77)*
-0.064 (-2.48)**
Lgdp 0.207 (4.86)***
-0.121 (-1.85)*
0.207 (4.82)***
-0.123 (-1.85)*
0.207 (4.86)***
-0.121 (-1.85)*
Lgdp2 (0.045
(1.73)*
0.045 (1.75)*
0.044 (1.73)*
Linvt 0.264 (6.35)***
0.264 (6.30)***
0.264 (6.35)***
Louv -0.294
(-2.13)**
-0.314 (-2.25)**
-0.294 (-2.13)**
Lts -0.015 (-0.56)
-0.014 (-0.51)
-0.015 (-0.56)
Linf -0.156
(-3.99)***
-0.155 (-3.94)***
-0.156 (-3.99)***
Ltel 0.089
(5.06)***
0.089 (5.02)***
0.089 (5.06)***
const 0.641 -1.31 0.624 -1.23 0.641 -1.31 Wald chi2 87.32***
(0.000)
51.19***
(0.00)
F- stat 17.20 (0.00)
7.15 (0.000)
87.33***
(0.000)
51.19***
(0.000) R2 0.154 0.0912 0.154 0.0913 0.154 0.0912
Note : *, **, *** indicate statistical significance respectively at 10%, 5% and 1%.
For the three estimation methods:
*The coefficient corresponding to foreign direct investment is positive and significant, of the order of 0.038; that is, any increase in FDI by 1 point translates into an increase in household final consumption or a reduction in poverty of 0.38. Our results are consistent with those of Zaman, Hassan and Gul [15] for Pakistan and Gohou and Soumaré [6] for Africa.
*The one relating to economic growth is positive and significant. An increase in growth of 1 point leads to a poverty reduction of 0.207 (significant at 1%). This beneficial effect on poverty is the indirect consequence of FDI. Indeed, according to Dollar and Kraay [16] the elasticity of poverty in relation to growth is 1 on average.
*For domestic investment the coefficient is of the order of 0.26 and significant at 1%. Poverty decreases by 0.26 for any increase in domestic investment by 1 percentage point. This corresponds to a training effect between the two types of investment.
*The coefficient corresponding to the humain capital is negative and not significant. Education therefore has no impact on household final consumption and hence on poverty.
This can be explained by the fact that the labor force that is used by FDI is unskilled. Indeed, multinational firms once decided to settle, set the number of low-skilled employees to hire and use technologies that go hand in hand with the level of qualification of the workers of the host country.Seeking to maximize their profit, these firms with their passive behavior, are only committed to offer training cycles to improve the productivity of the employees.
Equation of Inequality
Through this equation, we will develop the indirect effects on poverty through inequality. For the three estimation methods:
*Foreign direct investment has a negative and significant impact at the threshold of 10% on inequalities for all estimation methods.
Samia Hmani| July.-August. 2017| Vol.6| Issue 4|35-48 44
Similarly, Herzer and Nunnenkamp [11] conclude that FDI has a long-term negative effect on income inequality in Europe.
*The growth coefficient is negative and significant at the threshold of 5% and 10%. So an improvement in the economic growth of 1point reduces the inequalities by 0.12 concludes that there is a long-term negative relationship between economic growth and income inequality, whereas for the impact of inequality on growth is rather negative for poor countries and Positive in rich countries.
Economic growth, in its impact on inequality, goes hand in hand with FDI.
*Trade openness, inflation 17 and
infrastructure 18 all have positive and
significant coefficients (with different degrees of significance), thus exacerbating inequalities.
In light of these results, we can conclude that foreign direct investment directly reduces both poverty and inequality; As well as indirectly through economic growth and domestic investment (training effect).
To better understand these results, and given the heterogeneity of our overall sample, we will subdivide it into sub-samples based on the income criterion.
Sub-Samples
Our aggregate sample will be broken down into three sub-samples, namely high-income countries (PRE), upper-middle-income (RITS) and lower-middle-upper-middle-income (RITI).
The main results are summarized in the following tables:
Poverty Equation
The effect of foreign direct investment is not the same for all sub-samples:
*For countries with (RITI), FDI affects negatively and significantly the final
17As an indicator of macroeconomic stability, inflation has an
impact on productive investment, mainly long-term investment.
18This indicator is characterized by a reduction in factor costs,
an improvement in competitiveness and thus an improvement in the quality of life of the poor.
consumption of households, which aggravates the situation of the most deprived, thus increases poverty.
*For countries with (RITS) the coefficient is rather positive and significant, leading to a reduction in poverty for any increase in FDI flows.
*For countries (PRE) the coefficient is positive for all regressions but significant for only one.
Economic Growth is
*Relatively, beneficial only to middle-income countries, where the coefficient is positive and significant for all regressions: any increase in growth, increases household final consumption and thus reduces poverty.
*For countries (PRE) the coefficient is negative and not significant. So growth has relatively little effect on poverty.
For the three sub-samples, domestic investment has a positive and significant impact on household final consumption, leading to a reduction in poverty.
The FDI has a training effect on domestic
investment, thus enabling the
improvement of living conditions. The highest coefficient is recorded in the countries with (RITS) where the population is more homogeneous.
The humain capital rate has no impact on household final consumption and hence on poverty for middle-income countries, while for high-income countries the coefficient is negative. Nearly identical finding for both methods.
Equation of Inequality
Samia Hmani| July.-August. 2017| Vol.6| Issue 4|35-48 45
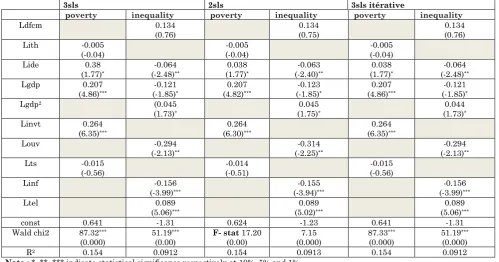
Table 3: Estimation of the simultaneous equation model: MENA Countries (RITI)
3sls 2sls 3sls itérative
poverty inequality poverty inequality poverty inequality
Ldfcm 2.89
(2.44)**
1.63
(1.30) 11.89 (1.33) Lith 0.064
(0.12)
0.094 (0.17)
0.063 (0.12) Lide -0.164
(-3.13)*** 0.528 (2.10)** -0.156 (-2.92)*** 0.328
(1.25) (-3.10)-0.165 ***
1.96 (1.03) Lgdp 0.504
(6.86)*** -1.45 (-2.44)** 0.464 (6.05)*** -0.810 (-1.25) 0.505 (6.84)*** -6.02 (-1.35)**
Lgdp2 -0.027
(-0.82) -0.031 (-0.44) -0.006 (-0.04) Linvt 0.004
(0.14) (2.04)0.138 **
0.0005 (-0.04)
Louv -1.43
(-1.31)**
-1.62 (-1.44)**
-0.002 (-0.01) Lts 0.003
(0.03) (0.16) 0.015 (0.03) 0.002
Linf -0.234
(-1.57)
-0.265 (-1.46)
-0.012 (-0.01)
Ltel 0.055
(1.62) 0.062 (1.44) 0.009 (0.04) const 1.23 0.255 0.868 2.51 1.25 -15.91 Wald chi2 54.41
(0.000) 125.17 (0.000) F-Stat(0.000) 11.35 (0.000) 0.63 (0.000) 41. 54 (0.000) 85.32 R2 0.2305 0.1858 0.2467 0.1048 0.2292 0.1015
Note : *, **, *** indicate statistical significance respectively at 10%, 5% and 1%.
Table 4: Estimation of the simultaneous equation model: MENA countries (RITS)
3sls 2sls 3sls itérative
poverty inequality poverty inequality poverty inequality
Ldfcm -0.826 (-3.40)***
-0.773 (-3.02)***
-0.921 (-3.50)***
Lith -0.491 (-3.27)***
-0.150
(0.92) (-5.30)-1.384 ***
Lide 0.196 (6.05)*** 0.235 (4.59)*** 0.122 (3.47)*** 0.175 (3.02)*** 0.389 (6.92)*** 0.315 (6.83)***
Lgdp 0.366 (5.46)*** 0.365 (2.94)*** 0.292 (4.19)*** 0.321 (2.46)** 0.562 (4.24)*** 0.459 (3.44)***
Lgdp2 0.098
(2.27)**
0.141 (2.50)**
-0.0007 (-0.10) Linvt 0.266
(4.00)***
0.385 (5.44)***
-0.044 (-0.36)
Louv 0.485
(1.97)**
0.804 (2.76)***
0.176 (0.88) Lts -0.026
(-0.26) (0.20) 0.021 (-0.73) -0.152
Linf -0.053
(-0.64)
-0.053 (-0.48)
0.001 (0.15)
Ltel 0.030
(0.93) (1.99)0.073 **
0.015 (-0.54) const -0.861 -3.85 -0.720 -5.93 -1.23 -3.12 Wald chi2 102.47
(0.000) (0.00) 61.90 F-Stat(0.000) 17.50 (0.00) 9.54 (0.000) 90.61 (0.00) 86.81 R2 0.1305 0.0627 0.3591 0.1227 0.6719 0.1127
Note : *, **, *** indicate statistical significance respectively at 10%, 5% and 1%.
Table 5: Estimation of the simultaneous equation model: MENA countries (PRE)
3sls 2sls 3sls itérative
poverty inequality poverty inequality poverty inequality
Ldfcm 0977
(2.70)***
0.889 (2.38)**
1.005 (2.60)***
Lith 0.0.78
(0.62) (0.26) 0.035 0.087 (0.70) Lide 0.063
(1.04) -0.417 (-6.52)*** 0.054 (0.88) -0.431 (-6.30)*** 0.065 (1.08) -0.412 (-6.13)***
Lgdp -0.076
(-1.04) (-1.02)0.096 (-1.16)-0.087 (-1.32)-0.128 -0.074 (-1.01) (-0.85)-0.085
Samia Hmani| July.-August. 2017| Vol.6| Issue 4|35-48 46
(0.37) (1.53) (0.07)
Linvt 0.149 (2.02)*
0.190 (2.27)**
0.140 (2.05)**
Louv -1.832
(5.45)**
-1.67 (-4.57)***
-1.888 (-5.42)***
Lts -0.206 (-2.86)***
-0.165 (-2.00)**
-0.215 (-3.21)***
Linf 0.040
(0.59) (-0.85)-0.073 (0.46)0.029
Ltel 0.192
(3.52)***
0.222 (3.55)***
0.181 (3.33)***
const 3.48 -3.85 0.283 -4.24 3.621 5.20 Wald chi2 18.30
(0.000)
117.24 (0.00)
F-stat 3.46 (0.000)
15.10 (0.00)
18.67 (0.000)
108.86 (0.00) R2 0.1125 0.2239 0.1119 0.2975 0.1115 0.1909
Note: *, **, *** indicate statistical significance respectively at 10%, 5% and 1%.
The impact of economic growth on inequality is negative and significant for countries (RITI), thus reducing disparity between classes. For countries (RITS) the coefficient oscillates between significant and not significant. Finally, for countries (PRE) the coefficient is negative and significant, any increase in FDI flows reduces inequalities.
The impact of trade openness on inequality is negative and significant for both samples (RITI) and (PRE), thus indirectly reducing poverty. While it is positive and significant for the sample (RITS).
Infrastructure affects positively and significantly the inequality in countries (RITS) and (PRE). Infrastructure improvements, considered as attracting FDI, are normally expected to reduce inequality; this is not the case for the two samples. No effect for countries (RITI).
The inflation indicator, on the other hand, is negative and significant for some regressions for middle-income countries, thus reducing inequality and poverty by improving purchasing power.
These results can be explained by the fact that our sample is not homogeneous and therefore the FDI is not all of the same nature, rather it corresponds to the characteristics relative to each country. This
heterogeneity of the sample has resulted in the overall effect of FDI reducing poverty.
Analysis of Inequality: Verification of the Kuznets Curve
The objective of introducing the square per
capita GDP into the equation of inequality is
to capture the long-term effect of economic growth on the level of inequality. Indeed, according to Kuznets, the long-term
relationship between economic growth and inequality must have the inverted "U" shape corresponding to three phases: a first phase known as the transition phase, where inequalities increase as a result of improved Growth, then a so-called stabilization phase characterized by the fact that the inequalities reach their maximum level corresponding to the turning point and finally the so-called redistribution phase where the inequalities decrease as a result of the increase in growth.
In our case the coefficient relative to the square of per capita GDP in relation to the inequalities is positive and significant. This leads us to conclude that for our sample the relationship between inequality and growth is not "U" inverted, as Kuznets claims, but rather linear: the more growth increases, the greater the inequality.
Evolution on average of the Theil index: Countries of the MENA region
Source: graphic made by the author
-2.8
-2.7
-2.6
-2.5
lith
1990 1995 2000 2005 2010 2015
Samia Hmani| July.-August. 2017| Vol.6| Issue 4|35-48 47 This result is confirmed by the graphical
representation of the evolution of the inequality for our sample where only the first two phases are realized; these countries have not yet reached the third so-called redistribution phase, they have stagnated in the so-called stabilization phase since 2007 and have not yet reached the turning point.
Our results are in line with those of The results of their study do not satisfy the Kuznets hypothesis for the majority of countries: for 40 countries out of 49 there is no statistically significant relationship between growth and inequality, for 4 countries the curve is rather U and not in inverted U.
For countries (PRE), we can not comment on the nature of the inequality relationship given that the coefficient is positive and not significant. For countries (RITS), this coefficient is positive and significant, leading to an increase in inequality over time (rising phase or stabilization phase of the Kuznets curve). Paradoxically, for the countries (RITI) this coefficient is negative and significant thus verifying the Kuznets hypothesis of the inverted U-relation (downward phase of this curve and thus reduction of inequalities).
Our results are therefore consistent with the theoretical predictions that taking into account the distribution of income is paramount in the reduction of poverty. The most effective way to reduce poverty is therefore to reduce inequality through better redistribution of wealth.
In the light of these results, some recommendations may be made, namely:
*The FDI that characterizes the MENA region is of the NORD-South type, whereas it is preferable that the latter, mainly the developing countries, is more interested in South-South FDI where the distributional consequences are better.
*These South-South investments consist of multilateral firms from developing countries
directing their investments to other developing countries; Which would enable some countries to improve both their economic growth and the living conditions of their populations.
*This type of investment is beneficial since the conditions in the host countries are similar to those in the countries of origin. The main sectors where this type of investment is concentrated are mining, infrastructure, services...
*Except that, despite the advantages of this South-South investment, it has the disadvantage of competition from northern firms with better sources of financing [15-24].
Conclusion
The main objective of this research was to assess the impact of foreign direct investment on poverty reduction and inequality in the MENA countries.
The approach adopted in this work is distinguished, firstly, by the econometric methodology adopted, which involves a panel analysis in simultaneous equations for the same sample of countries.Then, the distribution of the overall sample into three subsamples according to the World Bank's income-based classification. And finally, the importance of integrating inequalities in the study of the impact of FDI on poverty; without neglecting the analysis of the relationship between economic growth and inequality via the Kuznets curve.
Based on the results of this simultaneous equation analysis, we can conclude that foreign direct investment directly reduces both poverty and inequality; and indirectly through economic growth and domestic investment. These results also confirm that there is a driving effect between foreign direct investment and domestic investment.Moreover, all our samples stagnate at the level of the stabilization phase and have therefore not reached the so-called redistribution phase. The curve is in this case linear and not in «U inverted ».
References
1. Dollar David ET, Aart Kraay (2002b)
« Institutions, Trade, and Growth ». Journal of Monetary Economics. 50:133:162.
2. Ravallion Martin (2001) Growth, Inequality and
Poverty: Looking Beyond Averages », World Development, 29(11): 1803-1815.
3. Assadzadeh ET, Pourqoly (2013) the Relationship
Samia Hmani| July.-August. 2017| Vol.6| Issue 4|35-48 48 Quality and Poverty: Case of MENACountries »,
Journal of Economics, Business and Management.
4. Zaman Khalid, Khan Muhammad Mushtaq,
Mehboob Ahmad, Waseem Ikram (2010)An Empirical Analysis of Growth, Inequality and Poverty Triangle in Pakistan: Cointegration
Approach (1964-2006)»International Research
Journal of Finance and Economics, Issue 46,
5. Zaman Khalid, Kashif Rashid, Khan Muhammad
Mushtaq, Mehboob Ahmad (2011)Panel Data Analysis of Growth, Inequality and Poverty: Evidence From SAAR Countries», Journal of Yaşar University, 21(6):3523-3537.
6. Gohou Gaston, Soumare Issouf (2012) Does Foreign
Direct Investment Reduce Poverty in Africa and
are There Regional Differences?», World
Development, 40(1):75-95.
7. Lahimer N (2009) Investissements directs
étrangers et investissements domestiques en Afrique Subsaharienne: effet d’éviction ou de stimulation? » Université Paris-Dauphine
8. Ucal Meltem et al (2014) Income Inequality and
FDI: Evidence with Turkish Data », June 2014, Online at http://mpra.ub.uni-muenchen.de/61104/
9. Im Hyejoon ET McLaren John (2015) Does Foreign
Direct Investment Raise IncomeInequality in
Developing Countries? A NewInstrumental
Variables Approach », 10th March 2015, The Lahore Journal of Economics. 137–157
10. Herzer Hühne, et Nunnenkamp (2014) FDI and
Income Inequality - Evidence from Latin American Economies », University of Otago, Economics Discussion Papers No. 1407, 2014
11. Herzer et, Nunnenkamp (2012) The Effect of
Foreign Aid on Income Inequality: Evidence from Panel Cointegration, Kiel Working Paper No. 1762
12. Herzer et al (2012) FDI and Income Inequality:
Evidence from Latin American Economies», Kiel Working Paper n°1791, August
13. Kuznets S (1955) Economic Growth and Income
Inequality», The American Economic Review, Vol 45, N°1 (March), 1-28
14. Ravallion Martin (2003a) Measuring Aggregate
Welfare in Developing Countries: How Well do National Accounts and Surveys Agree? », Review of Economics and Statistics, 85, 645-652.
15. Zaman Khalid, HassanSyeda Anam et Gul Shah
(2015) The Relationship between
Growth-Inequality-Poverty Triangle and Environmental Degradation: Unveiling the Reality », Arab Economic and Business Journal, 10, (1):5771. 16. Dollar D, ET Kraay A (2000) Growth is Good for
the Poor», The World Bank Policy Research
Working Paper 2587.
17. Chao-Hsi Huang, Kai-Fang Teng, Pan-Long Tsai
(2010) Inward and outward foreign direct
investment and poverty: East Asia vs. Latin America», Rev World Econ 146, 763:779.
18. Dollar David, et Aart Kraay (2002a) Growth is
good for the poor ». Journal of Economic.
19. Growth. 7(3):195-225.
20. Dollar David, et Aart Kraay (2004) Trade, Growth,
and Poverty », Economic Journal. 114 (493): 22-49.
21. Elsadig Musa, Ahmed (2012) Are the FDI inflow
spillover effects on Malaysia's economic growth input driven?», Economic Modelling.
22. Kakwani N, Prakash BET, Son H (2000) Growth,
Inequality, and Poverty: An Introduction », Asian Development Review 18(2):1–21.
23. Ravallion Martin (2003b) The Debate on
Globalization, Poverty and Inequality: Why Measurement Matters », International Affairs, 79(4): 739-754.
24. Zaman Khalid, Khilji Bashir Ahmed (2013)The