ARTIGO ORIGINAL
Career Satisfaction of Medical Residents in
Portugal
Satisfação com a Especialidade entre os Internos da Formação Específica em
Portugal
1. Faculdade de Psicologia e Ciências da Educação. Universidade de Coimbra. Coimbra. Portugal. 2. Serviço de Oftalmologia. Centro Hospitalar e Universitário de Coimbra. Coimbra. Portugal. 3. Faculdade de Medicina da Universidade de Coimbra. Coimbra. Portugal.
4. Serviço de Cardiologia. Centro Hospitalar do Porto. Porto. Portugal.
5. Serviço de Cardiologia A. Centro Hospitalar e Universitário de Coimbra. Coimbra. Portugal. 6. Serviço de Cardiologia. Centro Hospitalar de Lisboa Central. Lisboa. Portugal.
7. Serviço de Oncologia Médica. Instituto Português de Oncologia Francisco Gentil. Porto. Portugal. 8. Serviço de Cirurgia Cardiotorácica. Centro Hospitalar São João. Porto. Portugal.
9. Departamento de Fisiologia e Cirurgia Cardiotorácica. Faculdade de Medicina da Universidade do Porto. Porto. Portugal. 10. Serviço de Cirurgia Vascular. Centro Hospitalar de São João. Porto. Portugal.
11. Serviço de Gastroenterologia. Hospital de Santo António dos Capuchos. Centro Hospitalar de Lisboa Central. Lisboa. Portugal. 12. Serviço de Cardiologia. Hospital de Santa Maria. Centro Hospitalar de Lisboa Norte. Lisboa. Portugal.
13. Serviço de Medicina. Hospital da Luz. Lisboa. Portugal.
14. Serviço de Cardiologia. Centro Hospitalar de Vila Nova de Gaia/Espinho. Vila Nova de Gaia. Portugal. 15. Unidade de Investigação Cardiovascular. Faculdade de Medicina. Universidade do Porto. Porto. Portugal. 16. Serviço de Neurologia. Centro Hospitalar Entre o Douro e Vouga. Santa Maria da Feira. Portugal. 17. Serviço de Medicina Interna. Centro Hospitalar de São João. Porto. Portugal.
18. Serviço de Cardiologia. Centro Hospitalar do Baixo Vouga. Aveiro. Portugal.
19. Serviço de Dermatologia. Hospital de Santa Maria. Centro Hospitalar de Lisboa Norte. Lisboa. Portugal. 20. Serviço de Oncologia Cirúrgica. Instituto Português de Oncologia Francisco Gentil. Porto. Portugal. 21. Serviço de Dermatovenerologia. Hospital Distrital de Santarém. Santarém. Portugal.
22. Serviço de Dermatovenerologia. Centro Hospitalar de São João. Porto. Portugal.
23. Departamento de Ginecologia e Obstetrícia. Hospital de Santa Maria. Centro Hospitalar Lisboa Norte. Lisboa. Portugal. 24. Departamento de Oftalmologia. Centro Hospitalar de São João. Porto. Portugal.
25. Serviço de Urologia. Hospital de Braga. Braga. Portugal.
26. Instituto de Ciências da Vida e da Saúde. Universidade do Minho. Braga. Portugal.
27. Departamento de Ética e Deontologia Médica. Faculdade de Medicina de Lisboa. Lisboa. Portugal. 28. Serviço de Oftalmologia. Hospital de Santa Maria. Centro Hospitalar Lisboa Norte. Lisboa. Portugal. 29. Serviço de Ginecologia/Obstetrícia. Hospital de Braga. Braga. Portugal.
30. Serviço de Radiologia. Hospital de São João. Porto. Portugal. 31. Serviço de Gastroenterologia. Hospital Beatriz Ângelo. Loures. Portugal. 32. Serviço de Gastroenterologia. Centro Hospitalar do Alto Ave. Guimarães. Portugal.
33. Department of Psychosis Studies. Institute of Psychiatry, Psychology and Neuroscience. King´s College. London. United Kingdom. Recebido: 13 de Outubro de 2014 - Aceite: 16 de Fevereiro de 2015 | Copyright © Ordem dos Médicos 2015
Maria João MARTINS1, Inês LAÍNS2,3, Bruno BROCHADO4, Manuel OLIVEIRA-SANTOS5, Pedro PINTO TEIXEIRA6, Mariana BRANDÃO7, Rui João CERQUEIRA8,9, Ricardo CASTRO-FERREIRA10, Carlos BERNARDES11, Miguel NOBRE MENEZES12, Bernardo SOARES BAPTISTA13, Ricardo LADEIRAS-LOPES14,15, Mariana CRUZ REI16, Gilberto PIRES DA ROSA17, José Luis MARTINS18, Maria MENDONÇA SANCHES19, Manuel J. FERREIRA-PINTO8,20, Margarida RATO21, Miguel COSTA E SILVA22, Catarina POLICIANO23, João BEATO24, João BARBOSA-BREDA24, João PIMENTEL TORRES25,26,
Inês LEAL27,28, Sílvia AGUIAR ROSA11, Bárbara CARVALHO RIBEIRO29, Francisco REGO COSTA30, Carolina PALMELA31, Tiago CÚRDIA GONÇALVES32, Luis MORAIS4, Tiago REIS MARQUES33
Acta Med Port 2015 Mar-Apr;28(2):209-221
ABSTRACT
Introduction: The satisfaction with the medical profession has been identified as an essential factor for the quality of care, the
wellbe-ing of patients and the healthcare systems’ stability. Recent studies have emphasized a growwellbe-ing discontent of physicians, mainly as a result of changes in labor relations.
Objectives: To assess the perception of Portuguese medical residents about: correspondence of residency with previous expectations;
degree of satisfaction with the specialty, profession and place of training; reasons for dissatisfaction; opinion regarding clinical practice in Portugal and emigration intents.
Material and Methods: Cross-sectional study. Data collection was conducted through the “Satisfaction with Specialization Survey”,
created in an online platform, designed for this purpose, between May and August 2014.
Results: From a total population of 5788 medical residents, 804 (12.25 %) responses were obtained. From this sample, 77% of the
responses were from residents in the first three years. Results showed that 90% of the residents are satisfied with their specialty, 85% with the medical profession and 86% with their place of training. Nevertheless, results showed a decrease in satisfaction over the final years of residency. The overall assessment of the clinical practice scenario in Portugal was negative and 65% of residents have plans to emigrate after completing their residency.
Conclusion: Portuguese residents revealed high satisfaction levels regarding their profession. However, their views on Portuguese
clinical practice and the results concerning the intent to emigrate highlight the need to take steps to reverse this scenario.
ARTIGO ORIGINAL
INTRODUCTION
Becoming a medical doctor is still one of the most attractive careers in Portugal. In fact, every year the Medicine degree is the most highly sought and the one with the most difficult access. Public awareness regarding Medicine, as well as perceived social and financial advantages associated to this profession have contributed to this reality. It would therefore be expected that physicians should be fulfilled and happy with their professional life. It is currently recognized that physicians´ satisfaction with their profession has not only an individual impact but is also reflected in patients´ health and in terms of Public Health. Patients attended by physicians considering themselves as very or extremely satisfied with their work have higher levels of satisfaction with medical care than those attended by dissatisfied physicians.1 In addition, dissatisfied physicians are more unhealthy, with higher chances of unjustified absenteeism2 and with more psychological and even burn-out problems.3 In terms of public health, a good balance between all medical specialties is fundamental for high standards of quality in the health system. This balance has been changed with the outflow of physicians from less attractive specialties to other perceived as more advantageous.4,5 Over the last few years, in Portugal, some
job positions remained vacant due to the fact that doctors opted for other specialties, compromising the future of specialized and general healthcare.
Several international studies show that professional satisfaction is globally high in the medical community, with around 85% of physicians moderately or very satisfied with their profession.6,7 This has been found to occur among
doctors undergoing speciality training8,9 and those that have
completed their speciality training.10,11 However, differences
between specialties are significant and Infectious Disease, Dermatology and Paediatrics showed higher professional satisfaction in the largest study carried out to date, while other specialties such as Obstetrics / Gynaecology, Respiratory Medicine and ENT Surgery were at the opposite end.12
A reduction in self-satisfaction within the medical profession has been found over the last few years, due to changes in the profession’s reputation, loss of autonomy, increase in administrative work and workload accompanied by a salary reduction. In fact, in a 2001 study, 58% of 2,608 American physicians described that their passion with Medicine had declined over the previous five years, whilst 87% described a decline in their sense of well-being over that period of time.13 Economic short-term factors such as payment and work conditions are also expected to affect professional satisfaction. The importance of the economic behaviour was shown in a recent study where satisfaction of Norwegian physicians was compared to those of their Icelandic colleagues living under a profound recession upon the 2008 economic crisis.14 Satisfaction of Icelandic was significantly lower than Norwegian physicians in that study, already controlled for individual and work-related factors. The same authors, in another study, aimed to determine the impact that the same crisis had on migration of Icelandic physicians. In a group of 465 physicians, corresponding to 55% of all Icelandic specialists, 63% of physicians were considering emigration within a short period of time.15 Despite its importance and relevance, professional satisfaction was never assessed in Portuguese physicians undergoing specialty training. Our study is the first aimed at assessing satisfaction as well as analysing differences between specialties.
MATERIAL AND METHODS Participants
Speciality-physician trainees contacts listed in a specific database “Exame da Especialidade” project (www. examedaespecialidade.com) were contacted and invited to participate in the study. This database included 5,788 physicians in training corresponding to 88.19% of the 6,563 physicians undergoing postgraduate training in Portugal. A survey was sent by email and 804 physicians who agreed to participate replied to the questionnaire. This number
RESUMO
Introdução: A satisfação com a profissão médica tem sido apontada como um fator essencial para a qualidade assistencial, o
bem-estar dos doentes e a estabilidade dos sistemas de saúde. Estudos recentes têm vindo a enfatizar um crescente descontentamento dos médicos, principalmente como consequência das alterações das relações laborais.
Objetivos: Avaliar a perceção dos médicos de formação específica em Portugal, sobre as expectativas e grau de satisfação com a
profissão, especialidade e local de formação; razões da insatisfação e intenção de emigrar.
Material e Métodos: Estudo transversal. A colheita de dados foi efetuada entre Maio e Agosto de 2014 através de um Inquérito online
sobre a “Satisfação com a Especialidade”.
Resultados: De uma população total de 5788 médicos, foram obtidas 804 respostas (12,25% do total de médicos internos). Desta
amostra, 77% das respostas correspondem a internos dos três primeiros anos de formação. Verificou-se que 90% dos médicos se encontram satisfeitos com a especialidade, tendo-se encontrado também níveis elevados de satisfação com a profissão (85%) e local de formação (86%). Por outro lado, constatou-se que estes diminuíam com a progressão ao longo dos anos de internato. A avaliação global sobre o panorama da prática médica foi negativa e 65% dos médicos responderam que consideram emigrar após conclusão do internato.
Conclusão: Os médicos internos em Portugal apresentam níveis positivos de satisfação com a sua profissão. No entanto, a sua
opinião sobre o panorama da Medicina e os resultados relativos à intenção de emigrar alertam para a necessidade de tomada de medidas para inverter este cenário.
ARTIGO ORIGINAL corresponds to a 12.25% response rate from the total of
postgraduate medical trainees in Portugal.
Instruments
Satisfaction survey with the medical specialty chosen
This instrument was specifically designed for our study and used a model and questions similar to those published in other studies that assessed satisfaction within a medical specialty.7,8,10-13 The questionnaire included 15 dichotomous
questions (Yes/No) or used a 10-point Likert scale, allowing for the results to be ranked into five groups: Extremely Dissatisfied = 1 and 2; Very Dissatisfied = 3 and 4; Neutral = 5 and 6; Very Satisfied = 7 and 8; Extremely Satisfied = 9 and 10. This questionnaire assessed the physician’s subjective perception regarding his/her specialty in terms of: meeting expectations; level of satisfaction; reasons for dissatisfaction; satisfaction with the place of training; satisfaction with the profession; medical practice; intention to emigrate. Questionnaires were sent by email using the SurveyMonkey® software that allows for a single response per user alone thus preventing any result duplication.
Procedure and statistical analysis
Our group of participants included physicians in training in Portugal. In order to control for possible biases, the analysis took into account year of training, specialty and place of training. Statistical accuracy and representativeness of results were ensured by analysing only specialties and places of training with 10 or more responses. As regards the latter, in order to remove the possible influence of dissatisfaction with one’s specialty on the assessment of satisfaction with the place of training, an adjusted analysis only included physicians showing a score of 5 or higher values as regards satisfaction with their specialty (value showing a minimal satisfaction with the specialty, maximum = 10). The sub-population of physicians whose specialty was their first choice was also analysed. SPSS software version 20.0 was used for the statistical analysis.
RESULTS Sample
The number of physicians by specialty and place of training is shown in Table 1A and 1B. As regards the distribution by year of training, we found that most responses corresponded to physicians on their first years of training: 32% (n = 238) in their first, 27% (n = 217) in their second, 18% (n = 143) in their third, 15% (n = 118) in their fourth, 5% (n = 37) in their fifth and 0.2% (n = 2) in their sixth year of training.
Global results
Resident’s choice of specialty
The current specialty was the first choice for most
participants (n = 611; 81%), while 19% (n = 191) were attending a specialty that was their second choice. When asked whether, having had the chance, they would have chosen the same specialty once again, 85% of participants responded affirmatively (n = 632; 85%). A sub-analysis with only those physicians currently attending to a specialty that ¨was not their first choice” (n = 191) found that 57% (n = 109) would not change specialty.
Expectations regarding the specialty
Most resident physicians consider that their current specialty corresponded greatly or even entirely to what was expected (Fig. 1A). The results by year of training show that reality corresponded with expectations in all years of training. However, physicians on their first year of training considered their expectations closer to reality (M = 4.28; SD = 0.83) with a decline throughout training (Fig. 1A).
Level of satisfaction with the specialty
Most physicians described themselves as extremely or very satisfied with their specialty and only 10% were very or extremely dissatisfied (Fig. 1B). The analysis by year of training found a decline in satisfaction throughout training (1st year – M = 4.29, SD = 1; 2nd year – M = 4.11, SD = 1.13; 3rd year – M = 4.06, SD = 1.01; 4th year – M = 4.02, SD
= 1.09; 5th year – M = 3.73, SD = 1.36). When asked about
the reasons for dissatisfaction, 47% described their clinical practice conditions as the major reason for dissatisfaction, 23% described the specialty’s real setting, 16% the place of training and 14% described other reasons.
Level of satisfaction with the place of training
Most participants were very or extremely satisfied with the place chosen for their specific training (Fig. 1C), whilst only 14% described themselves as very or extremely dissatisfied. As training progressed, a decline in satisfaction with the specialty was found.
Level of satisfaction with the profession
When asked whether they would choose to study Medicine again, most responses were positive (N = 632; 85%), although a decline in that intention was found throughout training (1st year: 92.2%; 2nd year: 75.4%; 3rd
year: 72.5%; 4th year: 75.9%; 5th year: 80%).
Medical practice in Portugal
Most participants thought that medical practice deteriorated and no participant ever considered there was any significant improvement (Fig. 1D). The analysis per year of training found a negative progression as training progressed.
Emigration and job search abroad
ARTIGO ORIGINAL
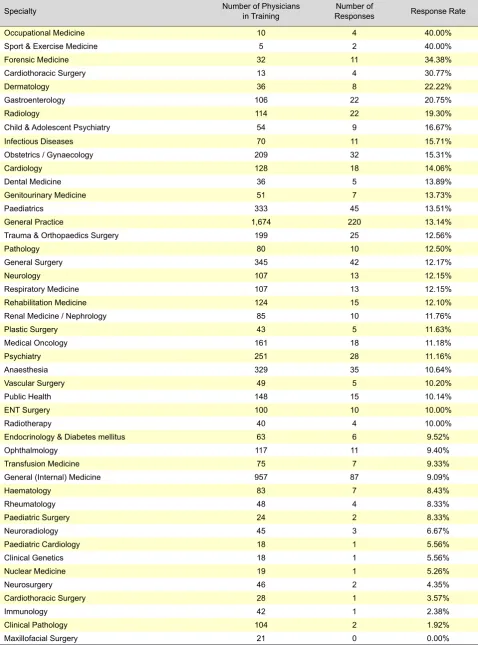
Table 1A - Number of physicians in training by specialty. number of responses and response rates
Specialty Number of Physicians in Training ResponsesNumber of Response Rate Hospital Responses Percentage of total responses
Occupational Medicine 10 4 40.00% Centro Hospitalar de São João 46 9.40%
Sport & Exercise Medicine 5 2 40.00% Centro Hospitalar e Universitário de Coimbra 44 9.00%
Forensic Medicine 32 11 34.38% Centro Hospitalar de Lisboa Central 43 8.80%
Cardiothoracic Surgery 13 4 30.77% Centro Hospitalar de Lisboa Norte 41 8.40%
Dermatology 36 8 22.22% Centro Hospitalar do Porto 37 7.50%
Gastroenterology 106 22 20.75% Centro Hospitalar de Lisboa Ocidental 26 5.30%
Radiology 114 22 19.30% Centro Hospitalar de Vila Nova de Gaia-Espinho 21 4.30%
Child & Adolescent Psychiatry 54 9 16.67% Hospital Garcia de Orta 18 3.70%
Infectious Diseases 70 11 15.71% Hospital Prof. Doutor Fernando Fonseca 17 3.50%
Obstetrics / Gynaecology 209 32 15.31% Hospital de Braga 16 3.30%
Cardiology 128 18 14.06% Centro Hospitalar Algarve 14 2.90%
Dental Medicine 36 5 13.89% ULS Matosinhos 14 2.90%
Genitourinary Medicine 51 7 13.73% IPO Lisboa 11 2.20%
Paediatrics 333 45 13.51% Centro Hospitalar Alto Ave 10 2.00%
General Practice 1,674 220 13.14% Centro Hospitalar do Baixo Vouga 9 1.80%
Trauma & Orthopaedics Surgery 199 25 12.56% IPO Porto 8 1.60%
Pathology 80 10 12.50% Centro Hospitalar de Leiria 7 1.40%
General Surgery 345 42 12.17% Centro Hospitalar de Tondela-Viseu 7 1.40%
Neurology 107 13 12.15% Centro Hospitalar de Setúbal 6 1.20%
Respiratory Medicine 107 13 12.15% Centro Hospitalar Trás-os-Montes e Alto Douro 6 1.20%
Rehabilitation Medicine 124 15 12.10% Centro Hospitalar Psiquiátrico de Lisboa 6 1.20%
Renal Medicine / Nephrology 85 10 11.76% Hospital Espírito Santo Évora 6 1.20%
Plastic Surgery 43 5 11.63% Hospital Dr. Nélio Mendonça - Funchal 6 1.20%
Medical Oncology 161 18 11.18% ULS Nordeste 6 1.20%
Psychiatry 251 28 11.16% ULS Alto Minho 6 1.20%
Anaesthesia 329 35 10.64% Centro Hospitalar Barreiro Montijo 5 1.00%
Vascular Surgery 49 5 10.20% Centro Hospitalar Cova da Beira 5 1.00%
Public Health 148 15 10.14% Centro Hospitalar de Entre o Douro e Vouga 5 1.00%
ENT Surgery 100 10 10.00% Hospital Distrital de Santarém 5 1.00%
Radiotherapy 40 4 10.00% ULS Baixo Alentejo 5 1.00%
Endocrinology & Diabetes mellitus 63 6 9.52% Hospital Beatriz Ângelo 4 0.80%
Ophthalmology 117 11 9.40% Hospital Divino Espírito Santo Ponta Delgada 4 0.80%
Transfusion Medicine 75 7 9.33% Hospital Vila Franca de Xira 4 0.80%
General (Internal) Medicine 957 87 9.09% HPP Cascais 3 0.60%
Haematology 83 7 8.43% Centro Hospitalar do Tâmega e Sousa 3 0.60%
Rheumatology 48 4 8.33% IPO Coimbra 3 0.60%
Paediatric Surgery 24 2 8.33% Cuf Descobertas 2 0.40%
Neuroradiology 45 3 6.67% Hospital da Horta 2 0.40%
Paediatric Cardiology 18 1 5.56% Hospital de Magalhães Lemos 2 0.40%
Clinical Genetics 18 1 5.56% ULS Norte Alentejano 2 0.40%
Nuclear Medicine 19 1 5.26% ULS Guarda 2 0.40%
Neurosurgery 46 2 4.35% Hospital de Santo Espírito de Angra do Heroísmo 1 0.20%
Cardiothoracic Surgery 28 1 3.57% Hospital Santa Maria Maior - Barcelos 1 0.20%
Immunology 42 1 2.38% ULS Castelo Branco 1 0.20%
Clinical Pathology 104 2 1.92% ULS Litoral Alentejano 1 0.20%
ARTIGO ORIGINAL Tablel 1B - Number of responses and response rates per Hospital
Table 1A - Number of physicians in training by specialty. number of responses and response rates
Specialty Number of Physicians in Training ResponsesNumber of Response Rate Hospital Responses Percentage of total responses
Occupational Medicine 10 4 40.00% Centro Hospitalar de São João 46 9.40%
Sport & Exercise Medicine 5 2 40.00% Centro Hospitalar e Universitário de Coimbra 44 9.00%
Forensic Medicine 32 11 34.38% Centro Hospitalar de Lisboa Central 43 8.80%
Cardiothoracic Surgery 13 4 30.77% Centro Hospitalar de Lisboa Norte 41 8.40%
Dermatology 36 8 22.22% Centro Hospitalar do Porto 37 7.50%
Gastroenterology 106 22 20.75% Centro Hospitalar de Lisboa Ocidental 26 5.30%
Radiology 114 22 19.30% Centro Hospitalar de Vila Nova de Gaia-Espinho 21 4.30%
Child & Adolescent Psychiatry 54 9 16.67% Hospital Garcia de Orta 18 3.70%
Infectious Diseases 70 11 15.71% Hospital Prof. Doutor Fernando Fonseca 17 3.50%
Obstetrics / Gynaecology 209 32 15.31% Hospital de Braga 16 3.30%
Cardiology 128 18 14.06% Centro Hospitalar Algarve 14 2.90%
Dental Medicine 36 5 13.89% ULS Matosinhos 14 2.90%
Genitourinary Medicine 51 7 13.73% IPO Lisboa 11 2.20%
Paediatrics 333 45 13.51% Centro Hospitalar Alto Ave 10 2.00%
General Practice 1,674 220 13.14% Centro Hospitalar do Baixo Vouga 9 1.80%
Trauma & Orthopaedics Surgery 199 25 12.56% IPO Porto 8 1.60%
Pathology 80 10 12.50% Centro Hospitalar de Leiria 7 1.40%
General Surgery 345 42 12.17% Centro Hospitalar de Tondela-Viseu 7 1.40%
Neurology 107 13 12.15% Centro Hospitalar de Setúbal 6 1.20%
Respiratory Medicine 107 13 12.15% Centro Hospitalar Trás-os-Montes e Alto Douro 6 1.20%
Rehabilitation Medicine 124 15 12.10% Centro Hospitalar Psiquiátrico de Lisboa 6 1.20%
Renal Medicine / Nephrology 85 10 11.76% Hospital Espírito Santo Évora 6 1.20%
Plastic Surgery 43 5 11.63% Hospital Dr. Nélio Mendonça - Funchal 6 1.20%
Medical Oncology 161 18 11.18% ULS Nordeste 6 1.20%
Psychiatry 251 28 11.16% ULS Alto Minho 6 1.20%
Anaesthesia 329 35 10.64% Centro Hospitalar Barreiro Montijo 5 1.00%
Vascular Surgery 49 5 10.20% Centro Hospitalar Cova da Beira 5 1.00%
Public Health 148 15 10.14% Centro Hospitalar de Entre o Douro e Vouga 5 1.00%
ENT Surgery 100 10 10.00% Hospital Distrital de Santarém 5 1.00%
Radiotherapy 40 4 10.00% ULS Baixo Alentejo 5 1.00%
Endocrinology & Diabetes mellitus 63 6 9.52% Hospital Beatriz Ângelo 4 0.80%
Ophthalmology 117 11 9.40% Hospital Divino Espírito Santo Ponta Delgada 4 0.80%
Transfusion Medicine 75 7 9.33% Hospital Vila Franca de Xira 4 0.80%
General (Internal) Medicine 957 87 9.09% HPP Cascais 3 0.60%
Haematology 83 7 8.43% Centro Hospitalar do Tâmega e Sousa 3 0.60%
Rheumatology 48 4 8.33% IPO Coimbra 3 0.60%
Paediatric Surgery 24 2 8.33% Cuf Descobertas 2 0.40%
Neuroradiology 45 3 6.67% Hospital da Horta 2 0.40%
Paediatric Cardiology 18 1 5.56% Hospital de Magalhães Lemos 2 0.40%
Clinical Genetics 18 1 5.56% ULS Norte Alentejano 2 0.40%
Nuclear Medicine 19 1 5.26% ULS Guarda 2 0.40%
Neurosurgery 46 2 4.35% Hospital de Santo Espírito de Angra do Heroísmo 1 0.20%
Cardiothoracic Surgery 28 1 3.57% Hospital Santa Maria Maior - Barcelos 1 0.20%
Immunology 42 1 2.38% ULS Castelo Branco 1 0.20%
Clinical Pathology 104 2 1.92% ULS Litoral Alentejano 1 0.20%
ARTIGO ORIGINAL
and searching for a job abroad at the end of residency. The analysis by year of training found a percentage increase in physicians with the intention to emigrate as training progressed. Therefore, whilst on the first year only 53% considered to emigrate (2nd year – 62%; 3rd year – 76% and 4th year - 73%) around 75% considered this possibility by the last year of training. The most described reasons were financial (41%) and the lack of working opportunities (31%). Around 20% of the participants selected the option ‘other’ which in most cases regards the combination of different reasons with 10% regarding a lack of employment.
Results by specialty
Sub-analyses by specialty were carried out, aimed at understanding variation by specialty. In a total of 47 medical specialties in Portugal, only those in which at least 10 responses were obtained were analysed. Therefore, only 22 of the 47 specialties were analysed.
Expectations with the specialty
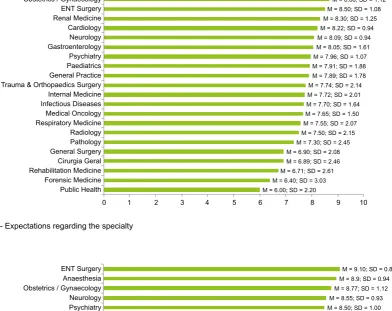
Despite important differences between specialties, all scored above 5, showing that results were globally positive. Anaesthesia, Obstetrics/Gynaecology and ENT Surgery were those specialties that physicians thought corresponded more frequently with their expectations (Fig. 2A).
Level of satisfaction with the specialty
ENT Surgery (M = 9.1; SD = 0.88), Anaesthesia (M = 8.97; SD = 0.94) and Obstetrics/Gynaecology (M = 8.77; SD = 1.12) physicians were those describing a higher level of satisfaction. Lower levels were found in Forensic Medicine (M = 5.5; SD = 3.03), Public Health (M = 6; SD = 2.80) and General Surgery (M = 6.47; SD = 2.79).
Specialty choice
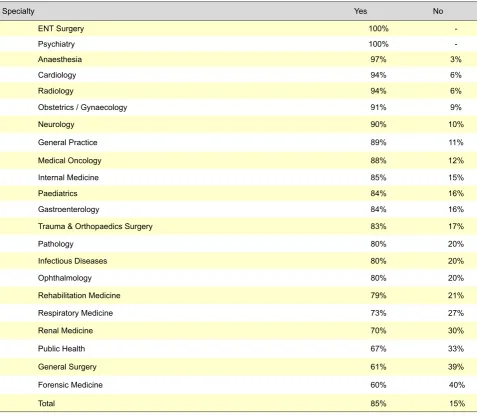
ENT Surgery, Psychiatry and Anaesthesia physicians were those more likely to choose the same specialty, given a second chance. In contrast, Public Health, General Surgery Figure 1A – Expectations regarding the specialty Figure 1B – Level of satisfaction with the specialty
Figure 1D – Medical practice in Portugal
Figure 1C – Level of satisfaction with the place of training
50% 60%
40% 40%
30%
20% 20%
10%
2% 4.4%
Do not correspond at all Extremely dissatisfied
5% 5.7%
Shortly correspond Dissatisfied
10% 7.7%
Neutral Satisfied
46% 36.2%
Mostly correspond Very satisfied
37% 46.0%
Fully correspond Extremely satisfied
0% 0%
40% 40%
20% 30% 20% 30%
10% 10%
Extremely dissatisfied Relevant improvement
Dissatisfied Improved a little
Satisfied
The same Very satisfied
Large decline Extremely satisfied
0% 0%
5% 0%
9% 2%
14%
17% 34%
ARTIGO ORIGINAL
Figure 2B – Level of satisfaction with the specialty
Anaesthesia
and Forensic Medicine physicians were those more likely to change their specialty (Table 2A).
Future prospects and job search abroad
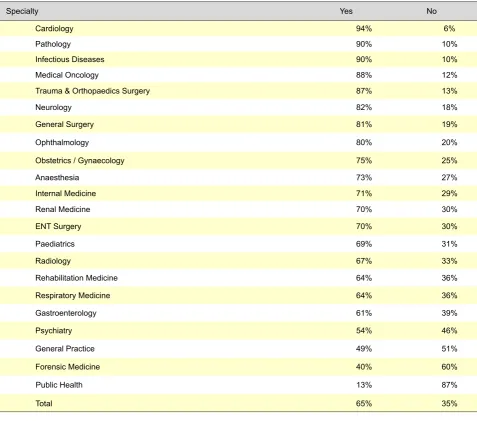
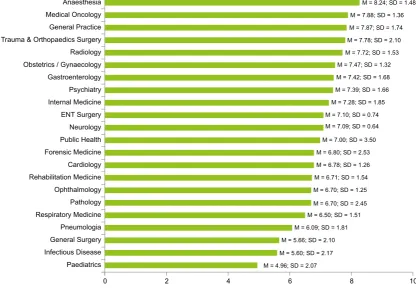
Anaesthetists were those considering that their specialty offered them more future prospects, followed by Medical Oncology and General Practice, whilst Paediatrics scored below the 5-point cut-off (Fig. 3). General Practice, Forensic Medicine and Public Health physicians were those less likely to consider emigration, whilst Cardiology, Pathology
and Infectious Disease physicians were those more prone to consider it (Table 2B).
Results by place of training
Sub-analyses by place of training were carried out, aimed at understanding satisfaction variations by place of training. Due to statistical reasons, USF (Unidades de
Saúde Familiar) were not analysed, as the low number of
resident physicians in this speciality would prevent a robust statistical analysis.
Figure 2A - Expectations regarding the specialty
0
0
Anaesthesia M = 8.79; SD = 1.09
M = 9.10; SD = 0.88 Obstetrics / Gynaecology
Obstetrics / Gynaecology
M = 8.66; SD = 1.12
M = 8.9; SD = 0.94 ENT Surgery
ENT Surgery
M = 8.50; SD = 1.08
M = 8.77; SD = 1.12 Renal Medicine
Renal Medicine
M = 8.30; SD = 1.25
M = 8.55; SD = 0.93 Cardiology
Cardiology
M = 8.22; SD = 0.94
M = 8.50; SD = 1.00 Neurology
Neurology
M = 8.09; SD = 0.94
M = 8.37; SD = 0.83 Gastroenterology
Gastroenterology
M = 8.05; SD = 1.61
M = 8.33; SD = 1.58 Psychiatry
Psychiatry
M = 7.96; SD = 1.07
M = 8.33; SD = 1.08 Paediatrics
Paediatrics
M = 7.91; SD = 1.88
M = 8.17; SD = 2.27 General Practice
General Practice
M = 7.89; SD = 1.78
M = 8.00; SD = 1.83 Trauma & Orthopaedics Surgery
Trauma & Orthopaedics Surgery
M = 7.74; SD = 2.14
M = 7.86; SD = 2.07 Internal Medicine
Internal Medicine
M = 7.72; SD = 2.01
M = 7.80; SD = 2.44 Infectious Diseases
Infectious Diseases
M = 7.70; SD = 1.64
M = 7.61; SD = 2.38 Medical Oncology
Medical Oncology
M = 7.65; SD = 1.50
M = 7.60; SD = 2.11 Respiratory Medicine
Respiratory Medicine
M = 7.55; SD = 2.07
M = 7.59; SD = 1.70 Radiology
Radiology
M = 7.50; SD = 2.15
M = 7.45; SD = 2.34 Pathology
Pathology
M = 7.30; SD = 2.45
M = 7.20; SD = 2.53 General Surgery
Ophthalmology
M = 6.90; SD = 2.08
M = 7.18; SD = 2.23 Cirurgia Geral
General Surgery
M = 6.89; SD = 2.46
M = 7.07; SD = 2.76 Rehabilitation Medicine
Rehabilitation Medicine
M = 6.71; SD = 2.61
M = 6.47; SD = 2.79 Forensic Medicine
Forensic Medicine
M = 6.40; SD = 3.03
M = 6.00; SD = 2.80 Public Health
Public Health
M = 6.00; SD = 2.20
ARTIGO ORIGINAL Table 2A - Would choose the same specialty
Specialty Yes No Specialty Yes No
ENT Surgery 100% - Cardiology 94% 6%
Psychiatry 100% - Pathology 90% 10%
Anaesthesia 97% 3% Infectious Diseases 90% 10%
Cardiology 94% 6% Medical Oncology 88% 12%
Radiology 94% 6% Trauma & Orthopaedics Surgery 87% 13%
Obstetrics / Gynaecology 91% 9% Neurology 82% 18%
Neurology 90% 10% General Surgery 81% 19%
General Practice 89% 11% Ophthalmology 80% 20%
Medical Oncology 88% 12% Obstetrics / Gynaecology 75% 25%
Internal Medicine 85% 15% Anaesthesia 73% 27%
Paediatrics 84% 16% Internal Medicine 71% 29%
Gastroenterology 84% 16% Renal Medicine 70% 30%
Trauma & Orthopaedics Surgery 83% 17% ENT Surgery 70% 30%
Pathology 80% 20% Paediatrics 69% 31%
Infectious Diseases 80% 20% Radiology 67% 33%
Ophthalmology 80% 20% Rehabilitation Medicine 64% 36%
Rehabilitation Medicine 79% 21% Respiratory Medicine 64% 36%
Respiratory Medicine 73% 27% Gastroenterology 61% 39%
Renal Medicine 70% 30% Psychiatry 54% 46%
Public Health 67% 33% General Practice 49% 51%
General Surgery 61% 39% Forensic Medicine 40% 60%
Forensic Medicine 60% 40% Public Health 13% 87%
Total 85% 15% Total 65% 35%
Level of satisfaction with the place of training
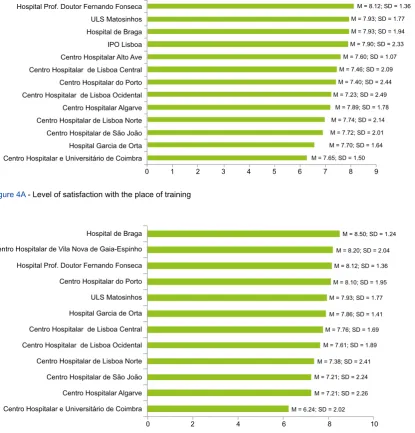
The big Hospital Centres (Centros Hospitalares [CH]), such as the CH Universitário de Coimbra, the CH São João
and the CH Lisboa Norte were those where physicians described lower satisfaction, whilst the CH Vila Nova de Gaia and the Hospital Prof. Dr. Fernando Fonseca were those with higher satisfaction (Fig. 4). In order to control the possible effect of satisfaction with one’s specialty on satisfaction with the place of training, a sub-analysis was carried out adjusted to that variable and only physicians with a satisfaction score of 5 or above (on a 1 to 10 scale) were considered. Satisfaction was higher in Braga Hospital, CH Vila Nova de Gaia/Espinho and in Hospital Prof. Dr. Fernando Fonseca vs. CH São João, CH do Algarve and CH Universitário de Coimbra at the other end (Fig. 5).
Results for the sub-sample of physicians whose
specialty was their first choice
An analysis aimed to control for specialty having not been the first choice considered only physicians whose
current specialty was their first choice.
Expectations regarding the specialty
Most physicians consider that their specialties largely (48%) or entirely (41%) corresponded with reality found, 7% gave a neutral response while 4% considered that slightly or did not correspond at all.
Level of satisfaction with the specialty
We found that 52% of participants were extremely, 36% were very, 7% were satisfied, 3% were dissatisfied and 2% extremely dissatisfied with their specialty. When asked if they would choose the same specialty again, 91% of the participants (n = 550) responded affirmatively.
Analysis according to specialty
ARTIGO ORIGINAL Table 2B - Emigration and job search abroad
Table 2A - Would choose the same specialty
Specialty Yes No Specialty Yes No
ENT Surgery 100% - Cardiology 94% 6%
Psychiatry 100% - Pathology 90% 10%
Anaesthesia 97% 3% Infectious Diseases 90% 10%
Cardiology 94% 6% Medical Oncology 88% 12%
Radiology 94% 6% Trauma & Orthopaedics Surgery 87% 13%
Obstetrics / Gynaecology 91% 9% Neurology 82% 18%
Neurology 90% 10% General Surgery 81% 19%
General Practice 89% 11% Ophthalmology 80% 20%
Medical Oncology 88% 12% Obstetrics / Gynaecology 75% 25%
Internal Medicine 85% 15% Anaesthesia 73% 27%
Paediatrics 84% 16% Internal Medicine 71% 29%
Gastroenterology 84% 16% Renal Medicine 70% 30%
Trauma & Orthopaedics Surgery 83% 17% ENT Surgery 70% 30%
Pathology 80% 20% Paediatrics 69% 31%
Infectious Diseases 80% 20% Radiology 67% 33%
Ophthalmology 80% 20% Rehabilitation Medicine 64% 36%
Rehabilitation Medicine 79% 21% Respiratory Medicine 64% 36%
Respiratory Medicine 73% 27% Gastroenterology 61% 39%
Renal Medicine 70% 30% Psychiatry 54% 46%
Public Health 67% 33% General Practice 49% 51%
General Surgery 61% 39% Forensic Medicine 40% 60%
Forensic Medicine 60% 40% Public Health 13% 87%
Total 85% 15% Total 65% 35%
Expectations regarding the specialty
The highest expectations were found in the area of Anaesthesia (M = 8.97; SD = 0.95), Obstetrics/Gynaecology (M = 8.67; SD = 1.15) and Neurology (M = 8.3; SD = 0.67), followed by Cardiology (M = 8.24; SD = 0.97), Radiology (M = 8.14; SD = 1.29), Gastroenterology (M = 8.12; SD = 1.62); General Practice (M = 8.09; SD = 1.63); Internal Medicine (M = 8.06; SD = 1.65), Psychiatry (M = 8.04; SD = 1.02), Trauma & Orthopaedics Surgery (M = 7.73; SD = 2.19); Medical Oncology (M = 7.71; SD = 1.44) and General Surgery (M = 7.26; SD = 2.14).
Level of satisfaction with the specialty
Anaesthesia obtained once again the highest average score (M = 9.03; SD = 0.87), followed by Obstetrics/ Gynaecology (M = 8.76; SD = 1.12); Neurology (M = 8.7; SD = 0.82); Psychiatry (M = 8.52; SD = 0.96); Gastroenterology (M = 8.47; SD = 0.80); Radiology (M = 8.36; SD = 1.39); Cardiology (M = 8.29; SD = 1.10); General Practice (M = 8.17; SD = 1.73); Trauma & Orthopaedics Surgery (M =
8.14; SD = 2.32); Medical Oncology (M = 8; SD = 1.47); Paediatrics (M = 7.97; SD = 1.97); Internal Medicine (M = 7.71; SD = 1.84) and General Surgery (M = 6.84; SD = 2.58).
Future prospects
Highest prospect was found within Anaesthesia (M = 8.26; SD = 1.48), Medical Oncology (M = 8.07; SD = 1.27) and General Practice (M = 8; SD = 1.61), Trauma & Orthopaedics Surgery (M = 7.73; SD = 2.14); Radiology (M = 7.57; SD = 1.65); Internal Medicine (M = 7.56; SD = 1. 56); Gastroenterology (M = 7.41; SD = 1.70); Obstetrics/ Gynaecology (M = 7.37; SD = 1.30); Psychiatry (M = 7.2; SD = 1.66) and Neurology (M = 7.2; SD = 1.69). Cardiology (M = 6.71; SD = 1.26); General Surgery (M = 5.84; SD = 1.86). Paediatrics (M = 5; SD = 2.11) had the lowest prospects.
DISCUSSION
ARTIGO ORIGINAL results suggested that only 10% were dissatisfied with their specialty, while 78% described themselves as very
or extremely satisfied. These results were in line with similar studies carried out in Western countries, where 85% satisfaction rates (satisfied or very satisfied) with the profession were obtained7 and also with studies involving resident physicians from other nationalities. Portuguese literature is very scarce, although in a recent study involving General Practice trainee physicians working in the north of Portugal, 91% were satisfied or very satisfied with their specialty, supporting the results found in our study.17 However, although this was not a longitudinal study, a decline in satisfaction was found throughout training and physicians in the final years of training described a lower satisfaction with the specialty when compared to younger colleagues. This may be due to different factors, such as higher professional demand in the final years of training, fading of the first years’ initial enthusiasm or differences in working conditions described by physicians in the final years of training due to the present economic crisis occurring in Portugal. Knowing the reasons for dissatisfaction would be an important contribution in order to resolve them. In the near future, more detailed studies should try to assess the reasons for dissatisfaction, while some actions should be taken to prevent it, including information campaigns, the creation of trainee commissions and promotion of interaction with the Hospital’s Residency Program Committee, among others. Therefore, despite the satisfaction shown, it is worrying to observe that 81% of the physicians considered
the presence of a relevant decline in clinical practice conditions in Portugal over the last few years, whilst only 2% of resident physicians considered that it actually improved. It is expected that the levels of satisfaction will decline even further in the near future.
As a possible impact of this perception, that work conditions are deteriorating, 65% of trainee physicians described considering emigration by the end of their specialty training. This percentage increased to around 75% by the final year of training, when a decision has to be made. These data were in line with those recently found in Iceland, a very affected country by the 2008 economic crisis, with 63% of Icelandic physicians considering emigration in a near future and professional satisfaction having a statistically significant impact on such decision.15 These were relevant data requiring a reflection about the ways healthcare should be managed in Portugal. At a time that Portugal is facing a significant ageing of physicians and where some places still have rates of physician per inhabitant below what is recommended, physician’s emigration may become not only an economic but also a public health issue. The impact of physician’s emigration is huge and involves economic and social concerns. Costs of pre and postgraduate training of a trainee physician in Portugal may reach 300 to 400,000 Euros, a price too high to be wasted with emigration upon training. Socially, emigration further aggravates physician shortage in Portugal and young specialist emigration contributes to a dramatic increase in physician’s ageing already found in Portugal. At the same
Figure 3 - Future prospects by specialty
0
Anaesthesia M = 8.24; SD = 1.48
Obstetrics / Gynaecology
M = 7.88; SD = 1.36
ENT Surgery
M = 7.87; SD = 1.74
Respiratory Medicine
M = 7.78; SD = 2.10
Cardiology
M = 7.47; SD = 1.32 M = 7.72; SD = 1.53
Neurology
M = 7.42; SD = 1.68 Gastroenterology
M = 7.39; SD = 1.66 Psychiatry
M = 7.28; SD = 1.85
Paediatrics
M = 7.10; SD = 0.74 General Practice
M = 7.09; SD = 0.64 Trauma & Orthopaedics Surgery
M = 7.00; SD = 3.50 Internal Medicine
M = 6.80; SD = 2.53
Infectious Disease
M = 6.78; SD = 1.26 Medical Oncology
M = 6.71; SD = 1.54
Pneumologia
M = 6.70; SD = 1.25 Radiology
M = 6.70; SD = 2.45 Pathology
M = 6.50; SD = 1.51 Ophthalmology
M = 6.09; SD = 1.81
General Surgery M = 5.66; SD = 2.10
Rehabilitation Medicine Forensic Medicine
M = 5.60; SD = 2.17 Public Health
M = 4.96; SD = 2.07
ARTIGO ORIGINAL
Figure 4A - Level of satisfaction with the place of training
Figure 4B - Level of satisfaction with the place of training, controlled according to satisfaction
time it deprives the population from an ambitious working force, with great working capacity and in contact with the most recent medical techniques.
In addition, the results regarding the change of specialty or even of medical profession deserve some reflection. As the Medical course is one of the most frequently chosen by high school students, it would not be expected that such relevant percentage of trainee physicians would not intend to study Medicine ever again if going back in time. However, these data are very similar to those found in a Canadian study involving 415 resident physicians, in which 22% considered not choosing to study Medicine given a second choice, while 15% considered changing their specialty.18 Even higher percentages were found in American studies, where 30% of physicians had described not intending to study Medicine again if given a second chance,19 while 40%
would not recommend the Medical course to any young people about to enter University.20
Comparative data by specialty are difficult to interpret due to the reduced number of similar studies and to conflicting results. In fact, while some studies showed that specialties such as Radiology had shown higher levels of satisfaction,18 others showed Dermatology or Infectious Disease, instead.12 The disparity of our results when compared to previous studies may be due to several factors associated not only to the specific Portuguese reality, but also to the fact that the population in our study only included trainee physicians. We found that General Surgery, Forensic Medicine and Public Health had the lowest levels of satisfaction. As these are specialties with little in common regarding daily medical practice, we were not able to identify one single factor responsible for these low levels M = 8.24; SD = 1.48
0
0
Centro Hospitalar de Vila Nova de Gaia-Espinho
Centro Hospitalar de Vila Nova de Gaia-Espinho
M = 8.20; SD = 2.04
M = 8.50; SD = 1.24 Hospital Prof. Doutor Fernando Fonseca
Hospital Prof. Doutor Fernando Fonseca
M = 8.12; SD = 1.36
M = 8.20; SD = 2.04 ULS Matosinhos
ULS Matosinhos
M = 7.93; SD = 1.77
M = 8.12; SD = 1.36 Hospital de Braga
Hospital de Braga
M = 7.93; SD = 1.94
M = 8.10; SD = 1.95
IPO Lisboa M = 7.90; SD = 2.33
M = 7.93; SD = 1.77 Centro Hospitalar Alto Ave M = 7.60; SD = 1.07
M = 7.86; SD = 1.41 Centro Hospitalar de Lisboa Central
Centro Hospitalar de Lisboa Central
M = 7.46; SD = 2.09
M = 7.76; SD = 1.69 Centro Hospitalar do Porto
Centro Hospitalar do Porto
M = 7.40; SD = 2.44
M = 7.61; SD = 1.89 Centro Hospitalar de Lisboa Ocidental
Centro Hospitalar de Lisboa Ocidental
M = 7.23; SD = 2.49
M = 7.38; SD = 2.41 Centro Hospitalar Algarve
Centro Hospitalar Algarve
M = 7.89; SD = 1.78
M = 7.21; SD = 2.24 Centro Hospitalar de Lisboa Norte
Centro Hospitalar de Lisboa Norte
M = 7.74; SD = 2.14 Centro Hospitalar de São João
Centro Hospitalar de São João
M = 7.72; SD = 2.01 Hospital Garcia de Orta
Hospital Garcia de Orta
M = 7.70; SD = 1.64 Centro Hospitalar e Universitário de Coimbra
Centro Hospitalar e Universitário de Coimbra
M = 7.65; SD = 1.50
M = 6.24; SD = 2.02 M = 7.21; SD = 2.26
1 2
2
3 4
4
5 6
6
7 8
8
9
ARTIGO ORIGINAL of satisfaction. We may speculate that several factors may explain dissatisfaction such as workload in General Surgery
or the low relevance given in the University programs to Public Health and to Forensic Medicine. However, until more in-depth studies are carried out, any explanation is mere speculation. In addition, we found that, generally the Central Hospitals (such as the CHUC, CH São João and Lisboa Norte) showed the lowest levels of satisfaction. These results may have shown that training in bigger hospitals, with lower personal component where competition is necessarily higher, may explain lower levels of satisfaction. The presence of an Emergency Department is another factor that may eventually explain why working in Central Hospitals may display lower levels of satisfaction. These normally attend a larger and more complex population, increasing the workload which becomes more frequent and more demanding and in this way influence physician’s satisfaction with training.These results should consider the differences between the Hospitals regarding the number of specialties and their influence on the results presently found. Therefore, while in a Central Hospital the number of specialties with trainee physicians is quite significant, in a smaller-dimension Hospital trainee physicians concentrate in a small number of specialties. This factor was taken into consideration in our study, adjusted according to the number of specialties, selecting only the results above a certain limit. However, this statistical approach is questionable and levels of satisfaction between Hospitals should be carefully analysed.
Our study carries several limitations. First of all, even though the response rate involves only 12% of the resident physicians in Portugal, it is in line with other international studies and the absolute number of responses allows for an adequate statistical analysis. The fact that not all trainee physicians in Portugal were contacted has also limited the number of responses. However, the questionnaire was sent to 5,788 physicians, corresponding to 88.19% of the total number of trainee physicians, allowing us to consider our study to be quite representative. In the second place, our study showed differences regarding the responses between the different years of training. As our group of participants
included more physicians from the first years of training and although separate analyses by year of training were made, the global results could have been different had the group been more evenly distributed. In the third place, the representativeness of our sample by specialty has some limitations. Despite only those specialties with 10 or more responses being analysed, this may still have biased the results as specialties vary in terms of the number of physicians in training. For instance, specialties with the same number of responses, such as Forensic Medicine (11 responses from 32 physicians in training – 34.82% response rate) and Ophthalmology (11 responses from 117 physicians in training – 9.40% response rate) may be over and under-represented, respectively. In the fourth place, we used a questionnaire that had not been previously validated. However, there is no assessed international scale evaluating satisfaction within medical specialties and most studies use questionnaires specifically designed for this purpose. Therefore, we opted to design and adapt our own questionnaire based on these international surveys. Finally, as our study was only focused in trainee physicians, it does not allow for an extrapolation to the remaining population of physicians.
CONCLUSIONS
There is high satisfaction with medical residency in Portugal, despite changes in clinical practice due to the recent changes in salary and in health policies. However, most resident physicians consider there is a significant decline in working conditions for clinical practice in Portugal, which may explain the high percentage of physicians considering the intention to emigrate at the end of training.
CONFLICTS OF INTEREST
The authors declare there were no conflicts of interest in writing this manuscript.
FINANCIAL SUPPORT
The authors declare there was no financial support in writing this manuscript.
REFERENCES
1. Haas JS, Cook EF, Puopolo AL, Burstin HR, Cleary PD, Brennan TA. Is the professional satisfaction of general internists associated with patient satisfaction? J Gen Intern Med. 2000;15:122-8.
2. Kravitz RL, Shapiro MF, Linn LS, Froelicher ES. Risk factors associated with participation in the Ontario, Canada doctors’ strike. Am J Public Health. 1989;79:1227-33.
3. Hillhouse JJ, Adler CM, Walters DN. A simple model of stress, burnout and symptomatology in medical residents: A longitudinal study. Psychol Health Med. 2000,5:63–73.
4. Tu HT, O’Malley AS. Exodus of male physicians from primary care drives shift to specialty practice. Track Rep. 2007:1-6.
5. Cooper RA. Seeking a balanced physician workforce for the 21st century. JAMA. 1994;272:680-7.
6. Bovier PA, Perneger TV. Predictors of work satisfaction among
physicians. Eur J Public Health. 2003;13:299-305.
7. Joyce CM, Schurer S, Scott A, Humphreys J, Kalb G. Australian doctors’ satisfaction with their work: results from the MABEL longitudinal survey of doctors. Med J Aust. 2011;194:30-3.
8. Cohen JS, Patten S. Well-being in residency training: a survey examining resident physician satisfaction both within and outside of residency training and mental health in Alberta. BMC Med Educ. 2005;5:21. 9. Millán T, de Carvalho KM. Satisfaction with ophthalmology residency
training from the perspective of recent graduates: a cross-sectional study. BMC Med Educ. 2013;13:75.
10. Rosta J, Nylenna M, Aasland OG. Job satisfaction among hospital doctors in Norway and Germany. A comparative study on national samples. Scand J Public Health. 2009;37:503-8.
ARTIGO ORIGINAL specialties. BMC Health Serv Res. 2009;9:166.
12. Leigh JP, Kravitz RL, Schembri M, Samuels SJ, Mobley S. Physician career satisfaction across specialties. Arch Intern Med. 2002;162:1577-84.
13. Kaiser family foundation. National survey of physicians part III: doctor´s opinion about their profession, March 2002; [consultado 2014 Out 02]. Disponível em http://kff.org/health-costs/poll-finding/national-survey-of-physicians-part-iii-doctors/.
14. Solberg IB, Tómasson K, Aasland O, Tyssen R. Cross-national comparison of job satisfaction in doctors during economic recession. Occup Med. 2014,64:595-600.
15. Solberg IB, Tómasson K, Aasland O, Tyssen R. The impact of economic factors on migration considerations among Icelandic specialist doctors: a cross-sectional study. BMC Health Serv Res. 2013;13:524.
16. IBM Corp. Released 2011. IBM SPSS Statistics for Windows, Version
20.0. New York: IBM Corp; 2011.
17. Azevedo A, Domingues B, Moura J, Santos L. Estão os internos satisfeitos com o internato de medicina geral e familiar? Rev Port Med Geral Fam. 2014;30:24-30.
18. Cohen JS, Leung Y, Fahey M, Hoyt L, Sinha R, Cailler L, et al. The happy docs study: a Canadian Association of Internes and Residents well-being survey examining resident physician health and satisfaction within and outside of residency training in Canada. BMC Res Notes. 2008;1:105.
19. Chuck JM, Nesbitt TS, Kwan J, Kam SM. Is being a doctor still fun? West J Med. 1993;159:665-9.
Mariana BRANDÃO, Rui João CERQUEIRA, Ricardo CASTRO-FERREIRA, Carlos BERNARDES, Miguel NOBRE MENEZES, Bernardo SOARES BAPTISTA, Ricardo LADEIRAS-LOPES, Mariana CRUZ REI, Gilberto PIRES DA ROSA, José Luis MARTINS, Maria MENDONÇA SANCHES, Manuel J. FERREIRA-PINTO, Margarida RATO, Miguel
COSTA E SILVA, Catarina POLICIANO, João BEATO, João BARBOSA-BREDA, João PIMENTEL TORRES, Inês LEAL, Sílvia AGUIAR ROSA, Bárbara CARVALHO RIBEIRO, Francisco REGO COSTA, Carolina PALMELA, Tiago
CÚRDIA GONÇALVES, Luis MORAIS, Tiago REIS MARQUES