As a detailed description of the Locus of Control Inventory (LCI) and its theoretical foundations have already been given by Schepers (2005, pp. 1-2) it will not be repeated here. However, a brief description will be given of its factor structure and metrical properties.
The LCI was applied to a sample of 356 first-year students in industrial psychology at a large South African university where the main language used was Afrikaans. The 65 items of the inventory were intercorrelated and subjected to a principal factor analysis. Three well determined factors were obtained and rotated to simple structure by means of a Direct Oblimin rotation (Schepers, 2005, pp. 3-5). The obtained factors were interpreted as Autonomy, Internal Control and External Control. Three scales, corresponding to the three factors, were constructed, and yielded reliability coefficients of 0,80; 0,77 and 0,81 respectively.
To determine the cognitive, interest and personalit y correlates of the LCI it was applied jointly with the General Scholastic Aptitude Test (GSAT), the Senior Aptitude Tests (SAT), the Sixteen Personality Factor Questionnaire (16PF), the Personal, Home, Social and Formal Relations Questionnaire (PHSF), the Survey of Study Habits and Attitudes (SSHA), the 19 Field Interest Inventory (19FII) and the Career Development Questionnaire (CDQ) to the sample of first-year students. Next, a cluster analysis was done with the three scores of the LCI as input variables. Two contrasting groups were formed and used in the statistical analysis of the test scores (Schepers, 2005, pp. 3, 7-10). The first cluster was low on Autonomy and Internal Control and average-plus on External Control, and the second cluster was high on Autonomy and Internal Control and average-minus on External Control. In comparing the means of the t wo clusters, statistically significant differences were found in respect of a number of cognitive, interest and personality variables (Schepers, 2005, pp. 7-10).
From the foregoing it is clear that the LCI shows great promise indeed, but it needs to be extended in scope, and the validational studies need to be replicated on much larger and more representative samples. Accordingly a revision of the first edition of the LCI was undertaken.
As a first step, 24 of the existing items were modified in minor ways, and 15 new items were written. Next, the extended inventory was applied to the full complement of first-year university students at the Rand Afrikaans University and subjected to a principal factor analysis and item analysis.
As a complete description of the statistical analysis of the inventory has been given by Schepers (2004a, pp. 36-41), it will not be repeated here, suffice it to say that the three-factor-structure of the instrument was substantiated by the analysis. This was also borne out by a highly sophisticated study done by de Bruin (2004, pp. 16-26). The obtained factors were interpreted as External Control, Internal Control and Autonomy.
Three scales were formed, corresponding to the three factors that were obtained. The scales were subjected to an item analysis and yielded Cronbach alpha reliability coefficients of 0,841, 0,832 and 0,866 respectively (cf. Schepers, 2004a, pp. 38-40). Only three items were rejected.
From the intercorrelations of the factors it is clear that External Control and Internal Control are essentially uncorrelated (r = -0,018). External Control is moderately negatively correlated with Autonomy, and Internal Control is moderately positively correlated with Autonomy.
As far as the criterion-referenced validity of the LCI (1995) is concerned the following study by Bothma and Schepers (1997, pp. 47-51) is worth noting:
They applied the LCI (1995) and the Achievement Motivation Questionnaire (AMQ) of Pottas, Erwee, Boshoff and Lessing (1988) to 102 Black supervisors and managers in a Chemical Company in South Africa. Their work performance were assessed by 30 of their superiors who completed the Performance Appraisal Questionnaire (PAQ) of Schepers on their behalf (Bothma & Schepers, 1997, pp. 47-51). The Cronbach alpha reliability of the PAQ for the sample was 0,85. A multiple correlation was computed using the PAQ as criterion and the scales of the LCI and AMQ as predictors. A multiple correlation of 0,519 [F(13, 98) = 12,031, p = 0,001] was obtained with Autonomy, Action Orientation and Aspirational Level as significant predictors (Bothma & Schepers, 1997, p.50). This correlation increases to 0,61 if the obtained value is corrected for attenuation of the criterion. It is worth noting that the standardised regression weight of Autonomy is almost twice the size of the other two predictors. Autonomy is therefore a useful predictor of work performance at managerial level.
Rieger and Blignaut (1996) examined the relationships between individuality and collectivity on the one hand and locus of control on the other hand. For this purpose they constructed the Individuality-collectivity Inventory and applied it jointly with
JOHANN M SCHEPERS
Department of Human Resource Management University of Johannesburg
ABSTRACT
The principal objective of the study was to determine the cognitive, educational and personality correlates of the revised edition (1995) of the Locus of Control Inventory (LCI). The three-factor-structure of the LCI was confirmed by Schepers (2004a, pp. 36-41). The obtained factors were interpreted as External Control, Internal Control and Autonomy. The resulting scales yielded reliabilities of 0,841, 0,832 and 0,866 respectively. As far as validity is concerned statistically significant relationships were found with the matric mark, and with several measures of the Sixteen Personality Factor Questionnaire, the Personal, Home, Social and Formal Relations Questionnaire, the Survey of Study Habits and Attitudes, and the Learning and Study Strategies Inventory. The implications of the findings are discussed.
Key words
Validity, multiple battery factor analysis, cognitive, educational, personality, correlates
VALIDATION OF THE REVISED EDITION (1995) OF
THE LOCUS OF CONTROL INVENTORY
the LCI (1995) to a sample of 326 undergraduate students in Industrial Psychology at an Afrikaans-medium university. They specifically hypothesised that:
there is a statistically significant positive correlation between the measure of individuality and internal locus of control, there is a statistically significant positive correlation between
the measure of individuality and autonomy, and
there is a statistically significant positive correlation between the measure of collectivity and external locus of control.
There was strong support for the first two hypotheses, but not for the third. The measure of individuality correlated 0,541 (p < 0,001) with internal control and 0,752 (p < 0,001) with autonomy. This is a most important finding and should be kept in mind when doing cultural comparisons (p. 41).
Rothmann and Agathagelou (2000) investigated the relationships between locus of control and job satisfaction. For this purpose they applied the LCI (1995) and the Minnesota Satisfaction Questionnaire (MSQ) to 101 senior police members in the North West Province. Product-moment correlations were calculated between the three measures of the LCI on the one hand and the twenty factors and total score of the MSQ on the other hand.
Only the measure of external control showed meaningful relationships (medium effect size) with the measures of the MSQ. The following correlations larger than 0,30 were obtained:
Job satisfaction total (-0,44), Ability (-0,32), Activity (-0,41), Moral Values (-0,33), Security (-0,33), Social Service (-0,34), Supervision – people (-0,32), Supervision – technical (-0,42) and Diversity (-0,36) (Rothmann & Agathagelou, 2000, p. 23). Furthermore, a canonical correlation of 0,69 (p < 0,001) was obtained between the measures of locus of control on the one hand and the measures of job satisfaction on the other hand.
Le Roux, Schmidt and Schepers (1997) examined the relationships between locus of control, achievement motivation, individuality and collectivity on the one hand and participative management on the other hand. For this purpose they adapted the Participative Management Survey (PMS) of Teleometrix International (p. 4). A principal factor analysis of the PMS was done and a single factor was obtained. It yielded a Cronbach alpha reliability coefficient of 0,975.
Next, the LCI (1995), the Achievement Motivation Questionnaire (AMQ) of Pottas, Erwee, Boshoff and Lessing (1980), the Individuality-collectivity Inventory of Rieger and Blignaut (1996), and the PMS were applied to 117 education managers from a government institution.
To investigate the extent to which locus of control, achievement motivation and individuality-collectivity can predict participative management a multiple regression was run. Participative management served as dependent variable. A multiple correlation of 0,5422 [F(3, 113) = 15,69; p < 0,0001] was obtained. The following three measures were included in the regression equation: Aspiration level, autonomy and collectivity. It is worth mentioning that the standardised regression coefficient (Beta) of autonomy is almost twice the size of the other coefficients (p. 5).
From the foregoing it should be clear that the LCI (1995) shows great promise indeed: The three-factor-structure of the inventory has been substantiated, the reliability of the three scales are of acceptable magnitude, and numerous statistically significant relationships with other psychological constructs have been found. The effect sizes of the obtained relationships vary from medium to large.
The principal objective of the present study was to determine the cognitive, educational and personality correlates of the revised edition (1995) of the LCI. In the light of this objective the following postulates were formulated:
Postulates
Postulate 1: It is postulated that the measures of the LCI, the General Scholastic Aptitude Test, the Senior Aptitude Tests, and the Matric mark will jointly define a common factor of Intelligence.
Postulate 2: It is postulated that the measures of the LCI and the primary factors of the Sixteen Personality Factor Questionnaire will jointly define a common factor of Dominance and a common factor of Emotional Stability.
Postulate 3: It is postulated that the measures of the LCI and the Personal, Home, Social and Formal Relations Questionnaire will jointly define a common factor of Psychological Adjustment.
Postulate 4: It is postulated that the measures of the LCI and the Survey of Study Habits and Attitudes will jointly define a common factor of Education Acceptance.
Postulate 5: It is postulated that the measures of the LCI and the Learning and Study Strategies Inventory will jointly define a common factor of Learning and Study Strategies.
RESEARCH DESIGN
Research approach
A quantitative approach was followed in the analysis of the data. In particular, multiple battery factor analysis (Browne, 1980) was used. The data were collected by means of a field survey.
Participants
The extended version of the LCI (1995), together with a battery of cognitive, educational and personality tests, were applied to the full intake of first-year students at the Rand Afrikaans University in 1995. The ages of the students varied from 26 to 54 years, with a mean of 27,30 years and a standard deviation of 1,842 years. As far as gender is concerned 49,8% were female and 47,2% were male. Missing information accounted for 3,0%. The majority of the students were Afrikaans-speaking (969). Three hundred and seventy nine were English-speaking, and 195 spoke both English and Afrikaans. Only 27 had an African language as vernacular. Thirty-nine spoke other languages, and 53 did not indicate their home language. As far as ethnic group is concerned 88,7% were White, 1,4% were Indian, 4,7% were Coloured and 2,2% were African.
Measuring instruments
In order to determine the cognitive, educational and personality correlates of locus of control, the scores in respect of the following measures were used.
The General Scholastic Aptitude Test (GSAT), the Senior Aptitude Tests (SAT), the Sixteen Personality Factor Questionnaire (16PF), the Personal, Home, Social and Formal Relations Questionnaire (PHSF), the Survey of Study Habits and Attitudes (SSHA), and the Learning and Study Strategies Inventory (LASSI). Appropriate manuals are available for all the instruments (Cattell, 1989; Claassen, de Beer, Hugo & Meyer, 1998; Fouché & Grobbelaar, 1983; Fouché & Verwey, 1991; Langley, du Toit & Herbst, 1996; Weinstein, 1985; Weinstein, Palmer & Schulte, 1987). The metrical properties of all the instruments are acceptable for research purposes.
Procedure
As five separate analyses had to be done in respect of the five batteries of tests, jointly with the LCI, complete records were obtained for each of the batteries of tests. The sample sizes varied from 1 526 to 1 628.
Statistical analysis
a joint factor analysis by using the intercorrelation matrix of all the variables in all the batteries combined. However, the outcome of such analyses have not always been acceptable due to the effects of differential skewness on the underlying structures (cf. Schepers, 2004b, pp. 79-80). Finch and West (1997, p. 470) point out in this regard that joint factor analyses confound two sources of covariation, namely covariation within batteries and covariation bet ween batteries. To overcome this problem Tucker (1958) developed his Inter-battery Factor Analysis technique. His technique has subsequently been extended to more than two batteries by Browne (1980) and programmed by Cudeck (1980, 1991). It is known as Multiple Battery Factor Analysis (MBFA).
To determine the cognitive, educational and personality correlates of the revised edition (1995) of the LCI, the five batteries of tests, together with the LCI, were successively subjected to multiple battery factor analysis.
RESULTS
Principal objective: To determine the cognitive, educational and personality correlates of the LCI (1995).
As a first step in the analysis, the matrix of intercorrelations of the LCI and the Cognitive Battery (GSAT, SAT and Matric mark) was calculated. It is given in Table 1.
From Table 1 it can be seen that the cross-correlations (shaded area) between the LCI and the Cognitive Battery, vary from low to medium. However, most of the correlations are statistically significant.
Next, the LCI and the Cognitive Battery were subjected to a multiple battery factor analysis. As a first step in the analysis goodness of fit statistics were computed successively for one and two factors. The statistics are given in Table 2.
From the upper-tail probabilities, given in Table 2, it is clear that a single-factor-solution is optimal. The Tucker-Lewis reliability coefficient of 0,693 is relatively low. The average absolute off-diagonal residual is 0,243, and signifies a poor fit. The obtained common factor is given in Table 3.
From Table 3 it is clear that most of the loadings on the obtained common factor are quite low: Internal Control, Verbal IQ, Comparison, Memory (Paragraph), Memory (Symbols) and Matric mark have positive, but low loadings on this factor. The only substantial loading is in respect of the Matric mark (0,417).
TABLE1
MATRIX OF INTERCORRELATIONS OF COGNITIVE BATTERY JOINTLY WITH THE MEASURES OF THE LCI(1995)
External Internal Autonomy Non-Verbal Verbal IQ SAT 1 SAT 2 SAT 3 SAT 4 Control Control IQ
External Control 1 -0,235** -0,350** -0,137** -0,168** -0,088** -0,096** -0,069** -0,094**
Internal Control -0,235** 1 0,582** 0,042 0,085** 0,065* 0,032 0,087** 0,110**
Autonomy -0,350** 0,582** 1 0,122** 0,087** 0,086** 0,101** 0,049 0,052*
Non-Verbal IQ -0,137** 0,042 0,122** 1 0,659** 0,475** 0,462** 0,280** 0,296**
Verbal IQ -0,168** 0,085** 0,087** 0,659** 1 0,537** 0,362** 0,455** 0,203**
SAT 1 -0,088** 0,065* 0,086** 0,475** 0,537** 1 0,396** 0,481** 0,336**
SAT 2 -0,096** 0,032 0,101** 0,462** 0,362** 0,396** 1 0,248** 0,395**
SAT 3 -0,069** 0,087** 0,049 0,280** 0,455** 0,481** 0,248** 1 0,238**
SAT 4 -0,094** 0,110** 0,052* 0,296** 0,203** 0,336** 0,395** 0,238** 1
SAT 5 -0,094** 0,022 0,034 0,571** 0,468** 0,438** 0,377** 0,264** 0,324**
SAT 6 -0,054* -0,013 0,051* 0,503** 0,410** 0,478** 0,331** 0,294** 0,310**
SAT 7 -0,047 0,003 0,111** 0,512** 0,397** 0,380** 0,392** 0,232** 0,269**
SAT 8 -0,064* -0,002 0,089** 0,556** 0,422** 0,386** 0,304** 0,241** 0,196**
SAT 9 -0,102** 0,121** 0,056* 0,302** 0,386** 0,402** 0,270** 0,311** 0,294**
SAT 10 -0,093** 0,111** 0,063* 0,335** 0,349** 0,329** 0,169** 0,268** 0,257**
M-score -0,214** 0,156** 0,081** 0,414** 0,505** 0,379** 0,309** 0,345** 0,203**
SAT 5 SAT 6 SAT 7 SAT 8 SAT 9 SAT 10 M-score
-0,094** -0,054* -0,047 -0,064* -0,102** -0,093** -0,214**
0,022 -0,013 0,003 -0,002 0,121** 0,111** 0,156**
0,034 0,051* 0,111** 0,089** 0,056* 0,063* 0,081**
0,571** 0,503** 0,512** 0,556** 0,302** 0,335** 0,414**
0,468** 0,410** 0,397** 0,422** 0,386** 0,349** 0,505**
0,438** 0,478** 0,380** 0,386** 0,402** 0,329** 0,379**
0,377** 0,331** 0,392** 0,304** 0,270** 0,169** 0,309**
0,264** 0,294** 0,232** 0,241** 0,311** 0,268** 0,345**
0,324** 0,310** 0,269** 0,196** 0,294** 0,257** 0,203**
1 0,486** 0,447** 0,482** 0,250** 0,277** 0,285**
0,486** 1 0,459** 0,526** 0,286** 0,268** 0,267**
0,447** 0,459** 1 0,638** 0,217** 0,263** 0,206**
0,482** 0,526** 0,638** 1 0,191** 0,266** 0,230**
0,250** 0,286** 0,217** 0,191** 1 0,371** 0,293**
0,277** 0,268** 0,263** 0,266** 0,371** 1 0,232**
0,285** 0,267** 0,206** 0,230** 0,293** 0,232** 1
Note.
TABLE2
GOODNESS OF FIT STATISTICS: COGNITIVE BATTERY
1 Factor 2 Factors
Test statistic 69,342 15,021
Degrees of freedom 24,000 11,000
Upper-tail probability 0,000 0,182*
Tucker-Lewis reliability coefficient 0,693 0,938
Rescaled Akaike information criterion 0,192 0,174
Rescaled Akaike for saturated model 0,178 0,178
Average absolute off-diagonal residual 0,243 0,207
TABLE3
FACTOR MATRIX: COGNITIVE BATTERY
Variables Factor 1
LCI: External Control -0,365
LCI: Internal Control 0,377
LCI: Autonomy 0,050
GSAT : Non-verbal IQ 0,087
GSAT : Verbal IQ 0,238
SAT 1 : Verbal Comprehension 0,109
SAT 2 : Calculations 0,047
SAT 3 : Disguised Words 0,167
SAT 4 : Comparison 0,231
SAT 5 : Pattern Completion 0,109
SAT 6 : Figure Series -0,017
SAT 7 : Spatial 2D -0,073
SAT 8 : Spatial 3D -0,033
SAT 9 : Memory (Paragraph) 0,254
SAT 10 : Memory (Symbols) 0,218
M-score : 0,417
TABLE4
MATRIX OF INTERCORRELATIONS OF THE PRIMARY FACTORS OF THE16PF JOINTLY WITH THE MEASURES OF THE LCI(1995)
VARIABLES External Internal Autonomy PF1 PF2 PF3 PF4 PF5 PF6 Control Control
External Control 1 -0,225** -0,347** -0,060* -0,093** -0,323** 0,004 -0,009 -0,240**
Internal Control -0,225** 1 0,587** 0,090** 0,070** 0,127** 0,147** 0,132** 0,162**
Autonomy -0,347** 0,587** 1 0,084** 0,076** 0,329** 0,467** 0,302** 0,201**
PF 1 : Warmth (A) -0,060* 0,090** 0,084** 1 0,008 0,057* 0,049 0,288** 0,144**
PF 2 : Reasoning (B) -0,093** 0,070** 0,076** 0,008 1 0,064* -0,012 -0,003 0,069**
PF 3 : Emotional Stability (C) -0,323** 0,127** 0,329** 0,057* 0,064* 1 0,125** 0,158** 0,312**
PF 4 : Dominance (E) 0,004 0,147** 0,467** 0,049 -0,012 0,125** 1 0,434** -0,102**
PF 5 : Liveliness (F) -0,009 0,132** 0,302** 0,288** -0,003 0,158** 0,434** 1 -0,042
PF 6 : Rule-consciousness (G) -0,240** 0,162** 0,201** 0,144** 0,069** 0,312** -0,102** -0,042 1 PF 7 : Social Boldness (H) -0,119** 0,183** 0,456** 0,360** 0,018 0,286** 0,442** 0,564** 0,097**
PF 8 : Sensitivity (I) -0,083** 0,086** -0,070** 0,301** -0,027 0,000 -0,193** -0,140** 0,115**
PF 9 : Vigilance (L) 0,184** 0,021 0,038 0,005 -0,057* -0,236** 0,239** 0,104** -0,189**
PF 10 : Abstractedness (M) 0,032 -0,027 -0,090** 0,072** -0,036 -0,171** -0,079** -0,102** -0,114**
PF 11 : Privateness (N) -0,146** 0,096** 0,156** 0,000 0,029 0,160** 0,040 -0,026 0,179**
PF 12 : Apprehension (O) 0,295** -0,115** -0,383** 0,031 -0,070** -0,492** -0,224** -0,129** -0,221**
PF 13 : Openness to Change (Q1) 0,055* 0,012 0,163** -0,165** -0,045 0,059* 0,261** 0,093** -0,099** PF 14 : Self-reliance (Q2) -0,037 -0,044 -0,150** -0,304** -0,008 -0,133** -0,158** -0,421** -0,131**
PF 15 : Perfectionism (Q3) -0,131** -0,039 0,003 0,067** 0,010 0,189** -0,173** -0,086** 0,237**
PF 16 : Tension (Q4) 0,244** -0,028 -0,243** -0,053* -0,058* -0,437** -0,075** -0,074** -0,243**
PF7 PF8 PF9 PF10 PF11 PF12 PF13 PF14 PF15 PF16
-0,119** -0,083** 0,184** 0,032 -0,146** 0,295** 0,055* -0,037 -0,131** 0,244**
0,183** 0,086** 0,021 -0,027 0,096** -0,115** 0,012 -0,044 -0,039 -0,028
0,456** -0,070** 0,038 -0,090** 0,156** -0,383** 0,163** -0,150** 0,003 -0,243** 0,360** 0,301** 0,005 0,072** 0,000 0,031 -0,165** -0,304** 0,067** -0,053*
0,018 -0,027 -0,057* -0,036 0,029 -0,070** -0,045 -0,008 0,010 -0,058*
0,286** 0,000 -0,236** -0,171** 0,160** -0,492** 0,059* -0,133** 0,189** -0,437**
0,442** -0,193** 0,239** -0,079** 0,040 -0,224** 0,261** -0,158** -0,173** -0,075**
0,564** -0,140** 0,104** -0,102** -0,026 -0,129** 0,093** -0,421** -0,086** -0,074**
0,097** 0,115** -0,189** -0,114** 0,179** -0,221** -0,099** -0,131** 0,237** -0,243** 1 0,026 0,039 -0,011 0,069** -0,276** 0,027 -0,419** 0,028 -0,243**
0,026 1 -0,043 0,221** -0,046 0,080** -0,168** 0,055* 0,119** 0,022
0,039 -0,043 1 0,119** -0,051* 0,158** 0,089** 0,029 -0,166** 0,239**
-0,011 0,221** 0,119** 1 -0,057* 0,143** -0,072** 0,124** -0,014 0,122**
0,069** -0,046 -0,051* -0,057* 1 -0,164** 0,007 -0,047 0,076** -0,162**
-0,276** 0,080** 0,158** 0,143** -0,164** 1 -0,176** 0,060* -0,114** 0,447**
0,027 -0,168** 0,089** -0,072** 0,007 -0,176** 1 0,051* -0,142** -0,059* -0,419** 0,055* 0,029 0,124** -0,047 0,060* 0,051* 1 -0,106** 0,082**
0,028 0,119** -0,166** -0,014 0,076** -0,114** -0,142** -0,106** 1 -0,164**
-0,243** 0,022 0,239** 0,122** -0,162** 0,447** -0,059* 0,082** -0,164** 1
Note.
External Control has a negative loading on this factor. Postulate 1 is therefore not supported.
To determine the common factors underlying the LCI and the 16PF the various measures were intercorrelated. The matrix of intercorrelations is given in Table 4.
Table 4 shows that the cross-correlations between the LCI and the 16PF vary from low to moderate. However, most of the correlations are statistically significant.
Next, goodness of fit statistics were computed successively for one and two factors. The statistics are given in Table 5.
TABLE5
GOODNESS OF FIT STATISTICS: 16PF
1 Factor 2 Factors
Test statistic 338,598 76,526
Degrees of freedom 30,000 14,000
Upper-tail probability 0,000 0,000
Tucker-Lewis reliability coefficient 0,717 0,937
Rescaled Akaike information criterion 0,419 0,273
Rescaled Akaike for saturated model 0,242 0,242
Average absolute off-diagonal residual 0,090 0,064
From the upper-tail probabilities given in Table 5, it is clear that a two-factor-structure is optimal. The Tucker-Lewis reliability coefficient of 0,937 is highly acceptable, and the average absolute off-diagonal residual of 0,064 signifies a good fit. The obtained factors were rotated to simple structure by means of a Quartimin rotation. The rotated factor matrix is given in Table 6.
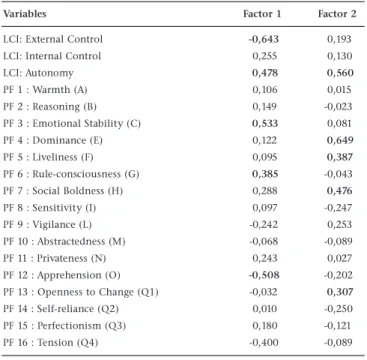
TABLE6 FACTOR MATRIX: 16 PF
Variables Factor 1 Factor 2
LCI: External Control -0,643 0,193
LCI: Internal Control 0,255 0,130
LCI: Autonomy 0,478 0,560
PF 1 : Warmth (A) 0,106 0,015
PF 2 : Reasoning (B) 0,149 -0,023
PF 3 : Emotional Stability (C) 0,533 0,081
PF 4 : Dominance (E) 0,122 0,649
PF 5 : Liveliness (F) 0,095 0,387
PF 6 : Rule-consciousness (G) 0,385 -0,043
PF 7 : Social Boldness (H) 0,288 0,476
PF 8 : Sensitivity (I) 0,097 -0,247
PF 9 : Vigilance (L) -0,242 0,253
PF 10 : Abstractedness (M) -0,068 -0,089
PF 11 : Privateness (N) 0,243 0,027
PF 12 : Apprehension (O) -0,508 -0,202
PF 13 : Openness to Change (Q1) -0,032 0,307
PF 14 : Self-reliance (Q2) 0,010 -0,250
PF 15 : Perfectionism (Q3) 0,180 -0,121
PF 16 : Tension (Q4) -0,400 -0,089
Note. Direct Quartimin rotation
Factor correlations
1 2
1 1,000
-2 0,112 1,000
Table 6 shows that Factor 1 has negative loadings on External Control (-0,643), Apprehension (-0,508) and Tension (-0,400), and positive loadings on Autonomy (0,478), Emotional Stability (0,533) and Rule-consciousness (0,385). Factor 1 can therefore be interpreted as a dimension of Emotional Stability.
Factor 2 has positive loadings on Autonomy (0,560), Dominance (0,649), Liveliness (0,387), Social Boldness (0,476) and Openness to Change (0,307). Factor 2 can best be interpreted as Ascendancy (Dominance and Social Boldness). Factors 1 and 2 are uncorrelated (r = 0,112). Postulate 2 is therefore fully supported.
To determine the common factors underlying the LCI and the PHSF the various measures were intercorrelated, and the matrix of intercorrelations is given in Table 7.
Table 7 shows that the cross-correlations between the LCI and the PHSF vary from low to high. Most of the correlations are statistically highly significant.
Next, goodness of fit statistics were computed successively for one and two factors. The statistics are given in Table 8.
From the upper-tail probabilities given in Table 8, it is clear that a t wo-factor-solution is optimal. The Tucker-Lewis reliability coefficient of 0,915 is highly acceptable, and the average absolute off-diagonal residual of 0,094 signifies a good fit. The obtained factors were rotated to simple structure by means of a Quartimin rotation. The rotated factor matrix is given in Table 9.
Table 9 indicates that Factor 1 has negative loadings on External Control and the Desirability scale, and positive loadings on Internal Control, Self-control, Nervousness, Health, Family Influences, Personal Freedom, Moral Sense and Formal Relations. Factor 1 can be interpreted as a dimension of Psychological Health and Formal Relations. Factor 2 has positive loadings on Autonomy, Self-confidence, Self-esteem, Sociability-G and Sociability-S. Factor 2 can be interpreted as Psychological Adjustment. Factors 1 and 2 are lowly correlated (r = 0,336). Postulate 3 is thus partially supported.
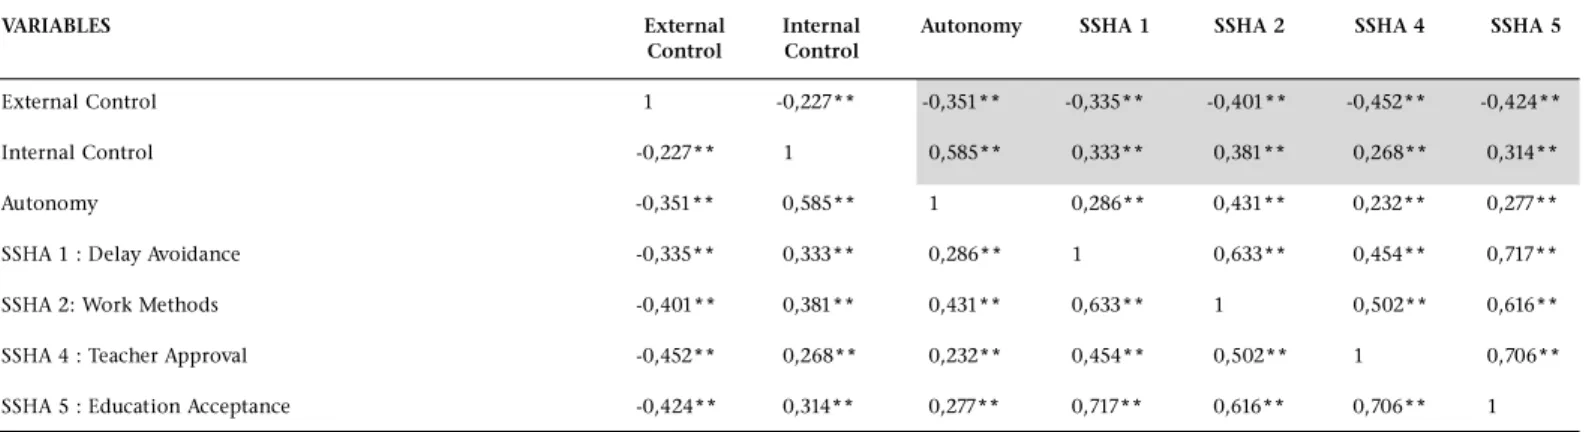
To determine the common factor(s) underlying the LCI and the SSHA the various measures were intercorrelated. The matrix of intercorrelations is given in Table 10.
Table 10 shows that the cross-correlations between the LCI and the SSHA vary from low to moderate. All the correlations are statistically highly significant.
Next, goodness of fit statistics were computed in respect of one factor. The statistics are given in Table 11.
From the upper-tail probability given in Table 11, it is clear that a single-factor-solution is optimal. The Tucker-Lewis reliability coefficient of 0,858 is highly acceptable, and the average absolute off-diagonal residual of 0,107 signifies a reasonable fit. The obtained common factor is given in Table 12.
Table 12 shows that the obtained factor has a negative loading on External Control and positive loadings on Internal Control, Autonomy, Delay Avoidance, Work Methods, Teacher Approval and Education Acceptance. This factor can best be interpreted as Study Techniques and Education Acceptance. Postulate 4 is therefore fully supported.
TABLE8
GOODNESS OF FIT STATISTICS: PHSF
1 Factor 2 Factors
Test statistic 456,873 135,713
Degrees of freedom 22,000 10,000
Upper-tail probability 0,000 0,000
Tucker-Lewis reliability coefficient 0,713 0,915
Rescaled Akaike information criterion 0,407 0,221
Rescaled Akaike for saturated model 0,149 0,149
Average absolute off-diagonal residual 0,141 0,094
TABLE9 FACTOR MATRIX: PHSF
Variables Factor 1 Factor 2
LCI: External Control -0,669 0,017
LCI: Internal Control 0,334 0,218
LCI: Autonomy 0,212 0,738
PHSF 1 : Self-confidence 0,286 0,678
PHSF 2 : Self-esteem 0,185 0,538
PHSF 3 : Self-control 0,383 0,030
PHSF 4 : Nervousness 0,405 0,106
PHSF 5 : Health 0,305 0,092
PHSF 6 : Family Influences 0,408 -0,054
PHSF 7 : Personal Freedom 0,404 -0,008
PHSF 8 : Sociability – G 0,081 0,503
PHSF 9 : Sociability – S -0,132 0,363
PHSF 10 : Moral Sense 0,587 -0,215
PHSF 11 : Formal Relations 0,523 0,202
PHSF 12 : Desirability Scale -0,354 -0,074
Note. Direct Quartimin rotation
Factor correlations
1 2
1 1,000
-2 0,336 1,000
TABLE7
MATRIX OF INTERCORRELATIONS OF THE MEASURES OF THEPHSFJOINTLY WITH THE MEASURES OF THELCI (1995)
VARIABLES External Internal Autonomy PHSF1 PHSF2 PHSF3 PHSF4 PHSF5 Control Control
External Control 1 -0,228** -0,346** -0,327** -0,271** -0,294** -0,334** -0,257**
Internal Control -0,228** 1 0,587** 0,349** 0,159** 0,078** 0,088** 0,062*
Autonomy -0,346** 0,587** 1 0,681** 0,502** 0,183** 0,250** 0,196**
PHSF1 : Confidence -0,327** 0,349** 0,681** 1 0,631** 0,309** 0,417** 0,331**
PHSF2 : Self-esteem -0,271** 0,159** 0,502** 0,631** 1 0,295** 0,433** 0,415**
PHSF3 : Self-control -0,294** 0,078** 0,183** 0,309** 0,295** 1 0,491** 0,330**
PHSF4 : Nervousness -0,334** 0,088** 0,250** 0,417** 0,433** 0,491** 1 0,546**
PHSF5 : Health -0,257** 0,062* 0,196** 0,331** 0,415** 0,330** 0,546** 1
PHSF6 : Family Influences -0,274** 0,112** 0,137** 0,284** 0,285** 0,246** 0,302** 0,261** PHSF7 : Personal Freedom -0,275** 0,140** 0,175** 0,276** 0,250** 0,226** 0,241** 0,230**
PHSF8 : Sociability – G -0,169** 0,172** 0,439** 0,507** 0,457** 0,042 0,246** 0,244**
PHSF9 : Sociability – S 0,028 0,107** 0,241** 0,227** 0,252** -0,111** 0,035 0,121**
PHSF10 : Moral Sense -0,337** 0,189** 0,100** 0,207** 0,032 0,379** 0,248** 0,148**
PHSF11 : Formal Relations -0,358** 0,360** 0,419** 0,566** 0,399** 0,330** 0,361** 0,286**
PHSF12 : Desirability Scale 0,271** -0,115** -0,212** -0,315** -0,257** -0,474** -0,331** -0,234**
PHSF6 PHSF7 PHSF8 PHSF9 PHSF10 PHSF11 PHSF12
-0,274** -0,275** -0,169** 0,028 -0,337** -0,358** 0,271**
0,112** 0,140** 0,172** 0,107** 0,189** 0,360** -0,115**
0,137** 0,175** 0,439** 0,241** 0,100** 0,419** -0,212**
0,284** 0,276** 0,507** 0,227** 0,207** 0,566** -0,315**
0,285** 0,250** 0,457** 0,252** 0,032 0,399** -0,257**
0,246** 0,226** 0,042 -0,111** 0,379** 0,330** -0,474** 0,302** 0,241** 0,246** 0,035 0,248** 0,361** -0,331**
0,261** 0,230** 0,244** 0,121** 0,148** 0,286** -0,234**
1 0,554** 0,234** 0,010 0,378** 0,425** -0,322**
0,554** 1 0,201** 0,057* 0,295** 0,345** -0,258**
0,234** 0,201** 1 0,445** 0,068** 0,391** -0,217**
0,010 0,057* 0,445** 1 -0,220** 0,042 0,041
0,378** 0,295** 0,068** -0,220** 1 0,490** -0,513** 0,425** 0,345** 0,391** 0,042 0,490** 1 -0,419**
-0,322** -0,258** -0,217** 0,041 -0,513** -0,419** 1
TABLE11
GOODNESS OF FIT STATISTICS: SSHA
Variables 1 Factor
Test statistic 109,411
Degrees of freedom 6,000
Upper-tail probability 0,000
Tucker-Lewis reliability coefficient 0,858
Rescaled Akaike information criterion 0,094
Rescaled Akaike for saturated model 0,034
Average absolute off-diagonal residual 0,107
TABLE12
FACTOR MATRIX: SSHA
Variables 1 Factor
LCI : External Control -0,645
LCI : Internal Control 0,518
LCI : Autonomy 0,522
SSHA 1 : Delay Avoidance 0,558
SSHA 2 : Work Methods 0,683
SSHA 4 : Teacher Approval 0,613
SSHA 5 : Education Acceptance 0,625
Note. Factor reflected
Table 13 shows that the cross-correlations between the LCI and the LASSI vary from low to moderate. However, all the correlations are statistically highly significant.
Next, goodness of fit statistics were computed in respect of two factors. The statistics are given in Table 14.
From the upper-tail probabilities given in Table 14, it is clear that a two-factor-solution is optimal. The Tucker-Lewis reliability coefficient of 0,874 is highly acceptable, and the average absolute off-diagonal residual of 0,118 indicates a reasonable fit. The obtained common factors are given in Table 15.
Table 15 shows that Factor 1 has a negative loading on External Control and positive loadings on Autonomy, Attitude, Anxiety, Concentration, Selecting Main Ideas and Test Strategies. Factor 1 can therefore best be identified as a Positive Attit ude towards learning and st udying. It is characterised by alertness and concentration. Factor 2 has positive loadings on Internal Control, Autonomy, Motivation, Information-processing, Study Aids and Self Testing. Factor 2 can best be interpreted as Information-processing and Motivation to st udy. Factors 1 and 2 are substantially positively correlated (r = 0,559). Postulate 5 is therefore partially supported.
TABLE10
MATRIX OF INTERCORRELATIONS OF THE MEASURES OF THE SSHA JOINTLY WITH THE MEASURES OF THE LCI(1995)
VARIABLES External Internal Autonomy SSHA 1 SSHA 2 SSHA 4 SSHA 5 Control Control
External Control 1 -0,227** -0,351** -0,335** -0,401** -0,452** -0,424**
Internal Control -0,227** 1 0,585** 0,333** 0,381** 0,268** 0,314**
Autonomy -0,351** 0,585** 1 0,286** 0,431** 0,232** 0,277**
SSHA 1 : Delay Avoidance -0,335** 0,333** 0,286** 1 0,633** 0,454** 0,717**
SSHA 2: Work Methods -0,401** 0,381** 0,431** 0,633** 1 0,502** 0,616**
SSHA 4 : Teacher Approval -0,452** 0,268** 0,232** 0,454** 0,502** 1 0,706**
SSHA 5 : Education Acceptance -0,424** 0,314** 0,277** 0,717** 0,616** 0,706** 1
Note.
TABLE14
GOODNESS OF FIT STATISTICS: LASSI
1 Factor 2 Factors
Test statistic 251,874 103,606
Degrees of freedom 18,000 8,000
Upper-tail probability 0,000 0,000
Tucker-Lewis reliability coefficient 0,690 0,874
Rescaled Akaike information criterion 0,254 0,172
Rescaled Akaike for saturated model 0,116 0,116
Average absolute off-diagonal residual 0,136 0,118
TABLE15 FACTOR MATRIX: LASSI
Variables Factor 1 Factor 2
LCI: External Control -0,661 0,060
LCI: Internal Control -0,063 0,650
LCI: Autonomy 0,368 0,339
LASSI 1 : Attitude 0,477 0,131
LASSI 2 : Motivation 0,194 0,410
LASSI 3 : Time Management 0,256 0,156
LASSI 4 : Anxiety (Alertness) 0,663 -0,163
LASSI 5 : Concentration 0,530 0,066
LASSI 6 : Information-processing 0,033 0,486
LASSI 7 : Selecting Main Ideas 0,421 0,168
LASSI 8 : Study Aids 0,001 0,403
LASSI 9 : Self Testing 0,018 0,486
LASSI 10 : Test Strategies 0,479 0,090
Note. Direct Quartimin rotation
Factor correlations
1 2
1 1,000
-2 0,559 1,000
TABLE13
MATRIX OF INTERCORRELATIONS OF THE MEASURES OF THE LASSI JOINTLY WITH THE MEASURES OF THE LCI(1995)
VARIABLES ExternalControlInternalControlAuto-nomy LASSI 1 LASSI 2 LASSI 3 LASSI 4
External Control 1 -0,217** -0,341** -0,382** -0,301** -0,250** -0,336**
Internal Control -0,217** 1 0,585** 0,237** 0,327** 0,186** 0,089**
Autonomy -0,341** 0,585** 1 0,290** 0,272** 0,182** 0,315**
LASSI 1 -0,382** 0,237** 0,290** 1 0,494** 0,416** 0,336**
LASSI 2 -0,301** 0,327** 0,272** 0,494** 1 0,620** 0,221**
LASSI 3 -0,250** 0,186** 0,182** 0,416** 0,620** 1 0,234**
LASSI 4 -0,336** 0,089** 0,315** 0,336** 0,221** 0,234** 1
LASSI 5 -0,379** 0,208** 0,303** 0,549** 0,576** 0,594** 0,480**
LASSI 6 -0,122** 0,293** 0,339** 0,245** 0,325** 0,216** 0,149**
LASSI 7 -0,287** 0,220** 0,359** 0,407** 0,352** 0,367** 0,491**
LASSI 8 -0,116** 0,245** 0,231** 0,250** 0,407** 0,381** 0,037
LASSI 9 -0,159** 0,303** 0,277** 0,297** 0,543** 0,546** 0,131**
LASSI 10 -0,348** 0,205** 0,294** 0,489** 0,413** 0,363** 0,587**
LASSI 5 LASSI 6 LASSI 7 LASSI 8 LASSI 9 LASSI 10
-0,379** -0,122** -0,287** -0,116** -0,159** -0,348**
0,208** 0,293** 0,220** 0,245** 0,303** 0,205**
0,303** 0,339** 0,359** 0,231** 0,277** 0,294**
0,549** 0,245** 0,407** 0,250** 0,297** 0,489** 0,576** 0,325** 0,352** 0,407** 0,543** 0,413**
0,594** 0,216** 0,367** 0,381** 0,546** 0,363**
0,480** 0,149** 0,491** 0,037 0,131** 0,587**
1 0,270** 0,517** 0,303** 0,421** 0,574**
0,270** 1 0,408** 0,505** 0,516** 0,302**
0,517** 0,408** 1 0,328** 0,381** 0,686**
0,303** 0,505** 0,328** 1 0,577** 0,217** 0,421** 0,516** 0,381** 0,577** 1 0,252**
0,574** 0,302** 0,686** 0,217** 0,252** 1
DISCUSSION
From the analysis by Schepers (2004a, pp. 36-41) it is clear that the revised edition (1995) of the LCI has a well defined three-factor-structure, and that the three scales which emerged have highly acceptable Cronbach alpha reliability coefficients. Three items were rejected, viz. items 23, 33 and 50, and needs to be replaced by better items.
Several independent studies, conducted with the 1995 edition of the LCI, were reviewed and showed very promising results: The criterion-referenced validity of the LCI was clearly demonstrated by Bothma and Schepers (1997). Autonomy turned out to be a useful predictor of work performance at managerial level. Rieger and Blignaut (1996) showed that there is a strong relationship between Autonomy and Internal Control on the one hand and Individuality on the other hand. This is a most important finding and should be kept in mind when doing cultural comparisons. Rothmann and Agathagelou (2000) obtained a canonical correlation of 0,69 (p < 0,001) between the measures of locus of control on the one hand and the measures of job satisfaction on the other hand. The LCI can therefore be used diagnostically to identify areas of discontent in the work situation. Le Roux, Schmidt and Schepers (1997) found that aspiration level, autonomy and collectivity are good predictors of participative management for educational managers. They obtained a multiple correlation of 0,542 [F(3, 113) = 15,69; p(F) < 0,0001] in respect of the three predictors and participative management as criterion. The standardised regression weight (Beta) of Autonomy was almost twice the size of the other regression weights. High scores on Autonomy is therefore predictive of participative management.
Principal objective: To determine the cognitive, educational and personality correlates of the LCI (1995).
In order to determine the cognitive, educational and personality correlates of the LCI (1995) it was applied jointly with five different batteries of tests, and subjected to five separate multiple battery factor analyses. Five postulates were formulated concerning the common factors between the various batteries of tests and the LCI. The first postulate concerned the common factor(s) between the LCI and the cognitive battery.
Postulate 1: It was postulated that the LCI and the Cognitive Battery would define a common factor of General Intelligence. A single factor emerged, but the loadings on the factor were rather low, although statistically significant. The only substantial loadings were in respect of External Control (-0,365), Internal Control (0,377) and Matric mark (0,417). There was thus only weak support for a factor of General Intelligence.
Postulate 2: It was postulated that the LCI and the 16PF would define two common factors, viz. a factor of Dominance and a factor of Emotional Stability. This postulate was fully supported. Autonomy was associated with Emotional Stability and External Control with Emotional Instability. Autonomy was also associated with Dominance and Social Boldness.
Postulate 3: It was postulated that the LCI and the PHSF would define a common factor of Psychological Adjustment. This postulate was partially supported in so far as two common factors were obtained which jointly define Psychological Health and Psychological Adjustment. External Control is negatively associated with Psychological Health, and Autonomy is positively associated with Psychological Adjustment. These two dimensions are lowly correlated with one another.
Postulate 4: It was postulated that the measures of the LCI and the SSHA would define a common factor of Education Acceptance. This postulate was fully supported. Internal Control and Autonomy are positively associated with Education Acceptance, and External Control is negatively associated with Education Acceptance.
Postulate 5: It was postulated that the measures of the LCI and the LASSI would define a common factor of Learning and Study Strategies. This postulate was partially supported in so far as two common factors were obtained. The first factor was interpreted as a Positive Attitude towards learning and studying. It has a moderate loading on Autonomy, but a negative loading on External Control (-0,661). The second factor was interpreted as Information-processing and Motivation to study. It has a high loading on Internal Control and a moderate loading on Autonomy.
From the foregoing it should be clear that the construct validity of the LCI has been well established. Furthermore, the reliabilities of the three scales that were obtained are highly acceptable. As far as convergent validity is concerned the LCI correlated with numerous other psychological constructs. Apart from Internal Control, External Control and Autonomy the LCI is a good predictor of Psychological Well-being.
Further refinement of certain items and an increase in the number of items are required, which will be reported on in a subsequent journal article.
ACKNOWLEDGEMENTS
I hereby wish to thank all the members of the Statistical Consultation Service of the University of Johannesburg for all the hours of computational work done for me. I value it very highly.
A special word of thanks to Annetjie Boshoff for typing the manuscript at short notice.
REFERENCES
Bothma, A.C. & Schepers, J.M. (1997). The role of locus of control and achievement motivation in the work performance of Black managers. Journal of Industrial Psychology, 23(3), 44-52.
Browne, M.W. (1980). Factor analysis of multiple batteries by maximum likelihood. British Journal of Mathematical and Statistical Psychology, 33, 184-199.
Cattell, H.B. 1989). The 16PF: Personality in depth. Champaign, Illinois: Institute for Personality and Ability Testing, Inc. Claassen, N.C.W., de Beer, M., Hugo, H.L.E. & Meyer, H.M.
(1998). Manual for the General Scholastic Aptitude Test. Pretoria: Human Sciences Research Council.
Cudeck, R. (1991). Program: MBFA: Maximum likelihood solution for multiple battery factor analysis. Department of Psychology, University of Southern California, Los Angeles.
De Bruin, G.P. (2004). Problems with the factor analysis of items: Solutions based on item response theory and item parceling.
SA Journal of Industrial Psychology, 30(4), 16-26.
Finch, J.F. & West, S.G. (1997). The investigation of personality structure: Statistical models. Journal of Research in Personality, 31, 439-485.
Fouché, F.A. & Grobbelaar, P.E. (1983). Manual for the PHSF Relations Questionnaire. Pretoria: Human Sciences Research Council.
Fouché, F.A. & Verwey, F.A. (1991). Manual for the PHSF Relations Questionnaire. Pretoria: Human Sciences Research Council. Langley, R., du Toit, R. & Herbst, D.L. (1996). Handleiding vir die
Loopbaanontwikkelingsvraelys (LPV). Pretoria: Raad vir Geestes-wetenskaplike Navorsing.
Le Roux, C.A., Schmidt, C. & Schepers, J.M. (1997). Achievement motivation, locus of control and individuality as predictors of participative management in the South African educational environment. Journal of Industrial psychology, 23
(3), 1-8.
Rothmann S. & Agathagelou, A.M. (2000). Die verband tussen lokus van beheer en werkstevredenheid by senior polisie-personeel. Journal of Industrial psychology, 26(2), 20-26. Schepers, J.M. (2004a). Overcoming the effects of differential
skewness of test items in scale construction. SA Journal of Industrial Psychology, 30(4), 27-43.
Schepers, J.M. (2004b). The power of multiple battery factor analysis in coping with the effects of differential skewness of variables. Special edition of SA Journal of Industrial Psychology,
30(4), 78-81.
Schepers, J.M. (2005). The construction of a normative scale of locus of control. Journal of Industrial Psychology, 31(3), 1-11.
Tucker, L.R. (1958). An inter-battery method of factor analysis.
Psychometrika, 23, 111-136.
Tucker, L.R. & Lewis, C. (1973). A reliability coefficient for maximum likelihood factor analysis. Psychometrika, 38(1), 1-10.
Weinstein, C.E. (1985). Learning and Study Strategies Inventory: User’s Manual. Austin, Texas: Department of Educational psychology.