HE STROPHYSICAL OURNAL
2000. The American Astronomical Society. All rights reserved. Printed in U.S.A.
(
THE COMPOSITION AND DISTRIBUTION OF DUST ALONG THE LINE OF SIGHT TOWARD THE GALACTIC CENTER1
J. E. CHIAR,2A. G. G. M. TIELENS,3D. C. B. WHITTET,4W. A. SCHUTTE,5A. C. A. BOOGERT,3,6D. LUTZ,7
E. F.VANDISHOECK,5ANDM. P. BERNSTEIN8
Received 1999 July 30 ; accepted 2000 February 18
ABSTRACT
We discuss the composition of dust and ice along the line of sight to the Galactic center (GC) based on analysis of mid-infrared spectra (2.4È13km) from the Short Wavelength Spectrometer on theInfrared Space Observatory (ISO). We have analyzed dust absorption features arising in the molecular cloud material and the di†use interstellar medium along the lines of sight toward Sgr A* and the Quintuplet sources, GCS 3 and GCS 4. It is evident from the depth of the 3.0 kmH and the 4.27 km ice
2O CO2
features that there is more molecular cloud material along the line of sight toward Sgr A* than toward GCS 3 and GCS 4. In fact, Sgr A* has a rich infrared ice spectrum with evidence for the presence of solid CH4, NH3, and possibly HCOOH. Hydrocarbon dust in the di†use interstellar medium along the line of sight to the GC is characterized by absorption features centered at 3.4, 6.85, and 7.25 km. Ground-based studies have identiÐed the 3.4 km feature with aliphatic hydrocarbons, and ISOhas given us the Ðrst meaningful observations of the corresponding modes at longer wavelengths. The integrated strengths of these three features suggest that hydrogenated amorphous carbon is their carrier. We attrib-ute an absorption feature centered at 3.28 km in the GCS 3 spectrum to the CwH stretch in aromatic hydrocarbons. This feature is not detected, and its CwC stretch counterpart appears to be weaker, in the Sgr A* spectrum. A key question now is whether or not aromatics are a widespread component of the di†use interstellar medium, analogous to aliphatic hydrocarbons.
Subject headings :dust, extinction È Galaxy : center È infrared : ISM : lines and bands È infrared : stars È ISM : molecules
1
.
INTRODUCTION
Bright infrared (IR) sources combined with 30 mag of visual extinction have made the Galactic center (GC) an attractive line of sight for the study of interstellar dust com-position. Absorption features in the spectra of GC IR sources have been used extensively to characterize inter-stellar grain material, including silicates (Becklin et al. 1978 ; Roche & Aitken 1985) and hydrocarbons (Willner et al. 1979 ; McFadzean et al. 1989 ; Sandford et al. 1991 ; Pen-dleton et al. 1994). Previous observations of the GC sug-gested the presence of absorptions expected in icy grain material, most notably the 3 km band of H2O ice (e.g., McFadzean et al. 1989) but, until recently, the explanation that one or more molecular clouds obscure the GC and contribute to its total extinction had not been completely accepted since the 3km feature has a substantially di†erent
1Based on observations made with theInfrared Space Observatory, an ESA project with instruments funded by ESA member states (especially the PI countries : France, Germany, the Netherlands, and the United Kingdom) and with the participation of ISAS and NASA.
2NASA/Ames Research Center, Mail Stop 245-3, Mo†ett Field, CA 94035 ; and SETI Institute, Mountain View, CA 94043 ; chiar=misty.arc.nasa.gov.
3Kapteyn Astronomical Institute, P.O. Box 800, 9700 AV Groningen, Netherlands.
4Rensselaer Polytechnic Institute, Department of Physics, Applied Physics, and Astronomy, Troy, NY 12180.
5Leiden Observatory, P.O. Box 9513, 2300 RA Leiden, Netherlands.
6Present address : California Institute of Technology, Downs Labor-atory of Physics, Mail Code 320-47, Pasadena, CA 91125.
7Max-Planck-Institut fur extraterrestrische Physik, Postfach 1603, 85740 Garching, Germany.
8NASA/Ames Research Center, Mail Stop 245-6, Mo†ett Field, CA 94035 and SETI Institute, Mountain View, CA 94043.
proÐle than that observed in dense cloud sources (Tielens et al. 1996 ; Wada, Sakata, & Tokunaga 1991). The presence of molecular cloud material in the GC was conÐrmed via detection of solid CO features by the Short Wavelength
2
Spectrometer (SWS) on the Infrared Space Observatory
(ISO) (Gerakines et al. 1999 ; de Graauw et al. 1996b ; Lutz et al. 1996).
Adamson et al. (1999) that, unlike the 9.7km silicate feature (e.g., Aitken et al. 1986), the 3.4km feature along the line of sight toward Sgr A* (IRS 7) is not polarized. Hence, the 3.4
km band is not produced by a carrier residing in a mantle on a silicate core but by very small (unaligned) grains. Nevertheless, energetic processing of ices in dense clouds may still play some role in the production of interstellar organics since di†use ISM dust cycles into dense clouds fairly rapidly (D3]107yr ; McKee 1989 ; Jones et al. 1994).
Hydrogenated amorphous carbon (HAC) is a possible candidate for the organic component of di†use interstellar dust (Tielens et al. 1996 ; Pendleton et al. 1994), and several laboratory groups are attempting to produce HAC analogs with a wCH2w/wCH3 ratio that matches the observed feature (e.g., Furton, Laiho, & Witt 1999 ; Duley et al. 1998). Previous comparisons of HACs with the interstellar 3.4km feature have shown that many HACs produced in the labor-atory are lacking in wCH groups relative to
3 wCH2w
groups, thus providing an unsatisfactory Ðt to the observed feature (e.g., Pendleton et al. 1994). Recently, Duley et al. (1998) have shown that the 3.38 km wCH3 subfeature is strengthened at lower temperatures (77 K), and the resulting HAC withwCH2w/wCH3\1provides a better match to the 3.4 km interstellar feature in comparison with that of HACs at a higher temperature (e.g., 300 K).
Recently, a feature near 6.2 km was discovered along sight lines toward the GC Quintuplet sources and several dusty late-type WC Wolf-Rayet stars and has been attrib-uted to the aromatic CwC stretch in polycyclic aromatic hydrocarbon molecules (PAH) in the di†use ISM along the line of sight (Schutte et al. 1998). PAHs are a certain com-ponent of the carbonaceous material in the Galaxy, as shown by the dominance and ubiquitous presence of the family of PAH emission features at 3.3, 6.2, 7.7, 8.6, and 11.3
km in di†use emission in the Galactic disk (Giard et al. 1988 ; Ristorcelli et al. 1994 ; Mattila et al. 1996). Therefore, the detection of the aromatic CwC stretch at 6.2 km in di†use ISM sight lines is not surprising ; its carrier may be in the form of gaseous polycyclic aromatic hydrocarbons (PAHs) or PAH clusters with sizes up to a few thousand C atoms (Schutte et al. 1998). The corresponding CwH stretch atD3.3 km was not detected in absorption in the di†use ISM, although high signal-to-noise data, necessary to detect this weak feature, were not available for many sight lines. However, an absorption feature at 3.25 km is detected in ground-based data in Ðve heavily extincted molecular cloud sight lines (Sellgren et al. 1995 ; Brooke, Sellgren, & Geballe 1999).
This paper discusses the composition of the hydrocarbon dust component, as well as the molecular cloud ices, along the line of sight to the Galactic center based on 2.5È13km spectra from theInfrared Space ObservatoryÏs Short Wave-length Spectrometer (ISO-SWS).ISO-SWS has revealed the previously elusive 2.95 km NH3 feature in dense cloud material along the GC line of sight. These observations also have provided us with the Ðrst meaningful observations of hydrocarbon modes at long wavelengths (5È8 km) corre-sponding to the well-studied 3.4 km absorption feature, associated with the di†use ISM, allowing us to narrow down the list of possible hydrocarbon candidates (°5.1). We also present the Ðrst detection of aromatic absorption, at 3.28 km, unassociated with molecular cloud dust. This paper is organized as follows. In°2 we brieÑy discuss what is known about the nature of the sources, and in ° 3 we
explain the data reduction, and present the ISO-SWS spectra of three sources in the Galactic center. In the follow-ing sections, we discuss the nature of the molecular cloud IR absorption features (°4) and hydrocarbon absorption fea-tures (°5) along the line of sight. Finally, we discuss possible scenarios for the origin of hydrocarbons in the GC region (°6) and summarize our results (°7).
2
.
THE NATURE OF THE SOURCES
This paper analyzes spectra from ISO-SWS for three sight lines toward the Galactic center : Sgr A* (and Sgr A W-IRS 3), GCS 3, and GCS 4. The IR sources contained in theISObeam along the line of sight toward Sgr A* and Sgr A W-IRS 3 su†er visual extinction of D31 mag (Rieke, Rieke, & Paul 1989 and references therein) and contain M giants, supergiants, and H II regions (Eckart et al. 1995 ; Sellgren et al. 1987 ; Lebofsky, Rieke, & Tokunaga 1982 ; Wollman, Smith, & Larson 1982). GCS 3 and GCS 4, located near the GC Radio Arc, approximately 14@ north-east of the Galactic center and corresponding to a projected distance of about 30 pc (assuming a distance of 8.2 kpc), were Ðrst discovered in the polarimetric study by Kobay -ashi et al. (1983). Visual extinction estimates are similar to that for the GC, A mag (Figer, McLean, & Morris
VD29
1999 and references therein). Detailed imaging of the region revealed that GCS 3 and GCS 4 consist of a compact group of at least Ðve IR sources, which have since become known as the Infrared Quintuplet (Nagata et al. 1990 ; Okuda et al. 1990), although more recent imaging and spectroscopic investigations (Moneti, Glass, & Moorwood 1992, 1994) have shown that this region contains several bright and many faint IR sources. The nature of these objects is still open to debate : several studies have suggested that the Quintuplet cluster consists of young stars surrounded by thick shells or cocoons of hot dust (e.g., Moneti et al. 1994). A very recent photometric study has proposed that these stars are actually massive late-type dusty WC Wolf-Rayet stars (Figer, McLean, & Morris 1999).
3
.
OBSERVATIONS AND DATA REDUCTION
Infrared spectra of Sgr A* (Lutz et al. 1996), Sgr A W-IRS 3, and Quintuplet (RAFGL 2004) sources GCS 3 and GCS 4 were obtained with ISO-SWS in 1996 and 1997. The reader is referred to de Graauw et al. (1996a) for a more detailed description of SWS and its capabilities. Obser-vational details and coordinates are listed in Table 1. The
ISO-SWS 14@@]20@@beam was centered on the coordinates listed in Table 1 ; the Sgr A* and Sgr A W-IRS 3 positions are only several arcseconds apart and therefore probe similar lines of sight in the relatively largeISObeam. The observations of GCS 3 were centered on GCS 3 I and included all four GCS 3 objects ; GCS 4, located some 15A
2.0 4.0 6.0 8.0 10.0 12.0 Wavelength [µm]
1 10 100 1000
Flux [Jy]
SgrA*
GCS4
0.25*GCS3
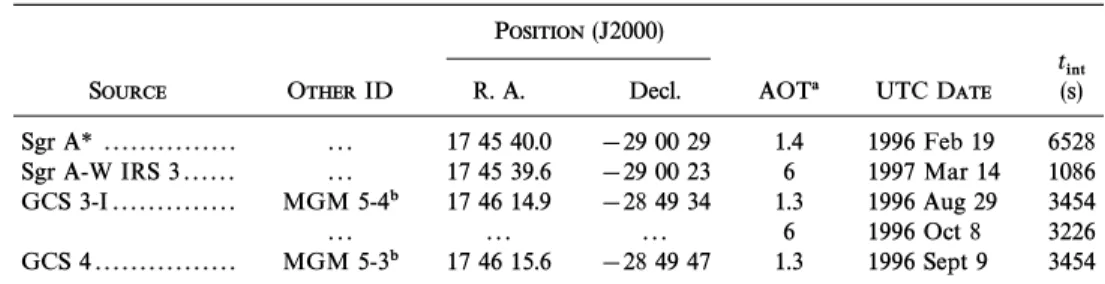
TABLE 1 OBSERVATIONALDETAILS
POSITION(J2000)
t
int
SOURCE OTHERID R. A. Decl. AOTa UTC DATE (s)
Sgr A* . . . 17 45 40.0 [29 00 29 1.4 1996 Feb 19 6528 Sgr A-W IRS 3 . . . 17 45 39.6 [29 00 23 6 1997 Mar 14 1086 GCS 3-I . . . MGM 5-4b 17 46 14.9 [28 49 34 1.3 1996 Aug 29 3454
. . . 6 1996 Oct 8 3226
GCS 4 . . . MGM 5-3b 17 46 15.6 [28 49 47 1.3 1996 Sept 9 3454 NOTE.ÈUnits of right ascension are hours, minutes, and seconds, and units of declination are degrees, arcminutes, and arcseconds.
aAOT 1.mrepresents Astronomical Observing Template 1, speedm.
bMGM identiÐcation from survey by Moneti et al. 1992. (RD2000) and 5.3È7.0km (RD1350) spectral regions and for Sgr A W-IRS 3 in the 7.4È8.0 km (RD1700) spectral region.
This paper discusses the 2.5È13km spectral region, which contains the strongest absorption features of hydrocarbons and ices excepting the 15.3kmCO2band, which has been discussed extensively by Gerakines et al. (1999 and refer-ences therein). The data were reduced using the SWS Inter-active Analysis package (de Graauw et al. 1996a) and the Observers SWS Interactive Analysis Package (OSIA). Version 7 of the SWS calibration Ðles were used. The Ñux-calibrated spectra from 2.5 to 13km are shown in Figure 1.
FIG. 1.ÈISO-SWS spectra from 2.5 to 13km of Sgr A* (AOT6), GCS 4 (AOT1), and GCS 3 (AOT1). The GCS 3 spectrum has been divided by 4 for presentation purposes.
Optical depth spectra were determined by Ðtting local low-order polynomial continua as described in the following sections. No evidence for broad molecular emission features (e.g., caused by PAHs) was apparent in the spectra, thus continua were chosen assuming only the presence of absorption. Optical depths of the dust-absorption features are listed in Table 2.
4
.
THE MOLECULAR CLOUD FEATURES
Molecular cloud absorption features of solid state H2O, and along the line of sight to the Galactic center CO
2, CH4
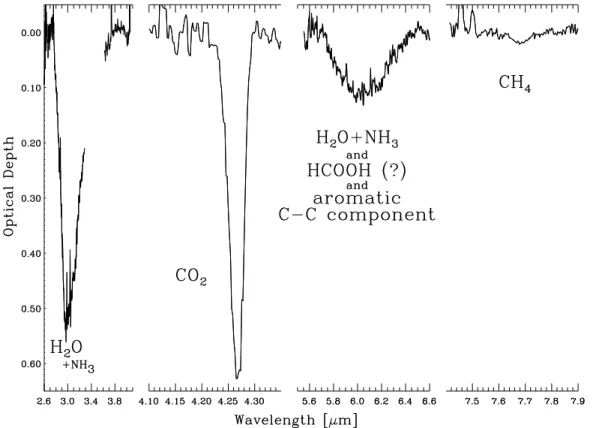
are assigned based on their previous identiÐcation in known molecular cloud sources. Consistent with the uneven dis-tribution of molecular cloud material, these features vary in depth across the GC Ðeld, whereas absorption features caused by dust in the di†use interstellar medium are observed at approximately constant depth (° 5.1). It is evident from the depth of the 3.0km ice feature (Fig. 1) that there is more molecular cloud material along the line of sight toward Sgr A* than toward GCS 3 and GCS 4. Thus, we use the Sgr A* spectra to characterize the molecular cloud dust that is present along the line of sight to the Galactic center. Optical depth plots of the molecular cloud features are presented in Figure 2 ; column densities are listed in Table 3. We discuss these features in detail below.
Ice at 3.0 and 6.0km 4.1. H2O
4.1.1. T he 3kmFeature
The 3 km optical depth proÐles for the GC sources (Fig. 3) were determined by Ðtting a local second-degree polynomial in the 2.5È4.2km region. These proÐles are very similar to each other and at the same time distinctly
di†er-TABLE 2 OPTICALDEPTHSa
DENSECLOUDDUSTFEATURES DIFFUSECLOUDDUSTFEATURES
SOURCE q
3.0 q4.27 q6.13b q7.68 q3.28 q3.4 q6.2c q6.85 q7.25 q9.7d
Sgr A* . . . 0.50^0.01 0.70^0.01 0.13^0.02 0.017^0.003 \0.02 0.21^0.01 0.05^0.01 0.05^0.01 0.03^0.01 3.52 GCS 3 . . . 0.23^0.02 0.48^0.02 0.03^0.01 \0.02 0.026^0.005 0.16^0.01 0.10^0.02 0.04^0.01 \0.03 2.38 GCS 4 . . . 0.16^0.01 0.22^0.02 0.02^0.01 \0.03 \0.05 0.15^0.01 0.08^0.02 \0.03 \0.03 2.24
aOptical depth values for GCS 3 are from AOT6 data where available ;q for Sgr A* is from AOT6 data ; all others are determined from AOT1 spectra.
7.68
bOptical depth is from the maximum allowable depth of theH mixture at 6.13km, which is constrained by the depth of the 3km feature.
2O: NH3: CO2
See°4.1 for details.
cOptical depth is that of the residual feature after subtracting the ice component. See°°4.1 and 5.2.1 for details.
FIG. 2.ÈMolecular cloud dust absorption features identiÐed in Sgr A*. To highlight the molecular cloud features, the 3.29È3.62 region has been removed from the ““ ice ÏÏ proÐle. All data are AOT1, speed 4, except for the 7km region, which is AOT6.
ent from theH2O-iceabsorption features observed toward molecular clouds elsewhere in the Galaxy (McFadzean et al. 1989 ; Butchart et al. 1986). Figure 3 compares the 3 km water-ice feature observed in the Taurus dark cloud in the line of sight toward the background K-giant Elias 16 (from Smith, Sellgren, & Tokunaga 1989) with those of the GC sources, Sgr A*, GCS 3, and GCS 4. Clearly, the 3km band in the Galactic center shows a blue absorption wing peaking at about 2.95 km. (The aliphatic hydrocarbons absorption band at 3.4 km is discussed in ° 5.1). While initially this di†erence in proÐle was taken to imply that this band might be caused by water of hydration in silicates rather thanH ice (Tielens et al. 1996 ; Wada et al. 1991 ;
2O
Tielens & Allamandola 1987), the absence of this band in local sight lines through the di†use ISM sheds some doubt on that interpretation (e.g., Whittet et al. 1997). The dis-covery of solidCO2 by ISO now Ðrmly links the 3.0 km band in the GC toH ices (de Graauw et al. 1996b ; Lutz
2O
et al. 1996 ; Whittet et al. 1997 ; Gerakines et al. 1999). We consider the possibility that the 3.0km band could be caused by diluted mixtures of H2O with other molecules, such as CO, O and as suggested by Schutte &
2, NH3,
Greenberg (1989). Drawing on extensive laboratory studies by the Leiden (http ://www.strw.leidenuniv.nl/Dlab/ ; Gera-kines et al. 1995, 1996) and NASA/Ames Astrophysics Laboratory groups, we attribute the di†erence in the 3.0km proÐle between the GC and local molecular clouds to a higher abundance of other speciesÈnotably ammoniaÈin the H2O ice in the former relative to the latter regions. Possibly, this increased abundance of NH ice in the GC
3
region relative toH2O ice reÑects the increase in the N/O elemental abundance ratio with decreasing galactocentric radius (Simpson et al. 1995 ; Rubin et al. 1988). A detailed discussion of the laboratory results forH2O: NH3mixtures will be discussed in a subsequent paper (J. Chiar & M. Bernstein, 2000, in preparation). We describe the laboratory Ðts to the 3 km proÐle and determination of H ice
2O
column density along with the discussion of the 6 km ice proÐle below.
4.1.2. T he 6kmFeature
The 5.5È6.5km spectral region contains the vibrational modes of several molecules of astrophysical interest : OwH bend in H (6.0 km), CxO stretch in carbonyl groups
2O
TABLE 3 ICECOLUMNDENSITIESa
Source N(H
2O) N(CO2)b N(CO) N(CH4) N(HCOOH) N(H2CO) N(CH3OH)
Sgr A* . . . 12.4^2.5 1.7^0.2 \1.5 0.30^0.07 0.8^0.2 \0.3 \0.5 GCS 3 . . . 4.7^0.4 1.1^0.1 \0.9 \0.3 . . . . GCS 4 . . . 3.0^0.3 0.7^0.2 \0.9 \0.5 . . . .
aColumn densities in units of 1017cm~2.
3 3.5 Wavelength (µm) 0
1
2
3
Normalized Optical Depth
5.5 6 6.5 7
Wavelength [µm]
0
0.1 0
0.1 0
0.1 0
0.1 0
0.1 Sgr A* (AOT1, sp4)
GCS3 (AOT 6)
GCS3 (AOT1, sp3)
GCS4 (AOT1, sp3)
Optical Depth
WR118 (AOT1, sp2)
5.5 6 6.5 7 7.5 8 8.5
Wavelength [µm]
125 175 225 275 125 175 225 275
Flux [Jansky]
FIG. 3.ÈOptical depth proÐles of the 3km ice feature for Taurus dense cloud (Elias 16,dashed line; adapted from Smith et al. 1989) compared with the Galactic center sources Sgr A* (top), GCS 3 (middle), GCS 4 (bottom). All GC sources show excess blue absorption compared to the Taurus ice proÐle. Spectra have been normalized to have a depth of 1.0 at 3.05km. (occurring in aldehydes, ketones, and carboxylic acids ; 5.7È5.9 km), and CwC stretch in aromatic materials (6.2
km). The spectra of all GC sources show an absorption feature around 6.0km (Fig. 4). Sources in or behind local molecular clouds also show a feature at 6.0km (see also Fig. 6) caused mostly by the OwH bending mode inH2O ice, although trace amounts of other molecules may contribute to the absorption (Keane et al. 2000 ; Schutte et al. 1996b ; Tielens & Allamandola 1987). In contrast, Galactic Wolf-Rayet WC-type stars show an absorption feature at 6.2km attributed to the CwC stretch in aromatic materials (Schutte et al. 1998 ; see also Fig. 4 and ° 5.2.1). Visual inspection of Figure 4 reveals that the 6km proÐle of Sgr A* is strikingly di†erent than those of GCS 3 and GCS 4 ; the latter two instead show a similarity to the 6.2 km band observed toward late-type dusty WC stars such as WR118 (cf.°5.2 and Schutte et al. 1998). Given the greater depth of the 3.0 km ice band in Sgr A*, compared to GCS 3 and GCS 4 (Fig. 1), the 6.0km band of this source is likely to contain a dominant ice component.
Determination of the 6 km proÐle for Sgr A* depends heavily on the choice of continuum, which leads to uncer-tainties in the red side of the proÐle and peak optical depth and minor changes in the peak position. We carried out Ðrst- and second-degree polynomial Ðts to the 5.5È8.5 km spectrum of Sgr A* to quantify the di†erences in the proÐles resulting from each. Figures 5 and 6 show two possible continuum choices and the resulting optical depth spectra, respectively. Peak positions of jD6.05 (second-degree polynomial Ðt) and 6.10 km (Ðrst-degree polynomial Ðt),
FIG. 4.ÈThe 6.0km region of Sgr A*, GCS 3, GCS 4, and WR 118. The spectrum of WR 118 is from Schutte et al. (1998). Narrow absorption lines (FWHMD0.01km) in the spectrum of GCS 3 (and Sgr A*) are caused by cold gas-phaseH along the line of sight (Moneti & Cernicharo 2000).
2O
6.0 6.5 7.0 7.5
Wavelength [µm]
0.0
0.5
1.0
Optical Depth
2.6 2.8 3 3.2 3.4 3.6 3.8 0
1
2 0
0.2
0.4
Wavelength (µm)
Optical Depth
5.6 5.8 6 6.2 6.4 6.6 6.8 7 0
0.1 0
0.1 FIG. 6.ÈComparison of the 6km feature in Sgr A* using two di†erent
continuum Ðts as shown in Fig. 5. Optical depth spectra resulting from the second-degree polynomial Ðt (thin solid line) and Ðrst-degree polynomial Ðt (thick solid line) are shown. The optical depth spectrum of the protostellar object NGC 7538 IRS 9 (dashed line; Keane et al. 2000) is shown for comparison and is o†set for clarity. All three spectra have been scaled to 1 at their peak optical depth.
and peak optical depths (at 6.05 km) of 0.20 (Ðrst degree) and 0.14 (second degree) are obtained. We adopt the second-degree continuum Ðt, as this provides a good esti-mate of the continuum for the absorption features at 6.0,
6.85, and 7.25km.9For consistency, we also adopt second-degree polynomial continuum Ðts for GCS 3 and GCS 4 ; the optical depth spectra are shown in Figure 4.
Rather than identifying the carrier of the 6km feature in the GC sources in isolation, we use the 3 km proÐle as a constraint for the nature and abundances of the carriers of the corresponding 6km feature. Most of the 6 km absorp-tion in protostellar objects is explained by simple amorp-housH ice mixtures, so we Ðrst attempt to match the GC
2O
3 and 6 km proÐles with only pureH2O ice (using labor-atory data from Leiden Observlabor-atoryÏs database at http :// www.strw.leidenuniv.nl/Dlab/). This procedure shows that Ðtting the 6km band with pureH ice causes the optical
2O
depth of the 3km band to be overestimated by a factor of 2È4.5 for all three objects. This is demonstrated in Figure 7 (bottom panels) for Sgr A* and in Figure 8 for GCS 3 (top panels) and GCS 4 (bottom panels). The mixture used, amorphous H at 30 K, is a realistic analog for ices in
2O
these sight lines and provides the best Ðt to the Sgr A* 6km proÐle when the 3km spectrum is ignored. Such a discrep-ancy between the 3 and 6 km H2O ice optical depth has been noted for some massive young stellar objects (Gibb et al. 2000 ; Keane et al. 2000). For these sources, scattering at near-IR wavelengths in the disk-like environment of the protostar may reduce the apparent optical depth at 3.0km
9A local continuum in the 7.3È8.0km region is used for theCH feature
4
at 7.68km. See°4.3 for further discussion.
FIG. 7.È2.6È3.9km (left panels) and 5.6È7km (right panels) optical depth spectra for Sgr A*. The top panels show the result of the Ðtting procedure when both proÐles are used to constrain the Ðt. The ““ best ÏÏ Ðt is obtained withH (3: 1: 0.03, 15 K) (dotted line) and HCOOH at 10 K (dashed line). The
2O: NH3: CO2
sum of the two laboratory mixtures is shown by the smooth solid line. The bottom panels show the result of the Ðtting procedure when only the 6km proÐle is considered. In this case, although the 6km band is reasonably matched with pureH at 30 K (smooth solid line), the depth of the 3km proÐle is
2O
3 3.5 0
0.2
GCS4
0
0.2
GCS3
Optical Depth
6 6.5
0
0.1 0
0.1
6 6.5
0
0.1 0
0.1
Wavelength [µm]
FIG. 8.È2.6È3.9km (left panels) and 5.6È6.7km (center and right panels) spectral region of GCS 3 (top panels) and GCS 4 (bottom panels). Comparison of the laboratory mixturesH (3: 1: 0.03, 15 K) (smooth solid line) and pure at 30 K (dashed line) are shown for the 3 and 6km spectral regions
2O: NH3: CO2 H2O
in the left and center panels, respectively. Similar to Sgr A*, theH mixture represents these proÐles better than pure ice. The right panels
2O: NH3: CO2 H2O
show the result of summing theH mixture with a WR 118-like 6.2km component (heavy solid line).
2O: NH3: CO2
(Pendleton, Tielens, & Werner 1990). For the Galactic center sources, ice absorption is not local to the sources but rather occurs along the line of sight and, hence, this e†ect should not play a role. Thus, we conclude that, despite the good Ðt, the 6.0km band cannot be due toH ice alone.
2O
The 3 km band toward Sgr A* shows an excess blue absorption wing relative to other observed interstellar ice bands (cf. Fig. 3). This is likely because of the presence of in the ice (e.g., Schutte & Greenberg 1989). There is NH3
evidence that the 6km proÐle in protostellar objects is also due to a mixture of other molecules withH2O(Schutte et al. 1996b ; Keane et al. 2000 ; Gibb et al. 2000). Thus, we favor a multicomponent ““ Ðt ÏÏ to the 3 and 6km ice features and have used the extensive databases at Leiden Observatory and NASA-Ames Astrophysical Laboratories to determine the carriers (in addition toH2Oice) responsible for the two features. These databases contain mixtures ofH ice with
2O
HCOOH, CO, and as CH3OH, CH4, O2, H2CO, CO2 minor components, as well as pure ices of these molecules, at temperatures ranging from 10 to 245 K (http :// www.strw.leidenuniv.nl/Dlab/ ; J. Chiar & M. Bernstein, 2000, in preparation). A formal chi-squared Ðtting routine is used to Ðt the proÐles in the Sgr A* spectrum. The ““ best ÏÏ Ðt, shown in Figure 7 (top panels), consists of (100: 30: 6, 15 K) and HCOOH at 10 K. H2O: NH3: CO2
Summing these mixtures provides an impressive Ðt to the 3
km feature, including the so-called long-wavelength wing (3.4 km absorption is caused by di†use ISM dust ; this region is excluded from the Ðt), and can account for much of the absorption at 6 km. Formaldehyde(H2CO) has been discussed as a candidate for the red side of the 6km feature in protostellar objects (Schutte et al. 1996a ; Keane et al. 2000) ; the Sgr A* proÐle (which is tightly constrained on the red side, regardless of continuum choice) limits the amount ofH relative to ice toD2%.
2CO H2O
Residual absorption resulting from subtracting the ““ Ðt ÏÏ from the astronomical data is shown in Figure 9 (top panel). Much of this remaining absorption is accounted for by a component at 6.2km, similar to the WR 118 6.2km proÐle (Figs. 4, 9). See°5.2.1 for a detailed discussion of this com-ponent. Only a small portion of the 6km proÐle remains unaccounted for in the Sgr A* spectrum (Fig. 9, bottom panel). Additional organic acid mixtures, such as HCOOH at a range of temperatures and host matrices, are needed to resolve this issue.
The weakness of the 6km ice components in GCS 3 and GCS 4 make a chi-squared analysis of the 3 and 6km bands unwarranted (see themiddle panelsin Fig. 8) ; however, their 3 km proÐles and the relative depths of their 3 and 6 km bands can be used to help constrain the nature of the ices. PureH2O does not provide a satisfactory match to the 3 and 6 km proÐles, as discussed above (Fig. 8). The 3 km proÐles of these sources are well matched by the same mixture used to Ðt the Sgr A* proÐles, H2O: NH3: CO2
which is suggestive of a consistentNH ratio for dense
3/H2O
clouds toward the Galactic center. A component like the WR 118 6.2km feature accounts for the remainder of the 6
km proÐle, as for Sgr A*. Figure 8 shows that all of the 6km absorption in the Quintuplet spectra is accounted for by the sum of the ice mixture(H2O: NH3: CO2,15 K) and a 6.2km ““ di†use ISM ÏÏ component (represented by the WR 118 spectrum). Detailed discussion of the 6.2 km feature is deferred to°5.2.1.
To summarize, using the available databases of inter-stellar ice analogs, the 3 and 6km proÐles observed toward Sgr A*, GCS 3, and GCS 4 are best represented by the ice mixture, H2O: NH3: CO2 (100: 30: 6, 15 K), with a small amount of HCOOH at 10 K (for Sgr A*), in addition to a di†use ISM component at 6.2 km. Pure H cannot
2O
den-5.6
6
6.4
0
0.1
Wavelength (
µ
m)
Optical Depth
0
0.05
7.6
7.7
7.8
Wavelength [
µ
m]
−0.01
0.00
0.01
0.02
AOT1 (speed 4)
−0.01
0.00
0.01
0.02
AOT6
Optical Depth
FIG. 9.È(T op panel) 6km residual for Sgr A* obtained after subtracting the best-Ðtting laboratory mixtures shown in Fig. 7. The heavy line rep-resents the WR 118 6.2km optical depth spectrum, divided by a factor of 1.25. The bottom panel shows the ““ Ðt ÏÏ resulting from the summation of the best-Ðtting laboratory ices and the scaled WR 118 6.2km feature. sities (Table 3) are determined by the Ðt to the 3km proÐle (Fig. 7 [top left,dotted line], Fig. 8 [left panels, solid line]), using N\/qldl/A, and A\2]10~16 cm molecule~1
(Hagen, Tielens, & Greenberg 1981). Column density for HCOOH is determined using the 6km Ðt (Fig. 7 [top right,
dashed line]), and A\6.7]10~17 cm molecule~1
1987). (Marechal
and Ice andCO
4.2. CO2 CH3OH
Solid CO2 absorption features at 4.27 km (stretching mode) and 15.2 km (bending mode) have been discussed extensively by Gerakines et al. (1999). Fits to theCO2 pro-Ðles showed that toward the sources discussed in this paper, ice is embedded in a mainly polar matrix at tem-CO
2
peratures less than 50 K.
We searched for solid CH absorption features at
3OH
3.54km (CwH stretch), 3.9km (combination mode), and 6.85km (CwH deformation mode) in the Sgr A* spectrum. The CwH stretch mode occurs in the red wing of the 3.4km aliphatic hydrocarbon feature. In order to obtain a limit on the depth of a possibleCH feature at 3.54km, a local
3OH
second-degree polynomial was Ðtted between 3.4 and 3.7
km. A second-degree polynomial continuum was Ðtted in the 3.6È4.1km region to estimate the 3.9km feature depth. Although we detect a feature centered at 6.85km toward Sgr A*, its width is too narrow to be caused byCH3OH(see °5.1), thus the continuum on either side of the observed 6.85
km feature is used to deduce a limit for theCH feature.
3OH
Limits on the optical depths areq3.54\0.01,q3.9\0.001, and q Using the integrated absorbance
6.85\0.005.
values for pure CH3OH (A\5.3]10~18, 2.8]10~18, 1.2]10~17cm molecule~1, for the 3.54, 3.9, and 6.85 km features, respectively ; Hudgins et al. 1993), the average cal-culated CH column density is less than 0.5]1017
3OH
cm~2, resulting in an abundance of less than 4% re-lative to H ice. This is similar to the value
2O found for the quiescent Taurus N(CH3OH)/N(H2O)\5%
dark cloud (Chiar, Adamson, & Whittet 1996) and signiÐ-cantly less than the abundance found for some high-mass protostars toward whichN(CH3OH)/N(H2O)is as high as 30% (Allamandola et al. 1992 ; Skinner et al. 1992 ; Dartois et al. 1999).
Carbon monoxide is present primarily in the gas phase in these lines of sight. Limiting values for the solid CO column densities derived in this work are listed in Table 3. These values agree with those independently analyzed by Gera-kines et al. (1999).
Ice
4.3. CH
4
The deformation mode of solid methane (CH occurs
4)
near 7.68 km and has been detected in three protostellar sources to date (dÏHendecourt et al. 1996 ; Boogert et al. 1996, 1998). We detect this absorption feature in the Sgr A* and Sgr A W-IRS 3 spectra withq7.68^0.02(Fig. 10). Fits to the higher quality Sgr A W-IRS 3 AOT6 spectrum were carried out using the database at Leiden Observatory (Boogert et al. 1997). This spectrum is best-Ðtted by CH
4
embedded in a polar matrix containing molecules such as and/or at temperatures ranging from 10 to 80 H
2O CH3OH
K. Nonpolar mixtures do not provide a good Ðt as they peak at shorter wavelengths and have more narrow proÐles than the observed feature. Our result is consistent with recent studies of solidCH4toward protostellar objects that have shown thatCH embedded in a polar matrix provides
4
FIG. 10.È7.55È7.8km optical depth spectrum of Sgr A* shown with best-Ðtting laboratory mixtureH (3: 1, 10 K) (smooth solid line).
the best Ðt to the observed proÐle (Boogert et al. 1996 ; dÏHendecourt et al. 1996). We adopt the matrix-independent integrated absorption strength,
A\7.3]10~18 cm molecule~1 to compute the column density of CH4 toward Sgr A* : N(CH4)\3^1]1016
cm~2, resulting in N(CH within
4)/N(H2O)\0.02^0.01,
the range, 0.4%È4%, found for protostellar objects (Boogert et al. 1996 ; dÏHendecourt et al. 1996).
The peak optical depth of the CwH stretching mode of solidCH4,at 3.32km, is expected to be the same as that of the deformation mode (Hudgins et al. 1993 ; Boogert et al. 1997). Since this feature falls in the blue wing of the 3.4km aliphatic hydrocarbon feature (°5.1), its presence cannot be conÐrmed.
Assuming a similarN(CH ratio for GCS 3 and
4)/N(H2O)
GCS 4 as for Sgr A*, a feature with optical depthq7.68\
0.01 is expected for the CwH deformation mode. The current data do not have a sufficient signal-to-noise ratio in this wavelength region to detect such a weak feature ; limit-ing values forq and are given in Tables 2 and 3,
7.68 N(CH4)
respectively.
5
.
THE DIFFUSE ISM FEATURES
Aliphatic hydrocarbons are known to be a widespread component of the di†use ISM, as is shown by the ubiqui-tous presence of the 3.4km CwH stretch absorption feature in all studied sight lines.ISO-SWS data have now given us irrefutable evidence for the corresponding deformation modes at longer wavelengths. Contrarily, aromatic hydro-carbons, which have CwH and CwC stretch modes at D3.3 and 6.2km, respectively, are not yet well established as a universal component of the di†use ISM. We discuss these hydrocarbon features toward the GC in the following sections. Aliphatic hydrocarbon features detected toward
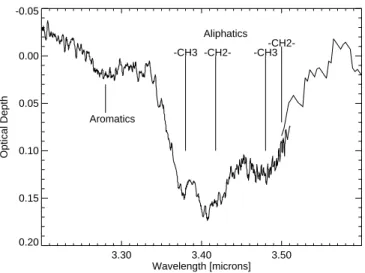
Sgr A* are shown in Figure 11 ; Figure 12 displays both aliphatic and aromatic hydrocarbon absorption features observed toward GCS 3.
5.1. T he 3.4,6.85,and 7.25kmAliphatic Hydrocarbon Features
Saturated aliphatic hydrocarbons exhibit CH stretching modes atD3.4km (methyl and methylene groups) and CH deformation modes at D6.9 km (methyl and methylene groups) andD7.3km (methyl group). The proÐle of the 3.4
km absorption features toward Sgr A* (Fig. 11), GCS 3 (Fig. 12), and GCS 4 is consistent with previous ground-based observations : substructure in the feature is identiÐed with the CH stretch in methyl (wCH3) and methylene groups, with an average ratio of (wCH2w)
in saturated aliphatic
hydrocar-wCH
2w/wCH3^2[2.5,
bons (Pendleton et al. 1994 ; Sandford et al. 1991). Sub-features caused by the symmetric and asymmetric vibrational stretching modes of the CH groups are indi-cated in the 3.2È3.9km optical depth spectrum for GCS 3 (Fig. 12).
The Sgr A* spectrum shows clear absorption features at 6.85 and 7.25 km (Fig. 11) caused by the asymmetric and symmetric CH deformation modes, respectively. The 6.85
km band is also weakly present in the spectrum of GCS 3, and may be present in the spectrum of GCS 4, consistent with the relatively weaker 3.4km absorption features (Table 2, Fig. 4). We do not attempt to quantify the central wave-lengths of the weak 6.85km features in the GCS 3 and GCS 4 spectra ; within reasonable uncertainties they are similar to that in Sgr A*. The signal-to-noise ratio of the GCS 3 and GCS 4 spectra in the 7 km region is not sufficient to detect the 7.25km band ; limits are given in Table 2. Using the Sgr A* spectrum, and assumingwCH
2w/wCH3\2.5,
3.30 3.40 3.50 Wavelength [microns] 0.20
0.15 0.10 0.05 0.00 -0.05
Optical Depth
Aromatics
Aliphatics
-CH3 -CH2- -CH3
-CH2-FIG. 12.ÈHydrocarbon features toward GCS 3, combining AOT6 (3.2È
3.5km) and AOT1 (3.5È3.6km) data. The optical depth spectrum was
created by Ðtting a local second-degree polynomial continuum to the com-bined spectra in 3.1È3.7km region. Aliphatic hydrocarbon subfeatures at D3.38km (wCH asymmetric stretch), 3.42 km asymmetric
3 (wCH2w
stretch), 3.48km(wCH symmetric stretch), and 3.50km
sym-3 (wCH2w
metric stretch) are indicated. The latter two subfeatures are blended. Also present is an aromatic hydrocarbon feature at 3.28km.
we calculated the expected ratio of integrated intensities for the 3.4, 6.85, and 7.25km bands for branched and normal saturated aliphatic hydrocarbons from values by Wexler (1967) (Table 4). The 6.85 and 7.25km feature proÐles are estimated using Lorentzian curves with FWHM\0.12km (26 cm~1), and 0.10km (19 cm~1), respectively, assuming that the 6.85 km feature is partially Ðlled in by emission features (because ofH2 and [Ar II] ; see Lutz et al. 1996). Integrated intensities for the astronomical data (Sgr A*) are determined using the equationqint\/qldland are listed in Table 4.
Integrated intensity ratios predicted for (branched) satu-rated aliphatic hydrocarbons are well matched by those calculated from our Sgr A* spectrum (Table 4). Hydro-genated amorphous carbon (HAC) material can contain a substantial fraction of saturated aliphatic hydrocarbon groups ; in fact, a HAC analog with H/C\0.5 and sp3/
sp2 \0.5 provides a reasonable match to the relative strength of the 3.4, 6.85, and 7.25km features in the Sgr A* spectrum (Fig. 13 ; Furton et al. 1999).
Protostars also show a prominent feature at 6.85km that appears to be associated with carriers residing in ices along
FIG. 13.ÈMid-IR spectrum of Sgr A* compared with laboratory HAC (dashed line; from Furton et al. 1999. Thebottom panelshows a close-up of the 3.4km feature compared with HAC).
the line of sight (Keane et al. 2000). The 6.85km ice band, however, extends from approximately 6.5 to 7.2km, which is much broader than that observed toward Sgr A*, GCS 3, and GCS 4 (Fig. 6). The ice proÐle varies in peak wave-length, width, and depth for di†erent protostellar objects and also correlates with the 3 km ice feature (Keane et al. 2000), whereas no such strong variation in the feature is observed toward the GC, even though there are clearly dif-ferent amounts of molecular cloud ices. Moreover, the 6.85
km optical depth is very similar in the three Galactic center sources despite the large di†erences in ice optical depth. Therefore, we attribute the 6.85km feature to dust in the
TABLE 4
ALIPHATICHYDROCARBONBANDS: SGRA*
Band (km) q(j
0) Integrated Area (cm~1)
3.4 (Sgr A*) . . . 0.21^0.01 29 6.85 (Sgr A*) . . . 0.05^0.01 1.6 7.25 (Sgr A*) . . . 0.03^0.01 0.7 Relative Integrated Intensity Observed Expecteda
A(6.85km)/A(7.25km) . . . 2.3 2.5 (branched), 5 (normal) A(6.85km)/A(3.4km) . . . 0.06 0.07
A(7.25km)/A(3.4km) . . . 0.02 0.03 (branched), 0.02 (normal)
3.2
3.25
3.3
0
0.01
0.02
0.03
Optical Depth
5.7
5.9
6.1
6.3
6.5
0
0.05
0.1
0.15
Wavelength (
µ
m)
TABLE 5
AROMATICHYDROCARBONBANDS: GCS 3a
Band FWHM Integrated Area
(km) q(j
0) (cm~1) (cm~1)
3.28 . . . 0.026^0.005 25^5 0.8^0.3 6.2 . . . 0.10^0.02 34^5 3.6^0.6
aUncertainty does not reÑect uncertainties in continuum choice.
di†use interstellar medium, related to the 3.4km aliphatic hydrocarbon feature, rather than molecular cloud ices.
5.2. Aromatic Hydrocarbon Features 5.2.1. T he 6.2kmBand
All the GC sources show evidence for the presence of a 6.2km (FWHM\34^5 cm~1) feature (Tables 2 and 5). This feature has been detected previously inISOspectra of GC sources and of four Wolf-Rayet stars and is attributed to the CwC stretch in aromatic hydrocarbons (Schutte et al. 1998).
The 6.2km proÐles presented here were determined by Ðrst Ðnding a satisfactory Ðt to the 3 and 6km ice features as described in°4.1, then subtracting this ““ Ðt ÏÏ from the 6
km absorption feature to obtain a residual spectrum (Figs. 7, 8, 9). The 6.2km proÐle for WR 118 is used as a template ““ di†use ISM ÏÏ spectrum since this line of sight is known to contain no molecular cloud material based on nonde-tections of typical molecular cloud features (H2O ice and van der Hucht et al. 1996 ; Schutte et al. 1998). In the CO
2:
cases of GCS 3 and GCS 4, this procedure leads to a residual that closely matches the (scaled) WR 118 6.2 km proÐle. Figure 8 (right panels) shows the result of adding the scaled WR 118 proÐle to the ice Ðts for these sources and shows that the 3 and 6 km proÐles can be accounted for fully by ices plus a di†use ISM component. In the case of Sgr A*, only the red side of the residual is accounted for by a di†use ISM (WR 118-like) component. The excellent
match of the red wing of the proÐles gives us conÐdence that Sgr A* does contain the same 6.2km feature seen in GCS 3, GCS 4, and the WR stars.
The 6.2km feature is most likely carried by dust unas-sociated with molecular cloud material since it is detected in lines of sight known to contain no ices (such as H
2O, CO2;
Schutte et al. 1998). In the Galactic center, the source with the strongest ice bands (Sgr A*) has the smallest 6.2 km feature. For all the sources studied, there appears to be a trend of increasing 6.2km feature depth withAV andq9.7
(Schutte et al. 1998) ; however, the depth of the 6.2 km feature in the Sgr A* spectrum seems to be anomalously weak with respect to its 9.7km silicate optical depth and its extinction in comparison with sources in the solar neigh-borhood (Schutte et al. 1998) and with GCS 3 and GCS 4. A depth of q6.2D0.13would be expected for Sgr A* if this quantity was correlated with the silicate depth. In contrast, the observed depth is only 0.05 (Table 2). Hence, it seems that the 6.2 km feature is carried by an independent com-ponent the abundance of which varies with respect to that of the silicates. We note that the total visual extinction (AV) also seems to vary independently of the 9.7km silicate band (Roche & Aitken 1985).
The presence of aromatic hydrocarbons can also be determined from observations of the complimentary 3.3km CwH stretch feature. This feature is discussed in more detail below.
5.2.2. T he 3.28kmAromatic Hydrocarbon Feature
The AOT6 spectrum of GCS 3 exhibits a weak absorp-tion feature centered at 3.28 km, with *l\25^5 cm~1, which we attribute to the CwH stretch in aromatic hydro-carbons (Fig. 12, Table 5). The CwH stretch in solid methane occurs near 3.32km, far from the observed feature, therefore we can rule out methane as a possible candidate for the absorption. The lower resolution/signal-to-noise AOT1 spectrum is also consistent with the presence of absorption centered at 3.28km. Presence of this feature in the AOT1 spectrum of GCS 4 cannot be ruled out. An absorption feature centered at j0D3.25 km (*l\74
FIG. 14.ÈAromatic CwH stretch (left) and CwC stretch (right) spectral regions in GCS 3 compared with aH (14 K) laboratory mixture
2O: C16H10
cm~1) has been detected in molecular cloud sources and is attributed to aromatic hydrocarbon molecules at low tem-perature (Sellgren et al. 1995 ; Brooke et al. 1999). The di†er-ence in central wavelength and width between these di†erent environments cannot be accounted for by uncer-tainties in the continuum Ðt but, rather, demonstrates the di†erence in the temperature and/or carrier of the aromatic material in these regions. Although there is a strong Pfd
atomic hydrogen line at 3.30km, there is no evidence for an underlying absorption feature at 3.28 km, to a limit of in the Sgr A* spectrum. This limit is consistent
q
3.28\0.02,
with the weakness of the 6.2km aromatic band in Sgr A*, thus we conclude that the 3.28 and 6.2 km features are caused by the same material.
Gas-phase PAHs are not likely carriers of the 3.28 km absorption feature : based on the temperature dependence of the gas-phase PAH proÐle determined in the laboratory by Joblin et al. (1995), a temperature of 600È1300 K is implied for the feature observed toward GCS 3. While such a high temperature is consistent with PAH emissionÈ indeed 3.28km is also the position of the unidentiÐed infra-red emission featureÈto get a PAH absorption feature would require an extraordinarily large column of hot gas. Comparison of the peak positions of matrix-isolated labor-atory PAHs given by Hudgins & Sandford (1998a,1998b) with our astronomical data show that neutral PAHs, such as pyrene, frozen in ices may be a good candidate for the observed feature. Laboratory studies carried out in the Astrophysics Laboratory at NASA/Ames of pyrene in H
2O
ice show a fair match to the 3.28 km feature (Fig. 14). However, this does not provide simultaneously a good Ðt to the observed interstellar 6.2km band (cf.°4.1.2, Fig. 14). In fact, as pointed out by Schutte et al. (1998), neutral PAHs have too weak an absorption feature to account for the observed strength of the 6.2 km feature. For that reason, Schutte et al. (1998) attributed the 6.2km band to ionized PAHs the CC modes of which are intrinsically much strong-er. Nevertheless, this assignment still requires 10% of the available carbon in the form of PAH cations for GCS 3 and GCS 4.
An origin of the 3.28km band in HACs is also possible. HACs, when heated, lose much of their hydrogen and their aromatic component grows in strength. The spectral char-acteristics of heat-treated HACs (Scott & Duley 1996 ; Blanco et al. 1988) resemble those observed toward GCS 3. At present, we cannot distinguish observationally whether free-Ñying, ionized PAHs or HACs are the carriers of the 3.28km band in the di†use ISM.
6
.
ORIGIN AND EVOLUTION OF ALIPHATIC AND
AROMATIC HYDROCARBON DUST
Whereas the distribution of aliphatic hydrocarbon dust, detected via the 3.4, 6.85, and 7.25km features, toward the GC shows little variation, aromatic hydrocarbons identiÐed via their CwH stretch (3.28km) and CwC stretch (6.2km), however, may not be evenly distributed throughout the GC region (°5.2). It has been proposed recently that the Quin-tuplet sources are dusty late-type WC stars. WC stars are descendants of massive (M[25M OB stars where
sub-_)
stantial mass loss and mixing have uncovered freshly syn-thesized material at the stellar surface. These objects are rich in He, C, and O (^10: 3: 1 by number), but there is no evidence for H or N (\10~2 and 10~3 relative to He by number ; Willis 1982 ; Nugis 1982 ; Torres 1988). Thus,
aro-matic dust associated with the 6.2km CwC stretch feature, detected toward GCS 3, GCS 4, and the well-known WR stars, may be associated with the environment of these objects instead of the general di†use ISM. One of the IR sources (IRS 6E) included in the ISO-SWS beam centered on Sgr A* has been identiÐed as a late-type WC star (Krabbe et al. 1995) ; this may explain the presence of a small amount of 6.2km absorption (relative to its deep 9.7
km silicate feature). However, while the WC stars may be responsible for producing the carrier(s) of the CwC stretch (6.2 km), they cannot be a signiÐcant contributor to the carrier(s) of the CwH stretch (3.28 km). At present, the connection between 3.28 and 6.2km absorption features is not well established observationally.
Various models have been proposed for the origin and evolution of these dust componentsÈices, aliphatic, and aromatic dustÈin the ISM. Of particular relevance are the processing of interstellar ices leading to organic grains (Greenberg 1989) and the processing of hydrogenated amorphous carbon (Scott & Duley 1996 ; Blanco et al. 1988). Ices are generally thought to form by accretion on preexisting silicate cores inside dense molecular clouds. These ices can be photolyzed by penetrating UV photons and may be converted into an organic refractory mantle. Laboratory studies have shown that this process may lead to a material with IR characteristics matching the observed interstellar 3.4km bands well (Greenberg et al. 1995 ; Alla-mandola, Sandford, & Valero 1988). However, such resi-dues invariably show much stronger absorption in the 5È8
km range because of residual oxygen bonded to the carbon structures. Such bands are not observed in the spectra of sources showing the 3.4km feature (Figs. 4, 11). Our results thus strengthen the argument (Chiar et al. 1998b ; Adamson et al. 1999 ; see°1) that the 3.4km carrier is not an organic refractory mantle produced by irradiation of ices in molecu-lar clouds.
the di†use ISM rather than circumstellar dust, we may actually be observing both the aromatic and aliphatic com-ponents involved in this process along these lines of sight. However, models of this type have problems too. In particu-lar, theoretical studies of dust destruction and observational studies of elemental depletions suggest that the lifetime of stardust is much shorter (3]108 yr) than the injection timescale by old stars (5]109yr), which suggests that dust formation in the ISM is very important (Jones et al. 1994, 1996). Now, in the models, ices accreted inside dense molec-ular clouds, would be rapidly destroyed when the molecmolec-ular cloud is dispersed. In an evolutionary sense, ices would have little inÑuence on the dust composition in the di†use ISM. However, it has been suggested that organic residues pro-duced by UV photolysis of interstellar ices are rapidly car-bonized (H, O, and N are lost) by the strong far-UV Ðelds in the di†use ISM and that this leads to a HAC-like mantle (Jenniskens et al. 1993). It remains puzzling then that, while interstellar ice, as well as silicate, features can be polarized, the 3.4km aliphatic hydrocarbon feature is not (Adamson et al. 1999). Possibly, this might imply a link between the aliphatic hydrocarbon carriers of the 3.4km feature and the aromatic carrier of the 2175A bump that is also not po-larized (Martin et al. 1999). In any case, an HAC-like material with very few oxygen impurities, is the carrier of the 3.4, 6.85, and 7.25 km features. Further observations, particularly of the 3.28, 3.4, and 6.2km bands will be instru-mental in settling the origin and evolution of this com-ponent.
7
.
SUMMARY
We have identiÐed molecular cloud and di†use inter-stellar medium material along the line of sight to the Galac-tic center using ISO-SWS data for three sight lines. The amount of molecular cloud material varies across the GC Ðeld, and the amount of di†use ISM material shows little variation. This is supported by our observations of the 3km
ice feature that ranges between and
H2O q3.0\0.16 q3.0\
0.50, and the 3.4 km aliphatic hydrocarbon feature that ranges betweenq and The line of sight
3.4\0.15 q3.4\0.21.
toward Sgr A* contains the largest column of molecular cloud material, relative to GCS 3 and GCS 4, apparent from the depth of the 3 km ice feature. Toward all GC sources discussed in this paper,CO ice is detected, and CO
2
is present mainly in the gas phase. Toward Sgr A*, solid has also been clearly identiÐed. As the amount of solid CH4
relative to is higher toward the Quintuplet CO
2 H2O
sources in comparison to that toward Sgr A*, there may be more than one molecular cloud associated with the overall GC region. However, the processes that control the solid abundance are not well understood (e.g., Whittet et al. CO
2
1998 ; Gerakines et al. 1999).
In many ways, the molecular clouds along the line of sight toward the Galactic center are similar to local molecu-lar clouds in terms of abundances of key solid state mol-ecules (Table 6). Water-ice remains the most abundant solid state molecule ; the solidCO2/H2Oratio is within the range found for local molecular clouds (Gerakines et al. 1999) ; is similar to that observed in quiescent CH3OH/H2O
clouds such as Taurus (Chiar et al. 1996) and does not resemble the higher abundance observed toward heavily embedded massive protostars. While solid CO is not detected in the sight lines discussed here, a weak 4.67 km
TABLE 6
COMPARISON OFICEABUNDANCES TOWARDSAGITTARIUSA*
ANDNGC 7538 IRS 9a
Molecule Sgr A* NGC 7538 IRS 9 Referencesb
H
2O . . . 100 100 1
NH
3. . . 20È30 10 2
CO
2. . . 14 20 3
CO . . . \12 15 4 CH
3OH . . . \4 7 5
CH
4. . . 2 2 6
HCOOH . . . 6 3 7
aAbundances are percentages relative toH ice.
2O
bReferences are for NGC 7538 IRS 9 ice column densities. Column densities for Sgr A* are from this paper.
REFERENCES.È(1) Tielens et al. 1991 ; (2) Lacy et al. 1998 ; (3) Gerakines et al. 1999 ; (4) Chiar et al. 1998a ; (5) Dartois et al. 1999 ; (6) Boogert et al. 1998 ; (7) Schutte et al. 1999.
feature has been detected previously (McFadzean et al. 1989). TheCO/H2Oratio implied is less than 10%. The 3.0
km ice proÐle is indicative of the temperature as well as the content of the ices. The proÐle observed toward the GC is distinct from that seen in local molecular clouds such as Taurus. It is consistent with cold (D15 K) ices, similar to local quiescent dense clouds, but setting this feature apart from those studied in local clouds is substructure at 2.95km indicative of a relatively high abundance (up to D30%, relative toH of in the ices. Toward local molecular
2O) NH3
cloud sources, the solidNH3/H2O abundance is observed to beD10% (e.g., Whittet et al. 1996, Lacy et al. 1998). The high ammonia abundance in GC molecular clouds could reÑect the higher N/O ratio in the inner Galaxy.
Aliphatic hydrocarbons, Ðrst detected via their 3.4 km CH stretch feature, are a widespread component of the di†use interstellar medium.ISO-SWS has detected for the Ðrst time the corresponding CwH deformation modes at 6.85 and 7.25 km in the line of sight toward the Galactic center. The ratio of integrated intensities for these three absorption features are consistent with the predicted values for saturated aliphatic hydrocarbons (Wexler 1967). Hydro-genated amorphous carbon containing a substantial frac-tion of saturated aliphatic hydrocarbon groups provides a convincing match to the observed hydrocarbon absorption features and is the likely carrier of these features.
Aromatic hydrocarbons, detected via their 3.3km CwH and 6.2km CwC stretching vibrations, do not appear to be evenly distributed throughout the Galactic center. Absorp-tion at 3.28km is detected in the line of sight toward GCS 3 but not toward Sgr A*. In addition, the 6.2km absorption feature toward Sgr A* is much weaker than that toward the Quintuplet sources. Although our results suggest that the 3.28 and 6.2km features are caused by the same carrier, it remains unclear whether the CwC stretch absorption feature could instead be produced by dusty C-rich WR stars and is thus independent of the CwH stretch feature.
REFERENCES Adamson, A. J., Whittet, D. C. B., Chrysostomou, A., Hough, J. H., Aitken,
D. K., Wright, G. S., & Roche, P. F. 1999, ApJ, 512, 224
Aitken, D. K., Briggs, G. P., Roche, P. F., Bailey, J. A., & Hough, J. H. 1986, MNRAS, 218, 363
Allamandola, L. J., Sandford, S. A., Tielens, A. G. G. M., & Herbst, T. M. 1992, ApJ, 399, 134
Allamandola, L. J., Sandford, S. A., & Valero, G. J. 1988, Icarus, 76, 225 Becklin, E. E., Matthews, K., Neugebauer, G., & Willner, S. P. 1978, ApJ,
219, 121
Blanco, A., Bussoletti, E., & Colangeli, L. 1988, ApJ, 334, 875
Boogert, A. C. A., Helmich, F. P., van Dishoeck, E. F., Schutte, W. A., Tielens, A. G. G. M., & Whittet, D. C. B. 1998, A&A, 336, 352
Boogert, A. C. A., Schutte, W. A., Helmich, F. P., Tielens, A. G. G. M., & Wooden, D. H. 1997, A&A, 317, 929
Boogert, A. C. A., et al. 1996, A&A, 315, L377
Bridger, A., Wright, G., & Geballe, T. 1993, in Conference Abstract Volume of Infrared Astronomy with Arrays : The Next Generation, ed. I. McLean (Los Angeles : UCLA Dept. of Astronomy), 537
Brooke, T. Y., Sellgren, K., & Geballe, T. R. 1999, ApJ, 517, 883
Butchart, I., McFadzean, A. D., Whittet, D. C. B., Geballe, T. R., & Green-berg, J. M. 1986, A&A, 154, L5
Chiar, J. E., Adamson, A. J., & Whittet, D. C. B. 1996, ApJ, 472, 665 Chiar, J. E., Gerakines, P. A., Whittet, D. C. B., Pendleton, Y. J., Tielens,
A. G. G. M., & Boogert, A. C. A. 1998a, ApJ, 498, 716
Chiar, J. E., Pendleton, Y. J., Geballe, T. G., & Tielens, A. G. G. M. 1998b, ApJ, 507, 281
Dartois, E., Schutte, W., Geballe, T. R., Demyk, K., Ehrenfreund, P., & dÏHendecourt, L. 1999, A&A, 342, L32
de Graauw, T., et al. 1996a, A&A, 315, L49 ÈÈÈ. 1996b, A&A, 315, L345
dÏHendecourt, L., et al. 1996, A&A, 315, L365
Duley, W. W., Scott, A. D., Seahra, S., & Dadswell, G. 1998, ApJ, 503, L183 Duley, W. W., & Williams, D. A. 1995, MNRAS, 272, 442
Eckart, A., Genzel, R., Hofmann, R., Sams, B. J., & Tacconi-Garman, L. E. 1995, ApJ, 445, L23
Figer, D. F., McLean, I. S., & Morris, M. 1999, ApJ, 514, 202 Furton, D. G., Laiho, J. W., & Witt, A. N. 1999, ApJ, 526, 752 Furton, D. G., & Witt, A. N. 1993, ApJ, 415, L51
Gerakines, P. A., Schutte, W. A., & Ehrenfreund, P. 1996, A&A, 312, 289 Gerakines, P. A., Schutte, W. A., Greenberg, J. M., & van Dishoeck, E. F.
1995, A&A, 296, 810
Gerakines, P. A., et al. 1999, ApJ, 522, 357
Giard, M., Serra, G., Caux, E., Pajot, F., & Lamarre, J. M. 1988, A&A, 201, L1
Gibb, E. L., et al. 2000, ApJ, 536, 347
Greenberg, J. M. 1989, in IAU Symp. 135, Interstellar Dust, ed. L. J. Allamandola & A. G. G. M. Tielens (Dordrecht : Reidel), 345
Greenberg, J. M., Li, A., Mendoza-Gomez, C. X., Schutte, W. A., Gera-kines, P. A., & De Groot, M. 1995, ApJ, 455, L177
Hagen, W., & Tielens, A. G. G. M., & Greenberg, J. M. 1981, Chem. Phys., 56, 367
Hudgins, D. M., & Sandford, S. A. 1998a, J. Phys. Chem. A, 102, 329 ÈÈÈ. 1998b, J. Phys. Chem. A, 102, 344
Hudgins, D. M., Sandford, S. A., Allamandola, L. J., & Tielens, A. G. G. M. 1993, ApJS, 86, 713
Jenniskens, P., Baratta, G. A., Kouchi, A., De Groot, M. S., Greenberg, J. M., & Strazzulla, G. 1993, A&A, 273, 583
Joblin, C., Boissel, P., Leger, A., DÏHendecourt, L., & Defourneau, D. 1995, A&A, 299, 835
Jones, A. P., Tielens, A. G. G. M., & Hollenbach, D. J. 1996, ApJ, 469, 740 Jones, A. P., Tielens, A. G. G. M., Hollenbach, D. J., & McKee, C. F. 1994,
ApJ, 433, 797
Keane, J. V., Tielens, A. G. G. M., Boogert, A. C. A., Schutte, W. A., & Whittet, D. C. B. 2000, A&A, submitted
Kobayashi, Y., Okuda, H., Sato, S., Jugaku, J., & Dyck, H. M. 1983, PASJ, 35, 101
Krabbe, A., et al. 1995, ApJ, 447, L95
Lacy, J. H., Faraji, H., Sandford, S. A., & Allamandola, L. J. 1998, ApJ, 501, L105
Lebofsky, M. J., Rieke, G. H., & Tokunaga, A. T. 1982, ApJ, 263, 736
Lequeux, J., & Jourdain de Muizon, M. 1990, A&A, 240, L19 Lutz, D., et al. 1996, A&A, 315, L269
Y. 1987, J. Chem. Phys., 87, 6344 Marechal,
Martin, P. G., Clayton, G. C., & Wol†, M. J. 1999, ApJ, 510, 905
Mattila, K., Lemke, D., Haikala, L. K., Laureijs, R. J., Leger, A., Lehtinen, K., Leinert, C., & Mezger, P. G. 1996, A&A, 315, L353
McFadzean, A. D., Whittet, D. C. B., Bode, M. F., Adamson, A. J., & Longmore, A. J. 1989, MNRAS, 241, 873
McKee, C. F. 1989, ApJ, 345, 782
Moneti, A., & Cernicharo, J. 2000, ApJ, submitted
Moneti, A., Glass, I., & Moorwood, A. 1992, MNRAS, 258, 705 ÈÈÈ. 1994, MNRAS, 268, 194
Moore, M. H., Ferrante, R. F., & Nuth, J. A. I. 1996, Planet. Space Sci., 44, 927
Nagata, T., Woodward, C. E., Shure, M., Pipher, J. L., & Okuda, H. 1990, ApJ, 351, 83
Nugis, T. 1982, in Wolf Rayet Stars : Observations, Physics, Evolution, ed. C. W. H. de Loore & A. J. Willis (Dordrecht : Kluwer), 131
Ogmen, M., & Duley, W. W. 1988, ApJ, 334, L117 Okuda, H., et al. 1990, ApJ, 351, 89
Pendleton, Y. J., Sandford, S. A., Allamandola, L. J., Tielens, A. G. G. M., & Sellgren, K. 1994, ApJ, 437, 683
Pendleton, Y. J., Tielens, A. G. G. M., & Werner, M. W. 1990, ApJ, 349, 107 Rieke, G. H., Rieke, M. J., & Paul, A. E. 1989, ApJ, 336, 752
Ristorcelli, I., Giard, M., Meny, C., Serra, G., Lamarre, J. M., Le Naour, C., Leotin, J., & Pajot, F. 1994, A&A, 286, L23
Roche, P. F., & Aitken, D. K. 1985, MNRAS, 215, 425
Rubin, R. H., Simpson, J. P., Erickson, E. F., & Haas, M. R. 1988, ApJ, 327, 377
Sandford, S. A., Allamandola, L. J., Tielens, A., Sellgren, K., Tapia, M., & Pendleton, Y. 1991, ApJ, 371, 607
Schutte, W. A., et al. 1999, A&A, 343, 966
Schutte, W. A., Gerakines, P. A., Geballe, T. R., van Dishoeck, E. F., & Greenberg, J. M. 1996a, A&A, 309, 633
Schutte, W. A., & Greenberg, J. M. 1989, in Dust in the Universe, ed. M. E. Bailey & D. A. Williams (Cambridge : Cambridge Univ. Press), 403 Schutte, W. A., et al. 1996b, A&A, 315, L333
ÈÈÈ. 1998, A&A, 337, 261
Scott, A., & Duley, W. W. 1996, ApJ, 472, L123
Sellgren, K., Brooke, T. Y., Smith, R. G., & Geballe, T. R. 1995, ApJ, 449, L69
Sellgren, K., Hall, D. N. B., Kleinmann, S. G., & Scoville, N. Z. 1987, ApJ, 317, 881
Simpson, J. P., Colgan, S. W. J., Rubin, R. H., Erickson, E. F., & Haas, M. R. 1995, ApJ, 444, 721
Skinner, C. J., Tielens, A. G. G. M., Barlow, M. J., & Justtanont, K. 1992, ApJ, 399, L79
Smith, R. G., Sellgren, K., & Tokunaga, A. T. 1989, ApJ, 344, 413
Strazzulla, G., Castorina, A. C., & Palumbo, M. E. 1995, Planet. Space Sci., 43, 1247
Tielens, A. G. G. M., & Allamandola, L. J. 1987, in Interstellar Processes, ed. D. Hollenbach & H. Thronson (Dordrecht : Kluwer), 397
Tielens, A. G. G. M., Tokunaga, A. T., Geballe, T. R., & Baas, F. 1991, ApJ, 381, 181
Tielens, A. G. G. M., Wooden, D. H., Allamandola, L. J., Bregman, J., & Witteborn, F. C. 1996, ApJ, 461, 210
Torres, A. V. 1988, ApJ, 325, 759
van der Hucht, K. A., et al. 1996, A&A, 315, L193 Vriend, W. J. 2000, MasterÏs thesis, Univ. of Groningen Wada, S., Sakata, A., & Tokunaga, A. T. 1991, ApJ, 375, L17 Wexler, A. S. 1967, Appl. Spectrosc. Rev., 1, 29
Whittet, D. C. B., et al. 1997, ApJ, 490, 729 ÈÈÈ. 1998, ApJ, 498, L159
ÈÈÈ. 1996, ApJ, 458, 363
Willis, A. J. 1982, in Wolf Rayet Stars : Observations, Physics, Evolution, ed. C. W. H. de Loore & A. J. Willis (Dordrecht : Kluwer), 87
Willner, S. P., Russell, R. W., Puetter, R. C., Soifer, B. T., & Harvey, P. M. 1979, ApJ, 229, L65