R E S E A R C H
Open Access
Do sputum or circulating blood samples
reflect the pulmonary transcriptomic
differences of COPD patients? A
multi-tissue transcriptomic network
META-analysis
Rosa Faner
1*, Jarrett D. Morrow
2, Sandra Casas-Recasens
1, Suzanne M. Cloonan
3, Guillaume Noell
1,
Alejandra López-Giraldo
1,4, Ruth Tal-Singer
5, Bruce E. Miller
5, Edwin K. Silverman
2, Alvar Agustí
1,4and
Craig P. Hersh
2Abstract
Background:Previous studies have identified lung, sputum or blood transcriptomic biomarkers associated with the severity of airflow limitation in COPD. Yet, it is not clear whether the lung pathobiology is mirrored by these surrogate tissues. The aim of this study was to explore this question.
Methods:We used Weighted Gene Co-expression Network Analysis (WGCNA) to identify shared pathological mechanisms across four COPD gene-expression datasets: two sets of lung tissues (L1n= 70; L2n= 124), and one each of induced sputum (S;n= 121) and peripheral blood (B; n = 121).
Results:WGCNA analysis identified twenty-one gene co-expression modules in L1. A robust module preservation between the two L datasets was observed (86%), with less preservation in S (33%) and even less in B (23%). Three modules preserved across lung tissues and sputum (not blood) were associated with the severity of airflow limitation. Ontology enrichment analysis showed that these modules included genes related to mitochondrial function, ion-homeostasis, T cells and RNA processing. These findings were largely reproduced using the consensus WGCNA network approach.
Conclusions:These observations indicate that major differences in lung tissue transcriptomics in patients with COPD are poorly mirrored in sputum and are unrelated to those determined in blood, suggesting that the systemic component in COPD is independently regulated. Finally, the fact that one of the preserved modules associated with FEV1 was enriched in mitochondria-related genes supports a role for mitochondrial dysfunction in the pathobiology of COPD.
Keywords:mRNA, Chronic bronchitis, Emphysema, Co-expression network analysis
* Correspondence:[email protected]
1Centro de Investigación Biomédica en Red de Enfermedades Respiratorias (CIBERES), C/Casanova 143, Cellex, P2A, 08036 Barcelona, Spain
Full list of author information is available at the end of the article
Background
Chronic Obstructive Pulmonary Disease (COPD) is de-fined, and its severity graded, simply by the presence of persistent airflow limitation, as determined by the forced expiratory volume in 1 s (FEV1) and the ratio of FEV1 to forced vital capacity (FVC) [1]. However, COPD is a complex and heterogeneous disease, both clinically [2] and molecularly [3,4], and often patients have both pul-monary and systemic manifestations [5]. On the other hand, since the lung parenchyma is difficult to access, the pathobiology of COPD is often studied in surrogate tissue samples, such as sputum or circulating blood. In these surrogate tissues, different mRNAs whose expres-sion is associated with the severity of airflow limitation have been identified. [6–11] Yet, the relationship of changes in these surrogate tissues with those occurring in the lung parenchyma is unclear.
Network analysis is a novel research strategy well-suited to integrate and analyze complex data sets and to investi-gate complex and heterogenous diseases such as COPD [3,12]. Weighted gene co-expression network correlation-based analysis (WGCNA) is a particular type of network analysis that allows the identification of modules of co-expressed genes in a given transcriptomic dataset, the investigation of the degree of module preservation in other datasets, and the study of their relationship with clinical features of interest [13–15]. This network based comparison can be performed using data from different technological platforms [13–15]. Here, we used WGCNA to meta-analyse four previously published COPD tran-scriptomic datasets determined in lung tissue (L), blood (B) and sputum (S) [3,16–18](1)to identify L modules re-lated with FEV 1,(2)to investigate if these L modules are preserved in S and/or B data sets, and (3) to investigate the biological processes associated with these modules.
Methods
Methods are detailed in the Additional file1. Participants and data sets
We used four transcriptomic datasets generated by three different COPD studies in Lung (L1 [3] and L2 [16]), in-duced sputum (S) and circulating blood (B) [17, 18]. L1 included 70 lung tissue samples obtained from COPD patients who spanned all GOLD grades (1–4) of airflow limitation severity [3], L2 included 90 lung tissue sam-ples from COPD patients with GOLD grades 3–4 and 34 former smokers with normal lung function. The S and B datasets were obtained from 121 COPD patients in-cluded in the ECLIPSE study with GOLD grades 2–4 [17]. To avoid a potential confounder effect of active smoking on transcriptomics, all participants were former smokers, who had been abstinent from smoking for at least one month before tissue sampling. The selected
datasets fulfilled the following criteria: including former smokers with COPD (to avoid the influence of the active smoking exposure in the transcriptomic results), large sample size (n > =70), being of the same individual (blood and sputum).
Ethics statement
The Ethic Committees of the participating institutions approved each of these three studies, and all participants provided written informed consent prior to the perform-ance of any study procedures.
Gene expression
The methodology for microarray hybridization has been described previously [3,16–18]. All datasets are available
on the Gene Expression Omnibus website, http://
www.ncbi.nlm.nih.gov/geo/ (GSE69818, GSE4837, GSE22 148 and GSE76925). The array platforms used in each cohort were: i) L1, Human Genome U219 Array Plate (Affymetrix, Santa Clara, CA, USA), ii) L2, HumanHT-12 v4 Expression BeadChip Kit (Illumina, San Diego, USA); and iii) S and B (ECLIPSE), HG_Plus_2.0 GeneChips (Affymetrix, Santa Clara, CA, USA).
qPCR validation
In 20 additional lung tissue samples, recruited at Hos-pital Clinic of Barcelona (characteristics provided in the Additional file 1), the expression of MPV17L2, TSFM, and NDUFA3 was assessed by qPCR using TaqMan as-says and 2ΔCP with ACTB as the housekeeping gene, based on previously described methods [3].
Data analysis
Quantitative clinical data is presented as mean ± stand-ard deviation and compared between groups using one-way ANOVA. Microarray pre-processing of each dataset has been previously described [3,16–18]. For the present analysis, probes in the lowest quartile of variabil-ity were removed, and array probes were collapsed to genes, yielding 10,434 genes for final analysis.
Weighted gene co-expression network meta-analysis The WGCNA meta-analysis was performed using the WGCNA R package [13,14] following the previously de-scribed meta-analysis pipeline [15]. A step by step tutor-ial on how to perform the WGCNA package can be found at: https://horvath.genetics.ucla.edu/html/Coex-pressionNetwork/Rpackages/WGCNA/Tutorials/.
size 30. WGCNA produces a set of modules (labeled by color), each containing a set of unique genes. Next, the preservation of the modules across the other three data-sets was assessed using the modulePreservation function with 100 permutations; Zsummary values > 5 were con-sidered as preserved modules [15, 19]. The module
eigengenevalue (i.e., the first principal component of the expression matrix of the probes within the module) was calculated and used to test for association with the se-verity of airflow limitation (as expressed by the FEV1%
predicted) after adjusting for gender and body mass index (BMI) [20]. False discovery rate (FDR) < 0.05 was used to define association. Driver genes were identified as those with highest Module Membership (kME) in LT1 modules that also have highest kME in the same modules in the other datasets [15]. To test the association of blood gene expression with level of airflow limitation and verify the lack of association, WGCNA modules were defined for this dataset independently of the others, and their as-sociation with FEV1 was calculated.
Enrichment analysis
To identify over-represented pathways in co-expression modules related to FEV1% predicted, we used
hypergeo-metric tests in the R Bioconductor package GeneAnswers [21], the Vignettes describing how to use the pipeline are available from Bioconductor ( https://www.bioconductor.-org/). Significant enrichment was defined as FDR < 0.05, with five or more genes associated to the term. To evaluate the term overlap and obtain a visual summary we used REVIGO [22], a tutorial is available at:http://revigo.irb.hr/). Consensus network
A WGCNA consensus network was built using data from L1, L2 and S using the blockwiseConsensusMo-dules function with a softpower of 12, minModuleSize of 30, a maxBlockSize of 10,434, a corType“bicor”, and the
network and the TOM were signed [19]. Then, we used linear regression with adjustment for gender and BMI to identify modules associated with FEV1% predicted [20].
Results
Characteristics of participants
Table 1 describes the main characteristics of partici-pants. All patients were Caucasians and former smokers. There were more women in the L2 cohort, and ECLIPSE participants had smoked fewer pack-years, but age and BMI were similar across the three studies.
Network based transcriptomic meta-analysis
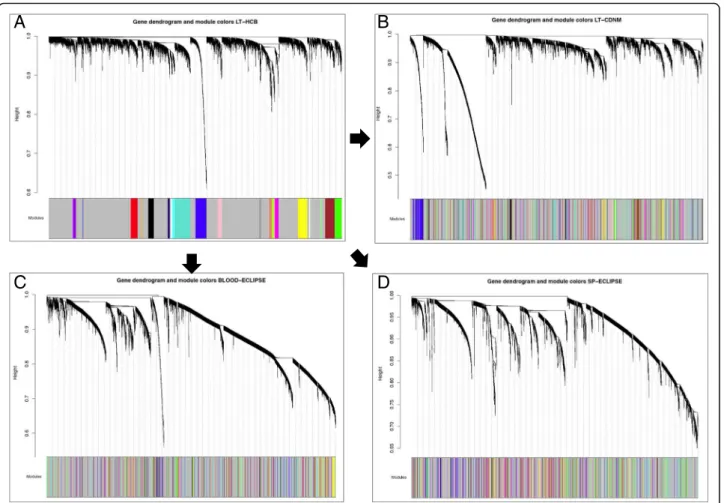
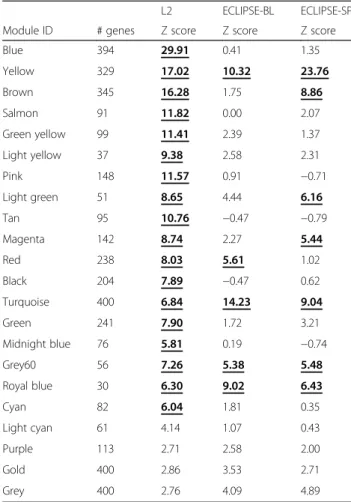
Using WGCNA [13], we identified 21 modules with a minimum size of 30 genes in the L1 (Fig. 1, panel A). These modules were also identified in L2, S and B datasets (Fig.1, panels B/C/D). Using the Z preservation score, we ranked their preservation across datasets (Table 2). Z-score values > 5 are considered preserved modules [19]. Four modules (19%) were preserved across all datasets (Table 2). Eighteen modules (86%) were preserved in the two lung tissue datasets, whereas seven (33%) were also preserved in sputum, and five (24%) were preserved in blood (Table2). The negative control, a random selection of genes (gold module), was not preserved in any group.
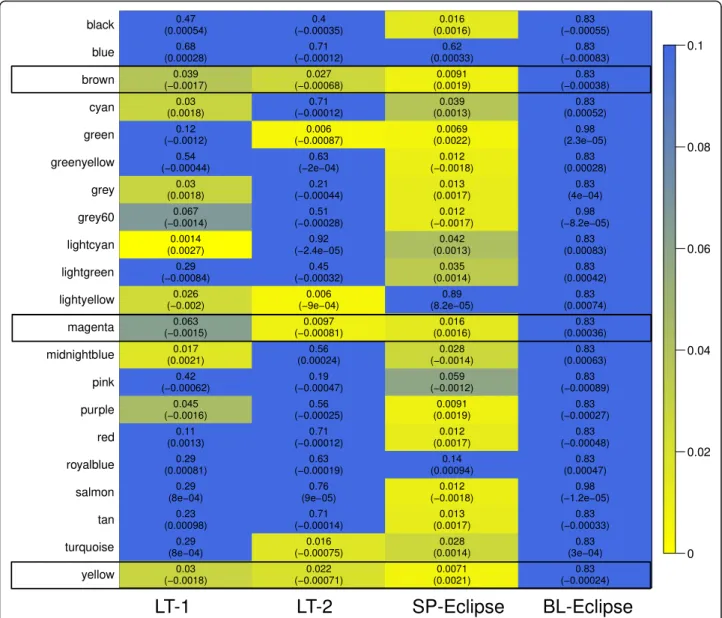
Association with lung function
To investigate the relationships between identified mod-ules and FEV1, we performed a linear regression of each module Eigengene with the FEV1% predicted as the
dependent variable, after adjusting for covariates (gender and BMI). Results are displayed in the form of a heat map in Fig. 2 (p-value and effect estimate). No blood module was associated with FEV1% at p< 0.05, even when the module definition was done in the blood dataset, (Additional file 2: Figure S1). By contrast, 8 modules (38%) were significantly associated with airflow
Table 1Characteristics of the 3 cohorts (4 transcriptomic datasets)
L1 L2 ECLIPSE
Sample Type and GEO accession number Lung Tissue Lung Tissue Sputum & Blood pvalue
GSE69818 GSE76925 GSE22148, GSE76705
Number of COPD/Controls 70/0 90 /34 121/0
Gender (M/F) 63/7 57/67 81/40 0.0005
Age 66.3 ± 8.6 64.3 ± 7.3 65.1 ± 5.5 ns
Current/Former Smokers 0/70 0/124 0/121 ns
Pack-years of smoking 56.5 ± 26.1 57.2 ± 28.6 47.1 ± 29.2 0.012
BMI 27.5 ± 4.5 26.2 ± 4.6 26.6 ± 4.9 ns
FEV1% predicted 57.9 ± 21.1 46.1 ± 34.0 48.9 ± 15.1 < 0.0001
FEV1/FVC 52.8 ± 12.3 45.1 ± 22.8 42.6 ± 11.8 0.0075
limitation in L1, 6 (28%) in L2, and 17 (81%) in S; 3 of them were preserved in L1, L2 and S:yellow(329 genes),
brown (345 genes) and magenta (142 genes) modules (Fig. 2, Table2and Additional file3: Table S1). The yel-lowmodule (Fig.3a, Additional file4: Table S2) included ontologies related to mitochondrial function, signal transduction by p53, hydrogen ion transmembrane transport and MHC class I antigen processing/presenta-tion. Accordingly, KEGG pathways analysis showed en-richment in oxidative phosphorylation, metabolic and spliceosome pathways (Additional file 5: Table S3). The
brown module (Fig. 3b, Additional file 4: Table S2) in-cludes ontologies related to endocytosis, lysosome organization, ion homeostasis, nucleotide metabolism and T cell activation. KEGG pathway analysis showed enrichment in Lysosome and Phagosome pathways (Additional file5: Table S3). Finally, themagentamodule (Fig. 3c, Additional file 4: Table S2) includes ontologies related to noncoding RNA metabolism, cellular response to cytokine stimulus and iron transmembrane transport.
KEGG analysis showed enrichment in the Ribosome bio-genesis pathway (Additional file5: Table S3).
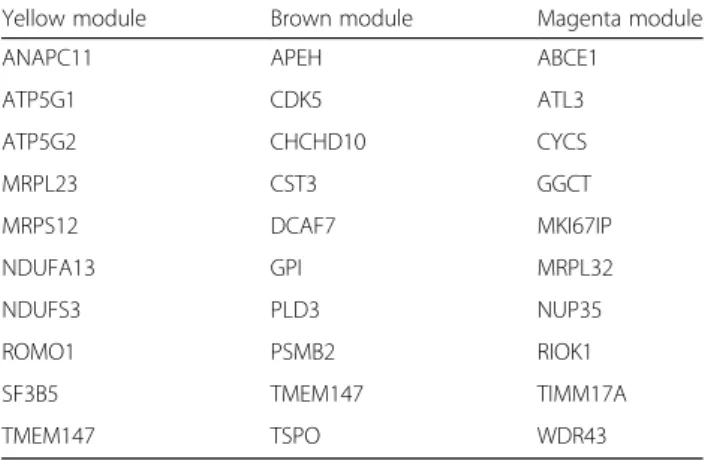
We defined driver genes in a module as those genes both associated with the severity of airflow limitation and also highly correlated with other genes in that mod-ule in all datasets (see methods) [15]. Table 3 lists the driver genes in the three modules of interest and highlighted in bold those genes that are included the enriched gene ontology categories. In theyellowmodule, ANAPC11, ATP5G1, ATP5G2, and NDUFA13 were in-cluded in the mitochondrial related ontologies. In the
brownmodule, APEH and GPI were included in the me-tabolism related ontologies. In the magenta module ABCE1, MKI67IP, RIOK1, TIMM17A and WDR43 were included in the RNA related ontologies.
Only one module, Lightcyan,was preserved and asso-ciated with FEV1% in both lung tissue datasets but not in blood or sputum (Fig. 2, Table 2). Interestingly this module contained a set of genes related to B-lymphocyte biology (Additional file4: Table S2).
A
B
C
D
Fig. 1Co-expression network dendrograms in the 4 datasets. (a) L1 co-expression network, with twenty-one modules with a minimum module size of 30. (b) L2 co-expression network. (c) Blood co-expression network. (d) Sputum co-expression network. The color code in parts B, C, and D corresponds to the modules identified in L1 (part A). For further details on analytical method
Consensus co-expression network of lung tissue and sputum
The network meta-analysis method does not assume module preservation, yet we identified multiple modules that are highly preserved in the other lung tissue dataset and the sputum datasets. To verify these results, we built a consensus network including the two lung tissue data sets and the sputum data set (as detailed in Additional file 1), which assumes preservation between datasets. Blood was not included, since none of the blood mod-ules were related to the level of airflow limitation.
The consensus WGCNA network identified 14 con-sensus modules (Additional file 6: Figure S2). Figure 4
shows the overlapping gene composition between these 14 consensus modules and the 21 WGCNA modules de-rived from lung tissue. The yellow WGCNA module and the brown consensus module shared 56.2% of their genes. The brown WGCNA module and the green con-sensus module shared 31.6% of genes. The WGCNA magenta module and the pink consensus module shared 26.1% of genes. In keeping with WGCNA results, the brown, green, and pink consensus modules were also
associated with the severity of airflow limitation (Additional file 7: Figure S3).
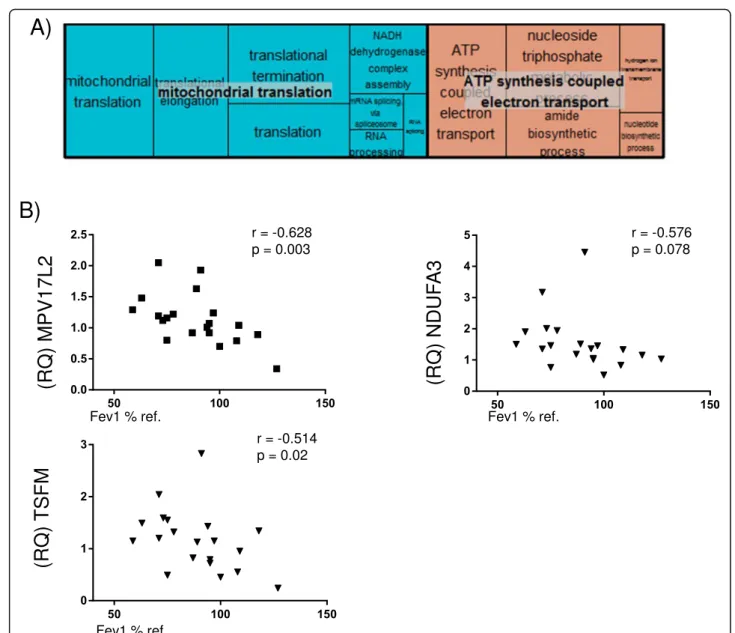
Core of co-expressed genes and related ontologies We found that, out of the 185 genes shared by the yel-low WGCNA module and the brown consensus module, 60 genes were nominally associated with FEV1% pre-dicted at p< 0.1 in lung tissue and sputum (Additional file 8: Table S4); Gene Ontology analysis showed enrich-ment in mitochondrial-related ontologies (Fig. 5a, Additional file 9: Table S5). Three mitochondrial-related genes were selected for qPCR validation on the basis of significant association with FEV1% in L1 and L2: NADH
dehydrogenase 1 alpha subcomplex subunit 3
(NDUFA3), Ts Translation Elongation Factor, Mitochon-drial (TSFM), and MPV17 MitochonMitochon-drial Inner Mem-brane Protein Like 2 (MPV17L2). Additional file 10: Figure S4 shows the gene expression of these three genes in L1 and L2 samples, and Fig.5shows that the relative expression of these genes (RQ) was also negatively cor-related with the severity of airflow limitation in lung tis-sue obtained from 12 additional COPD patients and 8 controls.
Discussion
We performed a gene co-expression network analysis in COPD datasets from two separate lung tissue studies, sputum, and blood. The main results show (1) robust gene module preservation between the two lung tissue datasets, with less preservation in sputum and even less in blood; (2) an association of the modules identified in the two lung tissue datasets and sputum (but not in blood) with the severity of airflow limitation (FEV1); and
(3) that these findings were largely reproduced in a consensus WGCNA network. Taken together, these ob-servations indicate that major changes in lung tran-scriptomics in patients with COPD are poorly mirrored in sputum and are unrelated to those determined in blood.
Previous studies
Obeidat et al. recently used WGCNA to investigate blood transcriptomics in COPD patients (n= 238) [23]; however, our study used WGCNA to compare lung tis-sue, sputum and blood samples in COPD patients. While we found no gene modules associated with lung function in blood, Obeidat et al. identified 3 blood mod-ules associated with FEV1. Differences between the two studies may be related to their larger sample size (238 vs. 121 patients). The gene ontology enrichments of these three blood modules [23] were different from those identified in preserved in lung and sputum in the present analysis, supporting that lung and blood are in-dependent compartments in COPD [24], arguing against
Table 2Module preservation across the different datasets L2 ECLIPSE-BL ECLIPSE-SP
Module ID # genes Z score Z score Z score
Blue 394 29.91 0.41 1.35
Yellow 329 17.02 10.32 23.76
Brown 345 16.28 1.75 8.86
Salmon 91 11.82 0.00 2.07
Green yellow 99 11.41 2.39 1.37
Light yellow 37 9.38 2.58 2.31
Pink 148 11.57 0.91 −0.71
Light green 51 8.65 4.44 6.16
Tan 95 10.76 −0.47 −0.79
Magenta 142 8.74 2.27 5.44
Red 238 8.03 5.61 1.02
Black 204 7.89 −0.47 0.62
Turquoise 400 6.84 14.23 9.04
Green 241 7.90 1.72 3.21
Midnight blue 76 5.81 0.19 −0.74
Grey60 56 7.26 5.38 5.48
Royal blue 30 6.30 9.02 6.43
Cyan 82 6.04 1.81 0.35
Light cyan 61 4.14 1.07 0.43
Purple 113 2.71 2.58 2.00
Gold 400 2.86 3.53 2.71
Grey 400 2.76 4.09 4.89
Modules are considered preserved if Z score is > 5 (in bold and underlined in the table), and highly preserved if Z score is > 10 as described in
the so-called “spill-over” hypothesis, which states that the systemic manifestations of the disease are the result of the release to the circulation of lung inflammatory mediators [25].
Interpretation of findings
Three modules associated with FEV1 were preserved in lung and sputum. These modules contained genes re-lated to mitochondrial function, metabolic alterations, regulation of T cell activation, endocytosis and non-cod-ing RNA metabolism. Some of these processes have been previously associated with COPD. For example, meta-bolic alterations are well documented in airway smooth muscle (ASM) cells [26], and CTS3 (a driver gene of the
brown module) was previously reported to be causally as-sociated with COPD [27]. Likewise, the loss of mitochon-drial biogenesis (production of new mitochondria) and mitochondrial DNA (mtDNA) appear associated with a significantly lower body mass index and muscle mass in COPD [28, 29]. Similarly, inherited mtDNA haplotypes may also pre-dispose or confer susceptibility to COPD [30]. Little is known about the effects of mitochondrial translation or mRNA splicing in COPD, [31] although the role of mitochondrial and iron abnormalities has been de-scribed in relationship to a COPD genome-wide associ-ation gene IREB2 [32]. We validated three of the key mitochondria-relevant genes encoded by the nuclear gen-ome by qPCR. TSFM regulates the translation of the
13-mtDNA encoded genes in the mitochondrial matrix, whereas NDUFA3 encodes an accessory subunit of the mitochondrial membrane respiratory chain NADH de-hydrogenase (Complex I). MPV17L2 is a mitochondrial inner membrane protein that regulates ribosomal assem-bly and protein synthesis in mitochondria [33].
Functionally, nearly every cell in the lung depends on mitochondrial metabolic activities, requiring a constant supply of energy from oxidative phosphorylation. Mito-chondria are at the hub of cellular metabolism, regulat-ing the continuous aerobic oxidation of fatty acids and consuming the end products of glucose, glutamine and amino acid degradation in order to aerobically produce ATP from oxygen and H2O [34]. An alteration in any of
the three genes identified in this study may alter bio-energetic processes, mitochondrial shape, movement and cellular interactions. From studies of families with mutations in mitochondrial genes, it is known that im-paired mitochondrial translation and imim-paired Complex I activity results in deficient ATP production and cellular
Table 3Driver genes in preserved modules associated with lung function meta-analysis modules in the 4 datasets
Yellow module Brown module Magenta module
ANAPC11 APEH ABCE1
ATP5G1 CDK5 ATL3
ATP5G2 CHCHD10 CYCS
MRPL23 CST3 GGCT
MRPS12 DCAF7 MKI67IP
NDUFA13 GPI MRPL32
NDUFS3 PLD3 NUP35
ROMO1 PSMB2 RIOK1
SF3B5 TMEM147 TIMM17A
TMEM147 TSPO WDR43
energy deficit [35]. Accordingly, in COPD mitochondrial abnormalities have been associated with excessive pro-duction of mitochondrial Reactive Oxygen Species (mROS) and abnormalities in ATP production that in turn lead to enhanced inflammation and cell hyperproli-feration [36]. Further studies are required to know if the abnormal mROS observed are related to defects in translation or whether these defects are consequences of the continuous exposure to noxious gases and particles, such as tobacco smoke, in the lung.
Finally, we identified only one module in the meta-analysis which was preserved and associated with FEV1% predicted in the two lung tissue datasets
(light--yellow), but not in any other compartment. This module
contained B-cell related genes that have been previously associated with the presence of emphysema and/or the severity of airflow limitation [3, 16, 37]. Therefore, our findings here suggest that the B-cell component of COPD cannot be readily identified in sputum or blood.
Strengths and limitations
The fact that the two lung studies were performed in different countries using different array platforms but still showed good preservation of co-expression and as-sociation with airflow limitation is a strength of our study. This reflects both the reproducibility of the tran-scriptomic changes associated with COPD once the po-tential confounding effect of active smoking is removed
and that network-based transcriptomic meta-analysis is a suitable tool to cope with methodological differences [14, 38]. Among the limitations of our study, we ac-knowledge that only blood and sputum, but not lung tis-sue, data were obtained simultaneously from the same patients. This is the reason why in the current analysis we used WGCNA, as previous works have described the ability of the method to assess module preservation across different tissues and even across different species, over-coming the limitation of using different subjects [15, 39]. The fact that we do not observe preservation of mod-ules across sputum and blood that are from the same individuals also supports the conclusion that there are co-expressed genes associated with the severity of air-flow limitation only in lung and sputum.Because our study was observational, functional evidence based on animal models or longitudinal human studies are required to validate the clinical relevance of our observations. We acknowledge that it would have been desirable to analyse the mitochondrial gene expression in relation to diverse COPD clinical parameters (i.e. exacerbations, treatment, prognosis or blood exam measures) but this data was not available for the current study and should be addressed in future investigations.
Finally, in this study it is unclear how much of the dif-ference in gene expression between samples was due to differences in cellular composition vs. differences in ex-pression across cell types.
Conclusions
Using gene expression correlation-based network ana-lysis, we identified modules of co-expressed genes that were preserved and associated with the severity of air-flow limitation in lung tissue and sputum, but not in blood samples, suggesting that the systemic component in COPD is independently regulated. The fact that one of the preserved modules associated with FEV1 was enriched in mitochondria-related genes supports a role for mitochondrial dysfunction in the pathobiology of COPD.
Additional files
Additional file 1:On-line supplement methods. (DOCX 37 kb)
Additional file 2:Figure S1.Association between blood gene modules and lung function. The module definition was performed based on the blood dataset. (DOCX 41 kb)
Additional file 3:Table S1.Genes in Brown, Yellow, Magenta and LightCyan modules. (PDF 51 kb)
Additional file 4:Table S2.Gene Ontology enrichment in Yellow, Brown, and Magenta modules. (PDF 52 kb)
Additional file 5:Table S3.KEGG pathway enrichment in Yellow, Brown, and Magenta modules. (PDF 36 kb)
Additional file 6:Figure S2.Dendrogram of consensus co-expression network including Lung Tissue-1, Lung Tissue-2 and Sputum datasets. (DOCX 48 kb)
Additional file 7:Figure S3.Association between consensus gene modules and lung function in each cohort. (DOCX 96 kb)
Additional file 8:Table S4.Core 60 genes in common between the yellow meta-analysis module and brown consensus module with the p-value <0.1 for association with FEV1 % predicted. (PDF 38 kb) Additional file 9:Table S5.Gene Ontology enrichment for the core 60 genes. (PDF 33 kb)
Additional file 10:Figure S4.Correlation of the gene expression of MPV17L2, NDUFA3 and TSFM with FEV1 % predicted in L1 (A) and L2 (B). (DOCX 98 kb)
Abbreviations
B:Blood dataset; BMI: Body mass index; COPD: Chronic obstructive pulmonary disease; ECLIPSE: Evaluation of copd longitudinally to identify predictive surrogate end-points; L: Lung tissue dataset; S: Induced sputum dataset; WGCNA: Weighted gene co-expression network analysis
Acknowledgements
Authors thank all participants for their willingness to contribute to advance medical science in the field of COPD, and all the principal investigators and centres participating in ECLIPSE.
Authors’s contributions
Study conception and design: (RF, CH, JM, EKS), data acquisition: (RF, JM, TC, SC, ALG, RTS, BM), data analysis: (RF, JM, GN, SC), manuscript preparation: (RF, CH, AA), manuscript revision: All. All authors read and approved the final manuscript.
Funding
This work was supported by unrestricted grants from GlaxoSmithKline, Instituto de Salud Carlos III (PI15/00799) and M-BAE 2015/00049 and U.S. National Institutes of Health grants P01 HL105339, R01 HL125583, R01 HL130512 and K99HL125899 (to S.M. Cloonan). Rosa Faner is recipient of a Miguel Servet Research Program Con-tract (FEDER, CP16/00039) and ERS International Short-Term Research Fellowship STRTF201710–00210. Funding bodies had no role in the design of the study and collection, analysis, and interpretation of data and in writing the manuscript.
Availability of data and materials
The material is available at GEO# GSE69818, GSE76705, GSE22148 and GSE76925.
Ethics approval and consent to participate
The Ethic Committees of the participating institutions approved each of these three studies, and all participants signed their informed consent. ECLIPSE (NCT00292552, SC0104960). This study was approved by the IRB of the Hospital Clinic de Barcelona, IRB#HCB/2014/1127.
Consent for publication
Not applicable.
Competing interests
BEM is an employee and shareholder of GlaxoSmithKline, the sponsor of ECLIPSE. RT-S is an employee and shareholder of GlaxoSmithKline, the sponsor of ECLIPSE.
Publisher’s Note
Springer Nature remains neutral with regard to jurisdictional claims in published maps and institutional affiliations.
Author details
Barcelona, Spain.5Respiratory Therapy Area Unit GSK R and D, Collegeville, PA, USA.
Received: 5 July 2018 Accepted: 16 December 2018
References
1. Vogelmeier CF, Criner GJ, Martinez FJ, Anzueto A, Barnes PJ, Bourbeau J, Celli BR, Chen R, Decramer M, Fabbri LM, et al. Global strategy for the diagnosis, management, and prevention of chronic obstructive lung disease 2017 report.GOLD Executive Summary. Am J Respir Crit Care Med. 2017; 195:557–82.
2. Lange P, Celli B, Agusti A. Lung-function trajectories and chronic obstructive pulmonary disease. N Engl J Med. 2015;373:1575.
3. Faner R, Cruz T, Casserras T, Lopez-Giraldo A, Noell G, Coca I, Tal-Singer R, Miller B, Rodriguez-Roisin R, Spira A, et al. Network analysis of lung transcriptomics reveals a distinct B cell signature in emphysema. Am J Respir Crit Care Med. 2016.
4. Morrow JD, Qiu W, Chhabra D, Rennard SI, Belloni P, Belousov A, Pillai SG, Hersh CP. Identifying a gene expression signature of frequent COPD exacerbations in peripheral blood using network methods. BMC Med Genet. 2015;8:1. 5. Agusti A, Faner R. Systemic inflammation and comorbidities in chronic
obstructive pulmonary disease. Proc Am Thorac Soc. 2012;9:43–6. 6. Faner R, Tal-Singer R, Riley JH, Celli B, Vestbo J, MacNee W, Bakke P,
Calverley PM, Coxson H, Crim C, et al. Lessons from ECLIPSE: a review of COPD biomarkers. Thorax. 2014;69:666–72.
7. Yoo S, Takikawa S, Geraghty P, Argmann C, Campbell J, Lin L, Huang T, Tu Z, Foronjy RF, Spira A, et al. Integrative analysis of DNA methylation and gene expression data identifies EPAS1 as a key regulator of COPD. PLoS Genet. 2015;11:e1004898.
8. Agusti A, Sin DD. Biomarkers in COPD. Clin Chest Med. 2014;35:131–41. 9. Ambade VN, Sontakke AN, Barthwal MS, Tyagi R, Basannar DR. Diagnostic
utility of biomarkers in COPD. Respir Care. 2015;60:1729–42.
10. Mannino DM. Biomarkers in COPD: the search continues. Eur Respir J. 2015; 45:872–4.
11. Truedsson M, Malm J, Barbara Sahlin K, Bugge M, Wieslander E, Dahlback M, Appelqvist R, Fehniger TE, Marko-Varga G. Biomarkers of early chronic obstructive pulmonary disease (COPD) in smokers and former smokers. Protocol of a longitudinal study. Clin Transl Med. 2016;5:9.
12. Barabasi AL, Gulbahce N, Loscalzo J. Network medicine: a network-based approach to human disease. Nat Rev Genet. 2011;12:56–68.
13. Langfelder P, Horvath S. WGCNA: an R package for weighted correlation network analysis. BMC bioinformatics. 2008;9:559.
14. Malki K, Tosto MG, Jumabhoy I, Lourdusamy A, Sluyter F, Craig I, Uher R, McGuffin P, Schalkwyk LC. Integrative mouse and human mRNA studies using WGCNA nominates novel candidate genes involved in the pathogenesis of major depressive disorder. Pharmacogenomics. 2013;14: 1979–90.
15. Miller JA, Horvath S, Geschwind DH. Divergence of human and mouse brain transcriptome highlights Alzheimer disease pathways. Proc Natl Acad Sci U S A. 2010;107:12698–703.
16. Morrow JD, Zhou X, Lao T, Jiang Z, DeMeo DL, Cho MH, Qiu W, Cloonan S, Pinto-Plata V, Celli B, et al. Functional interactors of three genome-wide association study genes are differentially expressed in severe chronic obstructive pulmonary disease lung tissue. Sci Rep. 2017;7:44232. 17. Singh D, Fox SM, Tal-Singer R, Plumb J, Bates S, Broad P, Riley JH, Celli B.
Induced sputum genes associated with spirometric and radiological disease severity in COPD ex-smokers. Thorax. 2011;66:489–95.
18. Singh D, Fox SM, Tal-Singer R, Bates S, Riley JH, Celli B. Altered gene expression in blood and sputum in COPD frequent exacerbators in the ECLIPSE cohort. PLoS One. 2014;9:e107381.
19. Langfelder P, Luo R, Oldham MC, Horvath S. Is my network module preserved and reproducible? PLoS Comput Biol. 2011;7:e1001057. 20. Ritchie ME, Phipson B, Wu D, Hu Y, Law CW, Shi W, Smyth GK. Limma
powers differential expression analyses for RNA-sequencing and microarray studies. Nucleic Acids Res. 2015;43:e47.
21. Feng G, Du P, Krett NL, Tessel M, Rosen S, Kibbe WA, Lin SM. A collection of bioconductor methods to visualize gene-list annotations. BMC Res Notes. 2010;3:10.
22. Supek F, Bosnjak M, Skunca N, Smuc T. REVIGO summarizes and visualizes long lists of gene ontology terms. PLoS One. 2011;6:e21800.
23. Obeidat M, Nie Y, Chen V, Shannon CP, Andiappan AK, Lee B, Rotzschke O, Castaldi PJ, Hersh CP, Fishbane N, et al. Network-based analysis reveals novel gene signatures in peripheral blood of patients with chronic obstructive pulmonary disease. Respir Res. 2017;18:72.
24. Nunez B, Sauleda J, Garcia-Aymerich J, Noguera A, Monso E, Gomez F, Barreiro E, Marin A, Anto JM, Agusti A. Miembros del Grupo de Trabajo sobre la Caracterizacion Fenotipica y Evolucion de la E: lack of correlation between pulmonary and systemic inflammation markers in patients with chronic obstructive pulmonary disease: a simultaneous, two-compartmental analysis. Arch Bronconeumol. 2016;52:361–7.
25. Barnes PJ, Celli BR. Systemic manifestations and comorbidities of COPD. Eur Respir J. 2009;33:1165–85.
26. Rabinovich RA, Bastos R, Ardite E, Llinas L, Orozco-Levi M, Gea J, Vilaro J, Barbera JA, Rodriguez-Roisin R, Fernandez-Checa JC, Roca J. Mitochondrial dysfunction in COPD patients with low body mass index. Eur Respir J. 2007; 29:643–50.
27. Lamontagne M, Timens W, Hao K, Bosse Y, Laviolette M, Steiling K, Campbell JD, Couture C, Conti M, Sherwood K, et al. Genetic regulation of gene expression in the lung identifies CST3 and CD22 as potential causal genes for airflow obstruction. Thorax. 2014;69:997–1004.
28. Remels AH, Schrauwen P, Broekhuizen R, Willems J, Kersten S, Gosker HR, Schols AM. Peroxisome proliferator-activated receptor expression is reduced in skeletal muscle in COPD. Eur Respir J. 2007;30:245–52.
29. Ning W, Lee J, Kaminski N, Feghali-Bostwick CA, Watkins SC, Pilewski JM, Peters DG, Hogg JC, Choi AM. Comprehensive analysis of gene expression on GOLD-2 versus GOLD-0 smokers reveals novel genes important in the pathogenesis of COPD. Proc Am Thorac Soc. 2006;3:466.
30. Zheng S, Wang C, Qian G, Wu G, Guo R, Li Q, Chen Y, Li J, Li H, He B, et al. Role of mtDNA haplogroups in COPD susceptibility in a southwestern Han Chinese population. Free Radic Biol Med. 2012;53:473–81.
31. Lackey L, McArthur E, Laederach A. Increased transcript complexity in genes associated with chronic obstructive pulmonary disease. PLoS One. 2015;10: e0140885.
32. Cloonan SM, Glass K, Laucho-Contreras ME, Bhashyam AR, Cervo M, Pabon MA, Konrad C, Polverino F, Siempos II, Perez E, et al. Mitochondrial iron chelation ameliorates cigarette smoke-induced bronchitis and emphysema in mice. Nat Med. 2016;22:163–74.
33. Dalla Rosa I, Durigon R, Pearce SF, Rorbach J, Hirst EM, Vidoni S, Reyes A, Brea-Calvo G, Minczuk M, Woellhaf MW, et al. MPV17L2 is required for ribosome assembly in mitochondria. Nucleic Acids Res. 2014;42:8500–15. 34. Cloonan SM, Choi AM. Mitochondria in lung disease. J Clin Invest. 2016;126:
809–20.
35. Boczonadi V, Horvath R. Mitochondria: impaired mitochondrial translation in human disease. Int J Biochem Cell Biol. 2014;48:77–84.
36. Wiegman CH, Michaeloudes C, Haji G, Narang P, Clarke CJ, Russell KE, Bao W, Pavlidis S, Barnes PJ, Kanerva J, et al. Oxidative stress-induced mitochondrial dysfunction drives inflammation and airway smooth muscle remodeling in patients with chronic obstructive pulmonary disease. J Allergy Clin Immunol. 2015;136:769–80.
37. Obeidat M, Nie Y, Fishbane N, Li X, Bosse Y, Joubert P, Nickle DC, Hao K, Postma DS, Timens W, et al. Integrative genomics of emphysema associated genes reveals potential disease biomarkers. Am J Respir Cell Mol Biol. 2017. 38. Langfelder P, Mischel PS, Horvath S. When is hub gene selection better than
standard meta-analysis? PLoS One. 2013;8:e61505.

![Fig. 3 Visual summary of the ontologies in each of the three interesting modules (Treemap in REVIGO (http://revigo.irb.hr/) [22]): (a) Yellow, (b) Brown, (c) Magenta](https://thumb-us.123doks.com/thumbv2/123dok_us/8146389.2160508/7.892.89.809.129.975/summary-ontologies-interesting-modules-treemap-revigo-yellow-magenta.webp)