SHAREDGENETIC ARCHITECTURE OF RED BLOOD CELL TRAITS IN U.S. POPULATIONS
Chani Jo Hodonsky
A dissertation submitted to the faculty at the University of North Carolina at Chapel Hill in partial fulfillment of the requirements for the degree of Doctor of Philosophy in the Department
of Epidemiology in the Gillings School of Global Public Health.
Chapel Hill 2019
Approved by:
Christy Avery
Mariaelisa Graff
Kari North
Alex Reiner
ABSTRACT
Chani Jo Hodonsky: Shared Genetic Architecture of Red Blood Cell Traits in U.S. Populations (Under the direction of Christy L. Avery)
Red blood cells are the most numerous cell in the body, and clinical measures used to
describe them (RBC traits) are highly polygenic. Hundreds of loci have been identified using
traditional genome-wide association study methods. However, the majority of association studies
have been performed in European- or East Asian-ancestry populations, and heritability estimates
suggest that additional associations remain to be identified. Rare variants, which GWAS are
typically underpowered to detect, have been considered as potential contributors to this missing
heritability. Of note, European-ancestry populations have both the lowest genetic diversity and
the fewest rare variants compared to other ancestry groups.
Both the identification of previously unreported loci and the characterization of known
loci for complex quantitative traits benefit from inclusive study populations and recently
developed association study methods. The objective of this study was to evaluate genetic
associations with seven RBC traits in an ancestrally diverse study population by applying two
different methods—a combined-phenotype approach to evaluating common variants that may
affect multiple RBC traits, and a gene-based approach that improves power to detect groups of
rare variants acting on a single genetic transcript. We utilized data from a large, multi-ethnic
study population from across the United States, including genotypes and data from seven RBC
hemoglobin concentration, mean corpuscular volume, red blood cell count, and red cell
distribution width.
Our findings confirm the high polygenicity of RBC traits and the applicability of
previously reported RBC trait loci to populations of all ancestries. We identified four previously
unreported genes associated with one or more RBC traits. Additionally, using a
combined-phenotype method we identified twenty independent association signals within seven loci,
several of which had lead variants only present in African- or American-ancestry populations.
Our work shows the importance of performing association studies in populations of all
ancestries, while also calling for increased representation of genetic variation from diverse
populations in publicly available resources such as eQTL databases. Continued efforts into the
bioinformatic characterization of RBC trait loci will pave the way for molecular work that
improves our understanding of RBC physiology and may lead to pharmaceutical innovations for
genetically or environmentally induced RBC disorders.
I dedicate this work to my parents, Pamela and Joseph Hodonsky; my brother, Eric Hodonsky; and Dr. Paul and Phyllis Schroeder.
ACKNOWLEDGMENTS
I would like to thank my dissertation committee (Marielisa Graff, Kari North, Alex
Reiner, and Ran Tao) and chair (Christy Avery) for making this work possible. Each member of
my committee offered a breadth and depth of knowledge that inspire me to continue improving
every day as I strike out on my own research path.
The work represented by this document may have been performed by me, but would
never have been possible without the guidance and encouragement of my family and friends. I
begin by thanking my parents, Pam and Joe Hodonsky, who supported me on the winding road
of self discovery that ultimately led to the UNC epidemiology program. They were there every
step of the way, and that unconditional love sustained me. My brother, Eric Hodonsky, provided
a consistent source of love and positive words, checking in from the west coast to make sure I
was surviving the travails of coursework and research. I also thank and honor Dr. Paul and
Phyllis Schroeder, without whom I could never have become the person I am today. I can only
hope to aspire to their boundless love and generosity.
The life of a PhD student can be a rollercoaster, and over the last five years a large
number of people have ridden that rollercoaster with me. I would like to thank my friends and
colleagues in the Gillings School of Public Health, who were there to help me grow as a student
and researcher: Breakfast Club (Antoine Baldassari, Joseph Engeda, and Rahul Gondalia),
Elizabeth Kamai, Paula Strassle, Nikki Niehoff, Kristin Voltzke Moore, Rebecca Stebbins,
Assimon, Anne Justice, Kris Young, Laura Raffield, and Heather Highland. I would also like to thank my “non-epi” friends who loved me (and occasionally fed me) despite the demands of
graduate school: Suzanne and Angela Derby-Wright, Hope Tyson, Zinaida Mahmutefendic and
Andrew Hunt, Dylan Williams, Amber Sniff and Jim Heffernan, Dan Mott and Jennifer
Robinson, Lily and Michael Whitton, Kim and Lars Soltmann, Sam Boyarsky, Rim Vilgalys,
Boris Kurktchiev and Kelli Avalos, Will Roper and Sam Ross, Brent Eason, and Cheralyn
Schmidt. I have also had friends from all parts of my life supporting me from afar throughout
this process, whom I love and am so glad to have in my life. A special thank you to Eric Witham,
Eric Dennis, Johanna and Wes Craig, Gabrielle and Clare Singleton, Andrew Inman, Michael
Garrison, and Ravin Pan for watching me grow up and loving me anyway. Finally, I have been
extremely fortunate to learn from mentors across every aspect of my life. I would specifically
like to thank Janet Hegman Shier, John Rubadeau, Tony Antonellis, Ming-Sing Si, Steve
Leibovic, and Arash Babaoff for showing me the best of humanity.
I am honored to have been a member of the PAGE study for the entirety of my graduate
work, and I look forward to continuing this collaboration. PAGE has provided an environment of
support, generous authorship opportunities, and a shining example of what collaboration in
academic science should be. While all of my PAGE collaborators made me feel welcome over
the past five years, I would specifically like to thank Drs. Stephanie Bien, Genevieve Wojcik,
Christopher Gignoux, Eimear Kenny, Lucia Hindorff, and Charles Kooperberg. I would also like
to acknowledge the contributions of the nearly 100,000 study participants who selflessly gave
their time and resources to move forward the fields of cardiovascular and genetic epidemiology.
Lastly, I am grateful for the opportunity to focus on my work as a trainee of the NIH/NHLBI
TABLE OF CONTENTS
LIST OF TABLES ... xiii
LIST OF FIGURES ... xvii
LIST OF ABBREVIATIONS ... xviii
LIST OF GENE NAMES ... xxii
OVERVIEW AND RATIONALE ... 1
SPECIFIC AIMS ... 4
2.1. Aim 1: Leverage evidence of pleiotropy to identify and characterize RBC trait loci. 4 2.2. Aim 2: Identify rare variants associated with RBC traits via gene-based analysis. ... 4
BACKGROUND AND SIGNIFICANCE... 6
3.1. Historical background ... 6
3.2. Red blood cell biology ... 7
3.2.1. Three waves of hematopoiesis ... 8
3.2.2. Hemoglobin: the primary actor in RBC oxygen transportation and delivery ... 9
3.2.3. Stages of Erythropoiesis and RBC Degradation ... 10
3.2.4. Iron homeostasis in erythropoiesis... 12
3.3. Red blood cell trait definitions and measurement... 13
3.3.1. HCT... 14
3.3.2. HGB ... 15
3.3.3. RBCC ... 15
3.3.6. MCV ... 16
3.3.7. RDW ... 16
3.4. Anemia definition and prevalence ... 17
3.4.1. Monogenic RBC anemias and related disorders ... 18
3.4.2. Summary ... 22
3.5. Red blood cell epidemiology ... 22
3.5.1. Traditional risk factors ... 23
3.5.2. RBC trait measurement and error ... 30
3.5.3. Summary ... 31
3.6. Clinical and public health significance of RBC traits ... 32
3.6.1. RDW and ESRD ... 33
3.6.2. RDW in Heart Failure ... 34
3.6.3. RDW and ischemic stroke ... 34
3.7. State of the literature: RBC trait genetics ... 36
3.7.1. Linkage analysis studies ... 37
3.7.2. RBC trait candidate gene studies ... 39
3.7.3. RBC molecular genetics ... 41
3.7.4. Genome-wide association studies ... 43
3.7.5. RBC trait genetic association studies ... 45
3.8. State of the literature: quantitative trait analysis... 51
3.8.1. Pleiotropy ... 51
3.8.2. Fine-mapping association signals identified in combined-phenotype GWAS ... 59
3.8.3. Association studies of rare variants ... 64
3.9. Public Health Significance ... 72
RESEARCH PLAN ... 86
4.1. Overview ... 86
4.2. Study populations... 86
4.2.1. Population Architecture using Genomics and Epidemiology: The PAGE study . 86 4.3. Phenotypes: outcome and covariate assessment ... 90
4.3.1. RBC trait descriptive statistics and transformation ... 90
4.3.2. Exclusion Criteria ... 90
4.3.3. Adjustment covariates ... 91
4.4. Specific Aim 1: Combined-phenotype GWAS of red blood cell traits ... 94
4.4.1. Quality control for genotypes and imputed data and statistical threshold ... 94
4.4.2. Univariate analyses ... 95
4.4.3. Comparison of available combined-phenotype methods ... 97
4.4.4. Combined-phenotype analysis using aSPU ... 98
4.5. Specific Aim 2: Gene-based rare variant analysis of red blood cell traits ... 101
4.5.1. Gene-based testing: combined VC and burden test implemented in MASS ... 102
4.5.2. Interpretation of results ... 105
4.6. Supporting Tables & Figures ... 107
MANUSCRIPT A: ANCESTRY-SPECIFIC ASSOCIATIONS IDENTIFIED IN GENOME-WIDE COMBINED-PHENOTYPE STUDY OF RED BLOOD CELL TRAITS EMPHASIZE BENEFITS OF DIVERSITY IN GENOMICS ... 114
5.1. Overview ... 114
5.2. Introduction ... 115
5.3. Methods... 117
5.3.1. Study population ... 117
5.3.2. RBC Trait Measurement ... 117
5.3.4. Statistical Methods ... 118
5.3.5. Publicly available expression quantitative trait locus (eQTL) analysis ... 122
5.4. Results ... 122
5.4.1. Combined-phenotype analyses ... 122
5.4.2. eQTL function of index SNPs... 125
5.5. Discussion ... 125
5.6. Conclusion ... 129
5.7. Main Figures & Tables ... 130
MANUSCRIPT B. GENE-BASED TESTING IN AN ANCESTRALLY DIVERSE STUDY POPULATION SUGGESTS COMPLICATED REGULATORY MECHANISMS FOR RED BLOOD CELL TRAITS: THE PAGE STUDY ... 202
6.1. Overview ... 202
6.2. Introduction ... 203
6.3. Methods... 204
6.3.1. Study population ... 204
6.3.2. RBC trait measurement ... 204
6.3.3. Genotyping and Imputation ... 205
6.3.4. Statistical Methods ... 205
6.4. Results ... 208
6.4.1. Genes previously unreported in RBC trait association studies ... 209
6.4.2. Clustering of significant genes... 210
6.4.3. Overrepresentation of gene ontology or molecular pathways ... 211
6.5. Discussion ... 211
6.6. Conclusion ... 214
6.7. Main Figures and Tables ... 215
7.1. Recapitulations of Specific Aims... 234
7.2. Main Findings ... 235
7.3. Strengths ... 237
7.4. Limitations ... 237
7.5. Overall Conclusions ... 238
APPENDIX: AN INTRODUCTION TO BASIC GENETIC PROCESSES... 239
8.1. Transcription ... 240
8.2. Intronic/intergenic variation... 241
8.3. Epigenetic modification ... 242
8.3.1. DNA methylation ... 242
8.3.2. 3D chromatin structure ... 243
8.3.3. Histone modification ... 244
8.4. Other genetic processes... 245
8.4.1. MicroRNA ... 245
8.4.2. Post-translational modification ... 246
8.5. Supporting Figure ... 248
LIST OF TABLES
Table 1. Discovery and genetic mapping of hereditary anemias ... 76
Table 2. Description of proteins involved in iron homeostasis and erythropoiesis. ... 78
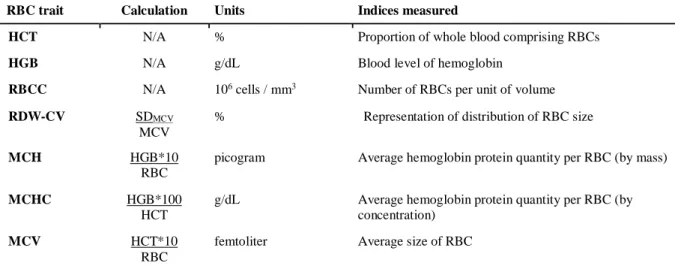
Table 3. Descriptions of red blood cell primary traits and derived indices. ... 79
Table 4. Brief overview of genetic and epigenetic processes and effects of variation. ... 80
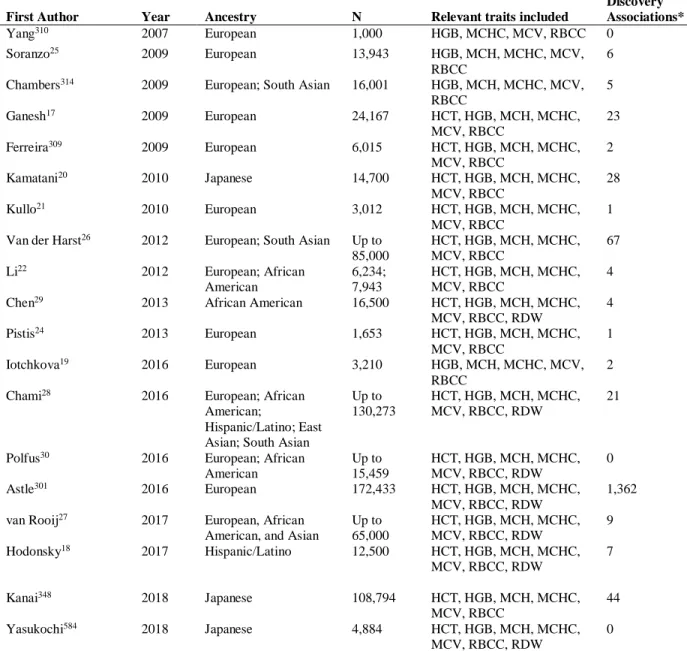
Table 5. Published English-Language GWAS and Exome Association Studies of RBC Traits ... 81
Table 6. Evidence of genetic associations shared across RBC traits. ... 82
Table 7. Examples of genome-wide significant RBC trait associations with cis-eQTL evidence and a plausible biological mechanism for a proximal gene. ... 83
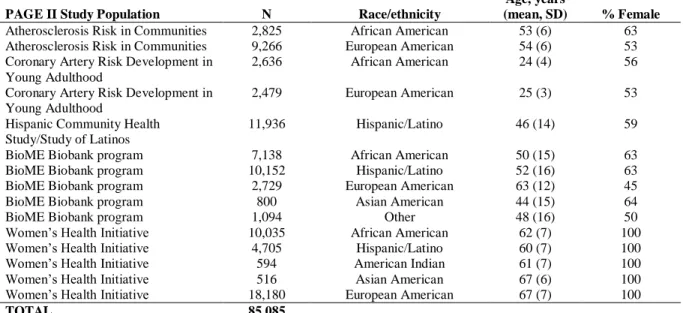
Table 8. The PAGE Study: descriptive statistics for PAGE participants and collaborators by study and self-reported race/ethnicity. ... 107
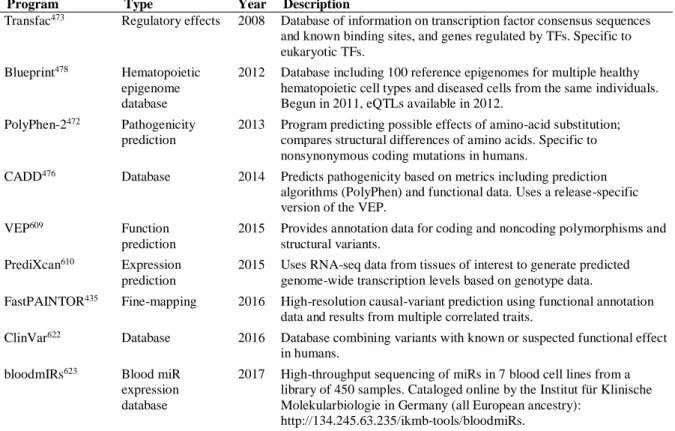
Table 9. Representative sample of bioinformatics analyses for identifying candidate functional variants. ... 108
Table 10. RBC trait loci with evidence of multiple independent signals among PAGE study participants. ... 135
Table 11. Genotyping platforms and QC measures used by participating study populations. ... 137
Table 12. Ancestry representation by self-reported race/ethnicity by RBC trait. ... 138
Table 13. Descriptive statistics for PAGE participants by study and race/ethnicity for ARIC, BioME, and CARDIA participants. ... 139
Table 14. Descriptive statistics for PAGE participants by study and race/ethnicity for WHI and HCHS/SOL participants. ... 140
Table 15. Univariate allele information and frequencies for combined-phenotype lead SNPs in combined multi-ethnic study population. ... 141
Table 16. HCT univariate results for combined-phenotype lead SNPs in combined multi-ethnic study population. ... 143
Table 18. MCH univariate results for combined-phenotype lead SNPs
in combined multi-ethnic study population. ... 147
Table 19. MCHC univariate results for combined-phenotype lead SNPs
in combined multi-ethnic study population. ... 149
Table 20. MCV univariate results for combined-phenotype lead SNPs
in combined multi-ethnic study population. ... 151
Table 21. RBCC univariate results for combined-phenotype lead SNPs
in combined multi-ethnic study population. ... 153
Table 22. RDW univariate results for combined-phenotype lead SNPs
in combined multi-ethnic study population. ... 155
Table 23. HCT univariate results for combined-phenotype lead SNPs
in African Americans. ... 157
Table 24. HGB univariate results for combined-phenotype lead SNPs
in African Americans. ... 159
Table 25. MCH univariate results for combined-phenotype lead SNPs
in African Americans. ... 161
Table 26. MCHC univariate results for combined-phenotype lead SNPs
in African Americans. ... 163
Table 27. MCV univariate results for combined-phenotype lead SNPs
in African Americans. ... 165
Table 28. RBCC univariate results for combined-phenotype lead SNPs
in African Americans. ... 167
Table 29. RDW univariate results for combined-phenotype lead SNPs
in African Americans. ... 169
Table 30. HCT univariate results for combined-phenotype lead SNPs
in Hispanics/Latinos... 171
Table 31. HGB univariate results for combined-phenotype lead SNPs
in Hispanics/Latinos... 173
Table 32. MCH univariate results for combined-phenotype lead SNPs
Table 33. MCHC univariate results for combined-phenotype lead SNPs
in Hispanics/ Latinos... 177
Table 34. MCV univariate results for combined-phenotype lead SNPs
in Hispanics/ Latinos... 179
Table 35. RBCC univariate results for combined-phenotype lead SNPs
in Hispanics/ Latinos... 181
Table 36. RDW univariate results for combined-phenotype lead SNPs
in Hispanics/Latinos... 183
Table 37. HCT univariate results for combined-phenotype lead SNPs
in European Americans. ... 185
Table 38. HGB univariate results for combined-phenotype lead SNPs
in European Americans. ... 186
Table 39. MCH univariate results for combined-phenotype lead SNPs
in European Americans. ... 187
Table 40. MCHC univariate results for combined-phenotype lead SNPs
in European Americans. ... 188
Table 41. MCV univariate results for combined-phenotype lead SNPs
in European Americans. ... 189
Table 42. RBCC univariate results for combined-phenotype lead SNPs
in European Americans. ... 190
Table 43. RDW univariate results for combined-phenotype lead SNPs
in European Americans. ... 191
Table 44. LD proxies by ancestry for rs6573766, associated with RBCC in
univariate sensitivity analysis. ... 192
Table 45. LD proxies by ancestry for rs145548796*, associated with MCV
in univariate sensitivity analysis. ... 193
Table 46. Comparison of unadjusted and esv3637548-adjusted trait-specific
p-values at HBA1/2 locus on chromosome 16 in MEGA-genotyped individuals. ... 194
Table 47. Shared generalization at previously published index SNPs across
Table 48. Generalization of previously reported association signals and
index SNPs to the PAGE trans-ethnic study population. ... 196
Table 49. Generalization of previously reported association signals and
index SNPs to the PAGE African American population. ... 197
Table 50. Generalization of previously reported association signals and
index SNPs to the PAGE Hispanic/Latino population. ... 198
Table 51. Generalization of previously reported association signals and
index SNPs to the PAGE European-ancestry population. ... 199
Table 52. Lead SNPs that are significant eQTLs for genes within 500kb
for RBC-relevant tissues in GTEx. ... 200
Table 53. Descriptive information for 29,070 MEGA-genotyped study participants. ... 218
Table 54. CADD annotation set transcripts significant in one or more
RBC traits in 29,070 PAGE participants. ... 219
Table 55. Deleterious annotation set transcripts significant in one or more
RBC traits in 29,070 PAGE participants. ... 221
Table 56. Top variants and p-values by trait and transcript for CADD
variant annotation set significant transcripts... 222
Table 57. Top variants and p-values by trait and transcript for deleterious
variant annotation set significant transcripts... 224
Table 58. Allele frequencies for top variants within CADD annotation
set significant transcripts... 226
Table 59. Allele frequencies for top variants within deleterious annotation
set significant transcripts... 229
Table 60. Association network of all genes significant for CADD or
deleterious annotation sets. ... 230
Table 61. Gene ontology enrichment for genes significantly associated
with one or more RBC traits. ... 231
Table 62. P-values that increased after conditioning on a single variant for transcripts significantly associated with one or more RBC traits in the
LIST OF FIGURES
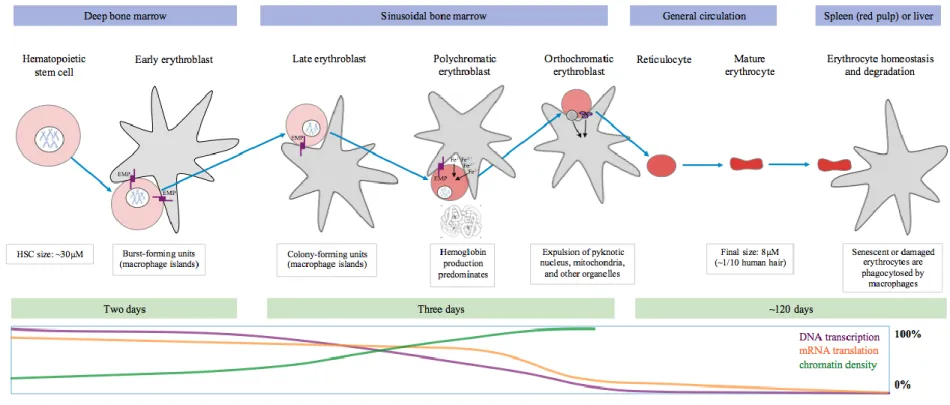
Figure 1. A basic overview of RBC development stages and accompanying
molecular processes (prepared by Hodonsky, 2018) ... 84
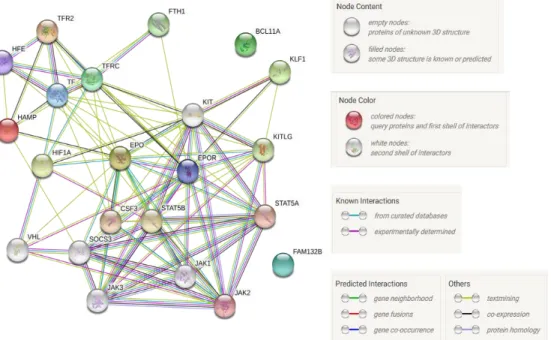
Figure 2. Example network of key protein-protein interactions involving
molecules with established roles in RBC biology. ... 85
Figure 3. PAGE II participants self-identifying as Hispanic/Latino stratified by ethnicity ... 109
Figure 4. Ancestral principal components demonstrate the continental-ancestry
continuum among participants of the PAGE study... 110
Figure 5. Comparison of multi-phenotype methods under the assumption of
no genetic effect to examine systematic evidence of type I error inflation. ... 111
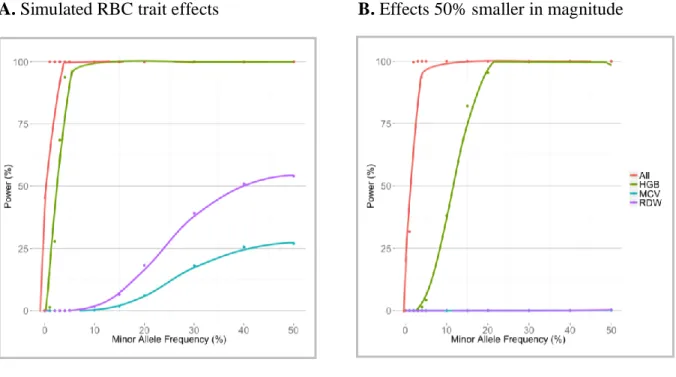
Figure 6. Statistical power for univariate and multi-phenotype associations by effect size. ... 112
Figure 7. Selected approximate power curves for 20,000 genes by number of
variants per region... 113
Figure 8. Identification and characterization of 39 loci in a multi-ethnic study population. ... 130
Figure 9. Multiple independent associations with MCH demonstrate complex
genetic architecture at HBA1/HBA2 locus. ... 131
Figure 10. Evidence of genetic associations shared across correlated RBC traits... 132
Figure 11. Locus-Zoom plots of the association between rs6573766 and RBCC
in PAGE African Americans (A), Hispanics/Latinos (B), and European Americans (C) ... 133
Figure 12. Locus-Zoom plot of the association between MCH (A) and MCV (B)
and rs145548796 in the total MEGA study population ... 134
Figure 13. Number of variants per transcript in deleterious and CADD annotations... 215
Figure 14. Genome-wide gene-based results using deleterious (top) and CADD
(bottom) masks identifies multiple significant transcripts across seven RBC traits. ... 216
Figure 15. Evidence of shared pathways in a cluster of CADD-significant genes. ... 217
Figure 16. Molecular processes involved in gene transcription, mRNA translation,
LIST OF ABBREVIATIONS
1000G 1000 Genomes project (referred to by phase when relevant)
3' and 5' Downstream and upstream, respectively, in the direction of transcription
AD Autosomal dominant-inherited trait
AFR 1000 Genomes African continental ancestry super population
AMR 1000 Genomes American continental ancestry super population
AR Autosomal recessive-inherited trait
ARIC Atherosclerosis Risk in Communities cohort study
ASW African Americans in the Southwest United States (1000G population)
BCX Blood cell consortium
BFU-E Burst-forming unit erythroid cells
BioME Mt. Sinai BioME biobank
BM Bone marrow
BMI Body mass index
CAF Coded allele frequency (defined as the frequency of the allele listed as the primary allele in PAGE)
CARDIA Coronary Artery Risk Development in Young Adults Study
CEU Northern Europeans from Utah (1000G population)
CFU-E Colony-forming unit erythroid cells
CHARGE Cohorts for Heart and Aging Research in Genetic Epidemiology
CHD Coronary heart disease
CHS Cardiovascular Health Study
CI Confidence interval
cM Centimorgan
CVD Cardiovascular disease
df Degrees of freedom
DNA Deoxyribonucleic acid
EAS 1000 Genomes East Asian ancestry super population
eMERGE Electronic Medical Records and Genomics
EMP Erythroblast-macrophage protein
ENCODE Encyclopedia or DNA Elements
eQTL Expression quantitative trait locus
ESRD End-stage renal disease
EUR 1000 Genomes European continental ancestry super population
FHS Framingham Heart Study
GEE Generalized estimating equation
GIANT Genetic Investigation of Anthropometric Traits consortium
GWAS Genome-wide association study
GxE Gene-by-environment interaction study
h2 Narrow-sense heritability due to additive genetic effects
HCHS/SOL Hispanic Community Health Study/Study of Latinos
HCT Hematocrit
HGB Hemoglobin level
HSC Hematopoietic stem cell
ICC Interclass correlation coefficient
Indel Insertion/deletion genetic variant
IRE Iron-responsive element
ISMMS Icahn School of Medicine at Mt. Sinai
JHS Jackson Heart Study
LD Linkage disequilibrium
LMM Linear mixed (effects) model
lncRNA Long non-coding RNA
LZ plot Locus-Zoom plot
MAF Minor allele frequency
MCH Mean corpuscular hemoglobin
MCHC Mean corpuscular hemoglobin concentration
MCV Mean corpuscular volume
MEP Megakaryocyte/erythrocyte precursor
MESA Multi-Ethnic Study of Atherosclerosis
miR Micro RNA
mRNA Messenger RNA
MS1 Manuscript 1 of dissertation project
MS2 Manuscript 2 of dissertation project
N Number of participants
NHANES National Health and Nutrition Examination Survey
NHLBI National Heart, Lung, and Blood Institute
NIH National Institutes of Health
OR Odds ratio
PAGE Population Architecture using Genomics and Epidemiology consortium
PTC Premature termination codon
RBCC Red blood cell count
RBP RNA binding protein
RDW Red cell distribution width
REGARDS REasons for Geographic and Racial Differences in Stroke study
RNA Ribonucleic acid
SAS 1000 Genomes South Asian ancestry super population
SD Standard deviation
SE Standard error
SHARe SNP Health Association Resource study
SHS Strong Heart Study
SNP Single nucleotide polymorphism
T2D Type 2 Diabetes Mellitus
tRNA transfer RNA
UTR Untranslated region (of mRNA)
WHI Women’s Health Initiative study
WHO World Health Organization
LIST OF GENE NAMES
ABCB11 ATP binding cassette B11
ADAMTS13 ADAM metallopeptidase with thrombospondin type 1 motif 13
ALAD Aminolevulinate dehydratase
ALAS2 Aminolevulinate delta synthase 2
AK1 Adenylate kinase 1
AMN Amnion-associated transmembrane protein
ANK1 Ankyrin 1
ATXN2 Ataxin 2 (adjacent to SH2B3)
BCL11A B-cell/CLL lymphoma 11A
BMP Bone morphogenetic protein family
BRCA2 Breast cancer 2
BRIP1 BRCA1-interacting protein C-terminal helicase 1
C4BPA Complement-component 4 binding protein alpha
CATSPERB Cation channel sperm-associated auxiliary subunit beta
CCND3 Cyclin D3
CD164 Cluster of differentiation 164 (codes for MUC24)
CDAN1 Codanin 1
CFH Complement factor H
CFHR1 CFH receptor 1 (family of genes, also include CHFR3)
CITED2 CBP/P300-interacting transactivator with glu/asp-rich carboxy terminal domain 2
CPOX Coproporphyrinogen oxidase
CYP1A2 Cytochrome P450 family 1, subfamily A, polypeptide 2
DARC Duffy blood group chemokine receptor
ERFE Erythroferrone precursor
EPAS1 Endothelial PAS Domain Protein 1
EPB42 Erythrocyte membrane protein band 4.2
EPB4IL2 Erythrocyte membrane protein band 4.1 Like 2
EPO Erythropoietin
FAM234A codes for ITFG3
FANCA Fanconi anemia complementation group A (family of relevant genes, also includes FANCB, FANCC, FANCD2, FANCE, FANCF, FANCG, FANCI, FANCL, and FANCM)
FBXO7 F-box protein 7
FECH Ferrochelatase
G6PD Glucose-6-phosphate dehydrogenase
GATA1 GATA-binding protein 1
HAMP Hepcidin
HBB Hemoglobin beta subunit (adult)
HBA1/2 Hemoglobin alpha subunits 1 and 2 (fetal and adult)
HBD Hemoglobin delta subunit (adult)
HBG1/2 Hemoglobin gamma subunits (fetal)
HBS1L HBS1-like (S. cerevisiae)
HFE Hemochromatosis gene
HK1 Hexokinase 1
HMOX2 Heme oxygenase (decycling) 2
IGHV1-3 Immunoglobulin heavy variable 1-3 (predicted RNA)
JAK2 Janus kinase 2
KCNN4 Potassium intermediate/small conductance calcium-activated channel, subfamily N, member 4
KIT KIT Proto-Oncogene Receptor Tyrosine Kinase
KLF1 Kruppel-like Factor 1
LPIN2 Lipin 2
MARCH8 Membrane Associated Ring-CH-Type Finger 8
MCP AKA CD46, complement regulatory protein (CD46)
MYB v-myb myeloblastosis viral oncogene homolog (avian)
PALB2 Partner and localizer of BRCA2
PGK1 Phosphoglycerate kinase 1
PHI codes for GPI
PKLR Pyruvate kinase, liver and RBC
PPHLN1 Periphilin 1
PRF1 Perforin 1 (pore-forming protein)
PRKCE Protein kinase C epsilon
PRKAG2 Protein Kinase AMP-Activated Non-Catalytic Subunit Gamma 2
PSMB8 Proteasome subunit, beta type, 8
RAD51C RAD51 homolog c (S. cerevisiae)
RCL1 RNA Terminal Phosphate Cyclase Like 1
RP11-687M24 Long non-coding RNA anti-sense to PKNOX2 (PBX/Knotted 1 homeobox 2)
RPS7 Ribosomal protein S7(family of relevant genes, also includes RPS10,
RPS17, RPS19, RPS24, and RPS26)
SEC23B SEC23 homolog B (S. cerevisiae)
SH2B3 SH2B adaptor protein 3
SLC11A2 Solute-carrier (family of genes also includes SLC12A2, SLC19A2, SLC25A38, SLC4A1, and SLC5A2)
SLX4 SLX4 structure-specific endonuclease subunit
SMAD Gene family of signal transducers and transcription modulators (similar to ‘Mad’ [Drosophila] and ‘Sma’ [C. elegans])
SPTA1 Spectrin, alpha, erythrocytic 1
SPTB Spectrin, beta, erythrocytic
STX11 Syntaxin 11
STXBP2 STX-binding protein 2
TF Transferrin
TFR2 Transferrin receptor 2
TRFC Transferrin receptor
THRB Thyroid hormone receptor beta
TMPRSS6 Transmembrane protease, serine 6
UNC13D UNC13 homolog D (C. elegans)
UROD Uroporphyrinogen decarboxylase
OVERVIEW AND RATIONALE
Red blood cell (RBC) traits capture the molecular properties of red blood cells, which are
required to transport oxygen to tissues throughout the body. RBC traits are complex, quantitative
measures obtained from a complete blood count (CBC), including three primary traits—
hematocrit (HCT), hemoglobin (HGB), and RBC count—and four derived indices—mean
corpuscular hemoglobin (MCH), MCH concentration (MCHC), mean corpuscular volume
(MCV), and RBC distribution width (RDW). In combination, these correlated traits are used to
describe RBC physiology and diagnose RBC disorders. Additionally, population-level variation
in these traits has been associated with a wide array of diseases, ranging from chronic kidney
disease to autoimmune disorders1-14.
RBC traits are quantitative and tightly regulated, suggesting that a high number of genes
contribute to each trait. A large body of literature has identified and characterized RBC
trait-associated genes over the past several decades, particularly in the genome-wide association
studies (GWAS) era. Several hundred loci have been identified through genetic-association
studies; however, effects from these loci explain only a small proportion of the broad-sense
variability expected to be attributed to genetics (referred to as "heritability" or h2)15-31.
Several factors contribute to the fact that genetic loci very likely remain to be discovered,
which will be examined in the proposed work. First, RBC trait GWAS have included primarily
European- and East Asian-ancestry populations, creating a biased view of human variation
are globally rare or population-specific; furthermore, inclusion of ancestrally diverse study
populations is necessary for equitable genomics research 32-40.
Second, previous RBC GWAS have examined RBC traits separately despite evidence of
shared molecular pathways, common genetic underpinnings, and statistical innovations enabling
examination of multiple traits in aggregate. For example, several loci have been consistently
associated with multiple RBC traits in GWAS—including HBS1L/MYB, PRKCE, and RCL1—
suggesting that studies that leverage evidence of correlation between RBC traits to increase
statistical power may help identify additional novel loci. Such “combined phenotype” studies are
enabled by statistical and genomic developments, as well as the improved assessment of genetic
variation in racial/ethnic minority populations. Together, these suggest that the time is right to
perform a combined-phenotype examination of RBC traits34; 41; 42.
Finally, improved coverage of rare variants via innovations in imputation and genome
measurement, as well as a vast array of functional annotations, are now available facilitate
fine-mapping and functional characterization of RBC trait association signals. Diverse populations
are also more likely to have an increased quantity of rare variants when compared with European
populations. The interrogation of rare variants in a large study population, particularly one
exhibiting ancestral diversity, may thus be beneficial in identifying additional novel loci that are
relevant for RBC traits across all ancestries, as has been demonstrated in rare-variant studies of
other complex traits43-48.
Innovative, recently developed methods and the availability of GWAS and phenotype
data in the large, ancestrally diverse Population Architecture Using Genomics in Epidemiology
(PAGE) consortium uniquely position us to detect and characterize RBC trait genetic
participants. Continued identification of such associations can help clarify the genetic
architecture of RBC traits and elucidate mechanisms of RBC trait biology. An improved
understanding of the suite of genes contributing to RBC traits will benefit both basic science and
translational research as they pertain to blood diseases as well as phenotypes strongly associated
SPECIFIC AIMS
2.1. Aim1: Leverage evidence of pleiotropy to identify and characterize RBC trait loci. Aim 1a. Estimate trans-ethnic and ancestry-specific univariate genome-wide genetic associations in approximately 68,000 African American, European American, and
Hispanic/Latino PAGE participants between approximately 25 million variants (effective
heterozygosity >35 by study population) and seven RBC traits (HCT, HGB, RBCC, RDW,
MCH, MCHC, and MCV) using SUGEN software.
Aim 1b. Using summary statistics from Aim 1a, apply the adaptive sum of powered score (aSPU) test, which integrates evidence of association across multiple correlated traits, to identify
potentially pleiotropic loci.
Aim 1c. Using summary statistics from Aim 1a, perform iterative conditional analysis, which will identify independent leads SNPs within association signals and determine the
presence of secondary signals, i.e., physically proximal or overlapping association signals with
independent index variants. Sensitivity analyses will be performed by race-ethnicity at
multi-ethnic combined-phenotype lead SNPs.
Aim 1d. Annotate (novel and previously identified) association signals from Aim 1a and 1b using the ENCODE Variant Expression Predictor (VEP) and GTEx eQTL database to assess
potential functional significance of candidate variants.
American, Asian American, and Native American MEGA-genotyped PAGE Study participants,
perform univariate gene-based testing using SKAT-O—a combined burden and
variance-component test—for approximately 25,000 genes in each of seven RBC traits (HCT, HGB,
RBCC, RDW, MCH, MCHC, and MCV).
Aim 2b. Annotate the ontology of candidate genes identified in Aim 2a using publicly available databases to determine biological pathways that are well-represented among
genome-wide-significant (GWS, Bonferroni-corrected alpha = 2.87x10⁻⁷) findings for one or more RBC
traits.
Aim 2c. Annotate the most significant variant for each significant transcript identified in Aim 2c using publicly available databases—including VEP and Blueprint—to identify globally
BACKGROUND AND SIGNIFICANCE
3.1. Historical background
Red blood cells have been recognized as a crucial contributor to human physiology for
millennia: as far back as 3000 BCE, Egyptian physicians were cognizant of the connection
between the heart and circulatory system, although the physiologic functions of this system were
not elucidated until much later49-52. From the medical practices of ancient Greek and Islamic
physicians through the European Middle Ages, blood was considered one of the four primary “humors” and the main contributor to the “sanguine temperament”—concordantly, blood-letting
was a common treatment for disease states associated with "excessive blood humor", such as
insanity, heart and vascular disease, and menstrual disorders53-55. Although the concept of
humors fell out of favor in medicine during the 19th century (upon the acceptance of Virchow’s
cell theory and, subsequently, germ theory), the practice of blood-letting remained widespread in
the Western world into the 20th century56-60. When the discovery was made in the mid-17th
century that all living organisms comprised one or more cells, red blood cells were among the
earliest to be characterized given their ready availability from human and animal subjects60. By
the mid-20th century, the importance of hemoglobin—the RBC-specific protein responsible for
the oxygenation of all bodily tissues—was recognized as contributing to several prevalent
monogenic hereditary anemias (see Table 1)61-65. In current medical practice, a complete blood
states, and can also be employed alongside other signs and symptoms in determining the
underlying cause of a wide variety of diseases66-74.
3.2. Red blood cell biology
The primary function of RBCs is to transport oxygen from the lungs to tissues throughout
the body. In mammals, RBCs absorb oxygen at the interface of alveoli in the lungs and
pulmonary vessels; oxygen is then delivered by RBCs to tissues throughout the body as blood is
pumped through the vasculature. The average RBC makes over a thousand journeys per day
through the heart to deliver oxygen to peripheral tissues. Another task delegated to RBCs is to
clear toxic or waste materials from tissues via the bloodstream. This primarily involves
interaction with macrophages in the liver or spleen, in which RBCs release unwanted materials
through exocytosis for subsequent uptake by the adjacent macrophage75. Given these functions,
which involve membrane deformation to pass through arterial and venous capillaries, a typical
enucleated RBC is approximately 1/10 the diameter of a human hair (about 8 microns), with over
20 trillion RBCs in circulation in an adult human at any given time. As the most numerous cell
type in the body (similar in number to platelets, which may also be considered cell fragments)
responsible for oxygenation of all tissues, the maintenance and development of RBCs are tightly
regulated.
RBCs begin their journey as multipotent hematopoietic stem cells (HSCs), which are
located in the bone marrow. HSCs are self-renewing, meaning this population—which is the
predecessor of every blood cell in the body—is sustained from birth through adulthood via
mitosis. The HSC lineage is limited to blood-cell types (meaning they cannot differentiate into
common myeloid progenitor cells. The former differentiate into white blood cells (WBCs),
whereas the latter may differentiate into several types of white blood cells or the shared early
progenitor cell for RBCs and megakaryocytes (which are the precursor cell that become
platelets), appropriately designated "megakaryocyte/erythrocyte progenitors" (MEPs). Up to two
million RBCs are degraded every second; hence, a similar number of progenitor cells need to be
generated at the same rate to maintain a sufficient RBC population in the body. Although not the
subject of this dissertation, 5 to 6 million megakaryocytes originating from the same HSC
population must also be terminally differentiated each day to maintain the >100 trillion platelets
circulating in the vasculature at a given time76. In combination, erythropoiesis and
megakaryopoiesis are extremely demanding, further emphasizing the delicate nature of balancing
these highly prolific processes.
3.2.1. Three waves of hematopoiesis
The establishment of an RBC population begins very early in fetal development and the
required ubiquity of RBCs for oxygenation of all tissues make understanding the molecular
underpinnings of any aspect of their development relevant to public health researchers. In utero
RBC development is very different from the process of RBC differentiation in adults (the latter
being the focus of this dissertation) with different genetic underpinnings, and will therefore be
explained here only in brief. The first wave of hematopoiesis comes early in development from
the primitive streak of mesodermal cells in the yolk sac77. These immature RBCs still contain
nuclei and are derived from hemangioblasts, which are a shared precursor cells for blood vessel
tissues and blood cells77. During the second wave of hematopoiesis—beginning late in fetal
development—erythromyeloid progenitors become the primary progenitor cell from which
derived. Erythromyeloid progenitors begin in the yolk sac and form colonies similar to those
formed in the bone marrow in adults.
The final wave of hematopoiesis involved emergence of HSCs from the haemogenic
endothelium, located in the dorsal aorta of the aorta-gonad-mesonephros region of the fetus77.
This population of HSCs migrates to the liver, expands via multiple rounds of mitosis, and
eventually migrates further into the bone marrow78. Once this population of HSCs reaches the
bone marrow, the cells become a self-replenishing population from which all RBCs are
generated throughout the life of the individual77; 79. Because of the limited lifetime supply of
these cells, their self-renewing nature, and the large number of cell types for which they act as
the source precursor population, HSCs are susceptible to somatic mutations that can result in
blood cancers80-82. Thus, to sustain the genomic integrity of this vital population, HSCs not
actively involved in the cell division process preceding hematopoiesis are typically maintained in
a quiescent state with minimal transcriptional activity83.
3.2.2. Hemoglobin: the primary actor in RBC oxygen transportation and delivery
Before describing stages of erythropoiesis and RBC degradation, we will briefly describe
the hemoglobin protein, given its critical role in RBC function and tissue oxygenation.
Hemoglobin is the protein responsible for RBC transportation of oxygen to tissues throughout
the body and return of cellular toxins to the liver for processing. Hemoglobin was first identified
by Engelhardt in 1825 and described in terms of chemical composition by Hünefeld in 1840,
with several other contributors further characterizing this protein in the mid-19th century,
including describing the structure and function in humans84; 85. In addition to having a strong
affinity for oxygen, hemoglobin can also bind CO2, allowing for removal of the gas generated in
which is believed to have developed from a duplication of the myoglobin gene and subsequent
functional evolution beginning several hundred million years ago86.
RBCs developed during the first wave of hematopoiesis express the hemoglobin genes
most common during fetal development, and do not enucleate until entering circulation.
Erythroblasts during the second wave of hematopoiesis express primarily the "adult" forms of
hemoglobin protein subunits, as the fetal genes begin to be downregulated. Once fetal
development has progressed to the final stage of hematopoiesis, the adult form of hemoglobin
becomes established as the primary form, which this section will briefly describe87. Tight
regulation of hemoglobin production and assembly is required for successful generation of RBC
cells from the pool of HSCs in the bone marrow, although several compensatory mechanisms
with overlapping functions exist that can make up for minor insufficiencies (see Section 3.2.4). Human adult hemoglobin is tetrahedron-shaped and comprises four subunits—two alpha
and two beta—which are coded by the HBA and HBB genes, respectively. Insufficient
hemoglobin transcription, translation, or assembly can lead to abnormal RBC trait values (see
Section 3.3). Several examples of mutations in these genes causing Mendelian RBC-related disorders are described briefly in Section 3.4.1 and Table 1; however, these regions both exhibit strong association in GWAS even after adjustment for Mendelian variants, indicating that
common variants that play a more modest role in the distribution of RBC trait values in general
populations may exist 18.
3.2.3. Stages of Erythropoiesis and RBC Degradation
HSCs are located in the deep bone marrow in clusters of self-renewing cells and, as
highlighted above, are progenitors of multiple cell types including RBCs. The first stage of
macrophage island in the deep bone marrow, referred to as "blast-forming units" (BFUs)88; 89.
Through the subsequent stages portrayed in Figure 1, each differentiation stage involves decreased cell diameter and volume; more chromatin condensation; reduced diversity of RNA
transcription; and an increased emphasis on hemoglobin production75; 89. After HSCs become
committed to the RBC path, all stages of erythroblast differentiation in the bone marrow involve
direct physical contact with macrophages through a number of cell-membrane proteins, including
erythroblast-macrophage protein (EMP), which is found in the membranes of macrophages and
developing RBCs75. As the immature erythrocyte progresses through each stage of
differentiation, hemoglobin transcription increases and, eventually, hemoglobin subunits become
the dominant transcript, accompanying the dramatic downregulation of most other
protein-coding genes prior to enucleation90-92.
In the final stage of differentiation that occurs in the bone marrow, orthochromatic erythroblasts
in the sinusoidal bone marrow (near an entry point to the vasculature) expel their nucleus and
most of the accompanying cellular machinery in a process referred to as "nuclear extrusion"77; 87;
93. The nucleated portion of the RBC remaining after this division is referred to as a pyrenocyte,
which is absorbed by the central macrophage75.
The enucleated cell (a reticulocyte) is then released into circulation from the bone
marrow, which circulates for one to two days while membrane composition and remaining
hemoglobin translation are finalized, resulting in a terminally differentiated or “mature” erythrocyte (henceforth referred to simply as “RBCs”) with the recognizable biconcave shape.
Of note, the enucleation process is unique to mammals, as lower vertebrates such fish and birds
have no or very few anuclear RBCs94. While restricting the RBC to a lifespan limited by the
easily identifiable "donut" shape of RBCs, which allows for extensive deformation of the cell,
facilitating travel through capillaries and intercellular spaces to deliver oxygen with extremely
high efficiency89. After an average lifespan of 120 days, RBCs become irreparably damaged or
enter senescence and are degraded in the red pulp of the spleen. Macrophages phagocytose RBCs
no longer fit for circulation, recycling the iron to the bone marrow for new RBC production and
hemoglobin loading88; 89.
3.2.4. Iron homeostasis in erythropoiesis
RBCs can only perform their primary function of delivering oxygen molecules to
peripheral tissues when sufficient iron (approximately 25mg of iron per day) is available to
produce and activate hemoglobin95-97. Free iron ions in the bloodstream are toxic, and must
therefore be either stored in bodily tissues or, when present in the blood, bound by transferrin
molecules97; 98. The amount of iron stored in the body at a given time is estimated based on
measurements of molecules in the serum such as hemoglobin level and ferritin99. Iron stores are
built up during fetal development—during which time iron molecules are crucial for a large
number of biological processes—and infants are born with an average iron store sufficient for all
required tissue uses until 6 months of age, with the difference required to maintain the expanding
HSC population absorbed through the diet. The vast majority of iron molecules used in adult
hemoglobin synthesis come not from the diet (which provides a relatively low proportion of the
total iron used in erythropoiesis), but rather from macrophages, which accumulate iron stores in
the spleen via the degradation of senescent RBCs95. A very small proportion (~4mg or 0.1%) of
the body’s total iron content is transferrin-bound at any particular time, meaning nearly the entire
supply of iron molecules for hemoglobin synthesis is recycled through the liver or macrophages
iron storage and, therefore, RBC function, underscores the biologic relevance of genes expressed
in those tissues (here, WBCs or liver) for RBC function and maintenance. For example,
mutations in CFHR1 have been shown to cause a rare form of hemolytic anemia, but this gene is
more highly transcribed in the liver than whole blood or bone marrow100; 101. Given the
importance of iron homeostasis to maintaining a healthy RBC population, we briefly characterize
the shared biological actors involved in iron homeostasis and erythropoiesis below.
3.2.4.1 Genetic regulation of iron homeostasis
A group of proteins co-regulate iron homeostasis and erythropoiesis, several of which
have been implicated in monogenic anemias (Table 1). Briefly, Camaschella, et al, propose the following mechanism of inducing or repressing erythropoiesis, which is highly dependent on
iron homeostasis (see Table 2 for a description of the relevant genes). Developing erythroblasts express TFR2 on the cell surface, which modulates the sensitivity of RBCs to erythropoietin
(EPO). The presence of EPO can induce acute erythropoiesis expansion, leading to a relative iron
deficiency. Subsequently, the presence of surface TFR2 on erythrocytes is diminished, which
increases the effect of EPO, leading to an in-kind increase in erythroferrone (ERFE, which is
allowed by decreased BMP/SMAD function). The presence of ERFE leads to a downregulation
of hepcidin, followed by increased dietary iron absorption through the small intestine95. Once
iron stores have been sufficiently restored, hepcidin is upregulated, leading to suppression of iron
absorption through intestinal hepcidin-ferroportin interaction102.
3.3. Red blood cell trait definitions and measurement
A complete blood count (CBC) panel, the most common method of evaluating RBC
traits, can be used to assess RBC development and maintenance. RBCs are described using
that allow for population-level comparison of RBC development and maintenance. Recently
developed hematology analyzers are capable of measuring a wide array of parameters such as
proportion of hypochromic cells or immature reticulocytes (both of which can be used clinically
in anemia diagnosis). However, this dissertation will focus on the seven RBC traits—described
below—that are most commonly evaluated in clinical, epidemiological, and genomic research
studies: hematocrit (HCT), hemoglobin concentration (HGB), red blood cell count (RBCC), red
cell distribution width (RDW), mean corpuscular hemoglobin (MCH), mean corpuscular
hemoglobin concentration (MCHC), and mean corpuscular volume (MCV). Separately, each
parameter describes a distinct aspect of RBCs that is useful in its own right; in combination,
RBC traits are often helpful for distinguishing the cause of an anemia and potential ways to
address that cause. Specifically, basic physiological changes that differ by underlying cause of
anemia can lead to an increase or decrease in one or more RBC traits traditionally measured in a
CBC, so using RBC trait values in combination can assist in diagnosis. Associations between the
RBC traits described below and traditional epidemiologic risk factors are described in Section 3.5.1.
3.3.1. HCT
HCT refers to the proportion of whole blood volume made up of red blood cells, and is
reported as a percent. Low hematocrit is indicative of anemia, with the normal low reference
value for adults in the United States defined as 37% for women and 42% for men103. HCT also
directly contributes to blood viscosity—for example, individuals with polycythemia vera (excess
RBC production and hence increased HCT and HGB) have an increased blood viscosity, which
3.3.2. HGB
HGB refers to the concentration of the hemoglobin protein in whole blood, and is
reported in grams per deciliter (g/dL). As described above, hemoglobin is the primary protein in
RBCs and is required to effectively transport oxygen to tissues throughout the body. Anemia,
defined by the WHO as HGB <13 g/dL in men or <12 g/dL in women, decreases with age even
in healthy individuals with no other major risk factors (see Section 4.1.1 for description of how this trend varies by biological sex) 105-108.
3.3.3. RBCC
RBCC refers to the average number of mature (i.e., enucleated) RBCs per unit of volume,
typically reported in millions of cells per millimeter cubed (106 cells/mm3) or billions of cells per
milliliter (109 cells/mL). The average human produces 2 billion RBCs per day, and any
perturbations in this tightly regulated process (in the bone marrow, vasculature, or relevant
tissues such as liver or spleen) can lead to excessive or insufficient RBC counts75; 87; 92; 93; 109.
3.3.4. MCH
Mean corpuscular hemoglobin (MCH) refers to the average dry-weight mass of
hemoglobin protein per RBC, reported in picograms and calculated as shown in Table 3. Hemoglobin constitutes over 90% of the dry weight of an RBC, including the cell membrane110;
111. An increased MCH could be due to lower MCV with maintained hemoglobin transcription
during erythropoiesis, or increased hemoglobin transcription with other parameters held constant.
MCH varies modestly by sex and race/ethnicity, and increases with age106; 112.
3.3.5. MCHC
Mean corpuscular hemoglobin concentration (MCHC) refers to the average concentration
described in Table 3. MCHC increases gradually during the life cycle of an RBC as volume decreases more quickly than hemoglobin content111.
3.3.6. MCV
Mean corpuscular volume (MCV) refers to the average cell size of mature RBCs in an
individual, and is reported in femtoliters (fL). MCV decreases throughout the life of the mature
RBC, with the HSC being approximately 10 times as large as a red blood cell at the end of its
functional life (Figure 1). Incomplete or delayed enucleation can lead to an increased MCV (macrocytosis). Conversely, iron deficiency or insufficient hemoglobin production can cause
decreased MCV (microcytosis)113-115. Additionally, functional deficiencies regarding
vesiculation or hemoglobin retention can affect MCV in either direction111.
3.3.7. RDW
Red cell distribution width (RDW) refers to the intra-individual variation in RBC
volume. An abnormally high or low RDW can indicate disruptions in RBC development or
failure to remove damaged or senescent cells. There are two methods of reporting
RDW—RDW-SD (RDW—RDW-SD: standard deviation) and RDW-CV (CV: coefficient of variation). RDW-RDW—RDW-SD is measured
as 2 times the standard deviation of the distribution of mean corpuscular volume within an
individual. RDW-CV, the measure to be evaluated in the proposed work, is the coefficient of
variation (reported in %) of the distribution of MCV within an individual, calculated as shown in
Table 3. Approximately 20% of the hemoglobin protein mass and 30% of the total volume of mature RBCs is gradually lost post-enucleation, meaning a certain amount of variation in MCV
is expected111. High RDW (the combined presence of abnormally small and abnormally large
RBCs with a normal MCV) is also referred to as high anisocytosis, which is associated with
anisocytosis may be caused by "decreased MCV; increased reticulocyte volume variance;
[heterogeneity of volume reduction (AKA, variability in amount of membrane and hemoglobin
lost over the lifespan) in circulating RBCs]; and delayed RBC clearance”116.
3.4. Anemia definition and prevalence
The word "anemia" generally refers to a physiologic state in which RBCs cannot perform
their cellular functions due to an insufficiency in RBC differentiation, maintenance, or
degradation. The World Health Organization standard definition for anemia is HGB <12g/dL in
women or <13g/dL in men; this definition is also commonly used in research as CBCs are
frequently available in cohort studies for which any type of biological sample is collected.
Additional criteria can be applied by physicians to identify the cause underlying the anemia; for
example, individuals with a normal-range MCV (80-100fL) would follow the diagnostic criteria
for normocytic anemia, depending on other RBC traits107. While a general criterion for defining
anemia within is useful for determining risk factors relevant to the general population, most
specific criteria—based, for example, on MCV—can be beneficial on an individual level for
describing the exact type of anemia, which will determine the underlying cause best course of
treatment.
Approximately 5.6% of U.S. adults are classified as anemic using the WHO definition,
with nearly 2% of the population having moderate or severe anemia (HGB <11g/dL in men and
non-pregnant women)117. In the NHANES study population, which is considered broadly
representative of US adults, the proportion of men classified as anemic exhibits a linear
association with age, whereas adult women not currently pregnant show a bimodal association,
of dietary folate supplementation in cereal flours in much of the developed world beginning in
the early 1990s—expected to contribute to the notable decrease in anemia prevalence through the
mid-2000s—recent data indicates that anemia is once again on the rise, nearing prevalence
estimates in all population subgroups similar to the beginning of the 21st century117-121. Given the
topical area of this dissertation, below we briefly introduce monogenic anemias and other
spontaneous-onset RBC diseases.
3.4.1. Monogenic RBC anemias and related disorders
RBC traits are, as described above, tightly regulated to maximize efficiency of oxygen
transportation; genetic dysregulation of RBC maintenance can therefore result in heritable
anemias (i.e., insufficient functional hemoglobin in healthy RBCs to meet tissue-oxygenation
demands) with a wide range of severity. Dozens of heritable monogenic anemias have been
described which are globally rare but relevantly frequent in populations with ancestry-specific
causal variants, demonstrating the highly polygenic nature of RBC traits (Table 1). An example of how these proteins interactions drive molecular processes in RBCs is demonstrated by the
interaction network shown in Figure 2. Outside of heritable disorders, somatic mutations in the bone marrow HSC population from which RBCs are derived can lead to blood cancers or other
blood disorders. Below, we briefly review the anemias caused by known genetic variants,
followed by a description of the most prevalent spontaneous-onset RBC diseases.
3.4.1.1 Recessive anemias associated with malaria-protective variants
A large-effect genetic variant causing a recessive anemia that is fatal prior to
reproductive age would be expected to remain extremely rare, unless one copy of the allele (i.e.,
heterozygosity) provided some kind of evolutionary benefit, allowing it to become established.
which confer protection against plasmodium infection have become established in human
populations living in these areas122-129. The pathogenic variants described in this section are
associated with modest effects on HGB and HCT in heterozygotes, but homozygous effect-allele
carriers can be severely affected, accompanied by dramatically abnormal RBC trait values.
3.4.1.1.1 Hemoglobinopathies: sickle-cell disease and thalassemia
An example of a well-characterized hereditary anemia is sickle cell disease (SCD), which
in the United States almost exclusively affects individuals with West African ancestry
(prevalence: ~3/1,000 African Americans, 1/36,000 Hispanic/Latino Americans). Sickle-cell
disease causes extreme pain, has severe complications, and is fatal in the first two decades of life
without treatment130. The most common causal variant for sickle-cell trait is rs334 (which leads
to transcription of the inefficient hemoglobin “S” beta chain), which is specific to
African-descent populations and causes SCD in homozygous individuals. Several other variants in the
beta hemoglobin gene are also associated with RBC sickling and exhibit higher allele
frequencies in malaria-endemic regions like the Middle East, Mediterranean countries, and South
Asia. While carriers with one copy of the rs334 effect allele carry protection against infection
with malaria, even sickle-cell carriers can have symptoms associated with partial sickling of
RBCs122; 130; 131. The heterozygous state for SCD—sickle cell trait—is also associated with
complications during exercise, from cramping to exercise-induced sudden death132. Among
African Americans, compared to having two normal copies of the beta hemoglobin gene,
sickle-cell trait has also been associated with venous thromboembolism; ischemic stroke; and
kidney-function insufficiency (an association also identified in Hispanic/Latino Americans) 133-136.
Another common recessive monogenic anemia is thalassemia, referring to mutations in
mutations137. When a mutation in the gene for one hemoglobin subunit leads to a reduction in
available protein despite a normal level of transcription, excessive build-up of the other subunit
negatively affects erythropoiesis and may also cause hemolysis of mature RBCs in the
bloodstream126; 137; 138. Established thalassemia variants are most prevalent in Southeast Asia and
Mediterranean countries, including Cyprus, which has a carrier frequency (i.e., heterozygosity)
of 14.3%139. Treatments for moderate to severe thalassemia as well as SCD include frequent
blood transfusions, which are accompanied by additional risks including iron overload;
alloimmunization leading to extensive delayed hemolysis; and transfusion-related infection,
particularly in low-resource areas where extensive screening is not available130; 140-142. Neither
condition can currently be cured except with a bone marrow transplant, which is accompanied by
a high rejection rate, particularly from unrelated donors; gene therapies have recently been
explored as a potential alternative with more modest risks143-147.
3.4.1.1.2 Non-hemoglobinopathy malaria-related anemia genes
Several genes for which heterozygotes obtain protection from malaria aside from the
hemoglobin chains have been causally associated with RBC-related conditions. Examples of
such genes include G6PD deficiency (an X-linked condition with hemizygous inheritance in
males), mutations in DARC, and hereditary spherocytosis due to mutations in ANK116; 129; 148; 149.
Unlike the specific variants most commonly associated with the hemoglobinopathies, there are
dozens of causal variants found at the DARC, G6PD, and ANK1 loci. Due to the incapacity of
RBCs to transcribe RNA once the nucleus has been expelled, it is perhaps not surprising that
variants in one of the many components of the highly specialized RBC membrane-cytoskeleton
complex may cause hereditary anemias150. As described in Table 1, in addition to the
with the rs334, most of these variants became established in a malaria-endemic region of the
world, and are therefore either population-specific or exhibit large allele-frequency differences
by ancestry.
3.4.1.2 Other monogenic RBC anemias
Aside from genetic variants specifically associated with malaria resistance, several dozen
genes have been causally associated with dominant, recessive, or X-linked anemias. These
anemias range in frequency from relatively common (hereditary spherocytosis affects
approximately 0.05% of Northern Europeans, with about half of cases having causal variants in
the ANK1 gene) to extremely rare (Nakajo-Nishimura syndrome, caused by a mutation in
PSMB8, has only had approximately 30 cases reported despite being first described in the 1930s;
see Table 1)152; 153. These gene products range in function from transcription factors (KLF1) to
proteins involved in glycolysis (PKLR) to ribosomal functions (RPL and RPS family members);
several causal genes remain incompletely characterized.
3.4.1.3 RBC disorders attributable to somatic mutations
In addition to heritable anemias, several other monogenic diseases can affect RBCs.
Specifically, erythroleukemia can develop due to a somatic mutation, meaning heritability is very
low but several genes have been identified for which causal somatic mutations occur more
frequently than would be expected due to the normal mutation rate accompanying replication80;
154. As another example, polycythemia vera—a myeloproliferative disorder—is not typically
heritable but does occasionally occur in families, particularly those with a predisposition to a
specific JAK2 mutation that has been demonstrated to occur somatically in multiple family
3.4.2. Summary
Over 50 monogenic anemias—primarily with a recessive mode of inheritance—have
been described and genetically mapped to date, providing a broad insight into RBC physiology.
Among adults in the United States, acquired anemias (i.e., non-monogenic and have a high
environmental component) account for the large majority of anemia prevalence117; 155. While
environmental risk factors can affect RBC traits sufficiently to lead to an anemic state, the
number of genes associated with monogenic anemias alone supports these traits being highly
polygenic. While monogenic anemias are important for clinical diagnostics because of the
relatively large effect magnitude of most known variants, many more genetic loci likely
contribute to RBC traits via common or rare variants with small effect sizes. As described in
Appendix A, gene expression and cellular maintenance are subject to many forms of environmental and genetic regulation. The combined effects of common risk factors and
underlying genetic variation are expected to form the distribution of RBC traits within any
particular population. Below we discuss RBC trait epidemiology, based primarily on cohort
studies, and how traditional risk factors contribute to population-level variation for these traits.
3.5. Red blood cell epidemiology
As described in Section 3.6., RBC trait values are associated with myriad diseases of public health importance97; 156-159. Environmental exposures—including acidity/basicity of the
cytoplasm; temperature; osmolarity/tonicity; molecular products released by commensal or
pathogenic bacteria (tissue-specific); the contents of extracellular vesicles from other cell types;
and availability of minerals or other molecules used in molecular processes—can affect gene