DOES THE GUT MICROBIOTA INFLUENCE THE IMMUNE RESPONSE TO INFLUENZA VACCINATION IN OBESE POPULATIONS?
Cyrus P. Adams-Mardi
A thesis submitted to the faculty of the University of North Carolina at Chapel Hill in partial fulfillment of the requirements for the degree of Master of Science in the Department of
Nutrition (Nutritional Biochemistry) in the Gillings School of Global Public Health.
Chapel Hill 2019
ii © 2019
iii ABSTRACT
Cyrus P. Adams-Mardi: Does the Gut Microbiota Influence the Immune Response to Influenza Vaccination in Obese Populations?
(Under the Direction of Melinda Beck)
iv
ACKNOWLEDGEMENTS
v
TABLE OF CONTENTS
LIST OF TABLES...vi
LIST OF FIGURES………...vii
LIST OF ABBREVIATIONS AND SYMBOLS……….viii
CHAPTER I – BACKGROUND………1
Obesity...………...1
Influenza Virus and the Immune System………...3
Obesity and Influenza Vaccine………7
The Gut Microbiota as a Mediator of Obesity Impaired Vaccine Response...…10
Hypothesis and Aims……….14
CHAPTER II – METHODS, RESULTS, DISCUSSION……….16
Methods………..……16
Results………25
Discussion………..48
Conclusion and Other Future Directions………...53
vi
LIST OF TABLES
vii
LIST OF FIGURES
Background Figure 1. Conserved and variable aspects of the human
microbiome, from the Human Microbiome Project, 2007...13
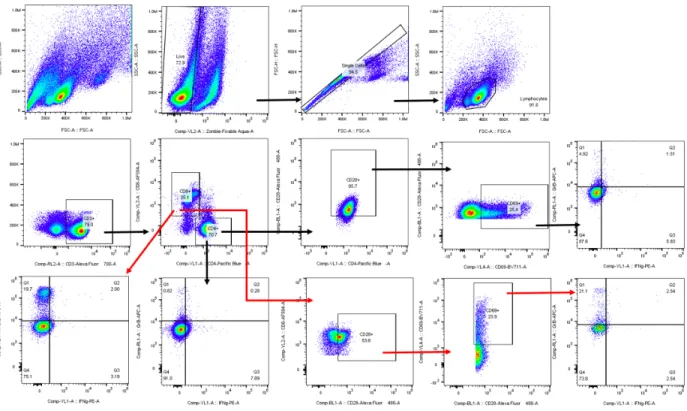
Figure 1. Flow cytometry T cell functional panel gating strategy...21
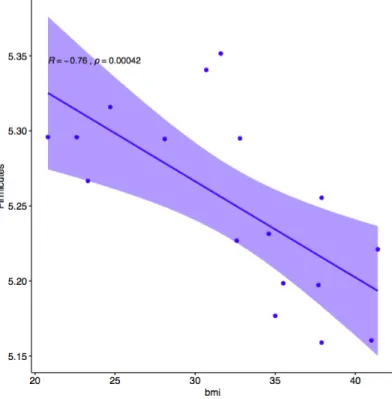
Figure 2. Correlation plot between Firmicutes OTU and body mass index...26
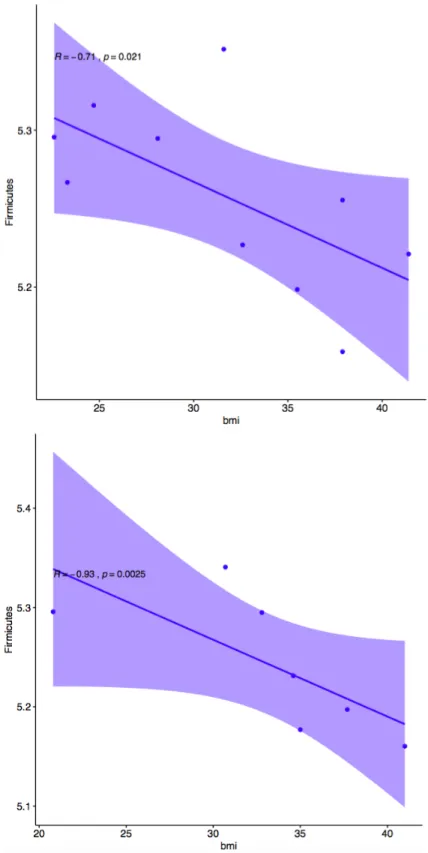
Figure 3. Correlation plots between Firmicutes OTU and body mass index in African American vs Caucasian participants...27
Figure 4. Correlation plot between Firmicutes OTU and body mass index in female vs male participants...28
Figure 5. Correlation plot between BMI and Shannon alpha diversity, box plots comparing obese and non-obese Shannon alpha diversity...29
Figure 6. Correlation plots of BMI with IgG and HAI titer data...31
Figure 7. Box plots comparing Firmicutes and Bacteroidetes OTUs between male and female participants...33
Figure 8. Correlation plots between gut microbial OTUs and IgG and HAI titer data...35
Figure 9. Correlation plots between gut microbial OTUs and T cell flow cytometry data...36
Figure 10. Correlation plots between richness and T cell flow cytometry data...40
Figure 11. PCA plots visualizing OTU clustering by obesity status...42
Figure 12. PCA plots visualizing OUT clustering by gender and BMI...45
Figure 13. PCA Biplot of OUT contribution to study participants...46
Figure 14. Factor map colored by phylum level contribution score. ...46
viii
LIST OF ABBREVIATIONS AND SYMBOLS
APCs Antigen presenting cells ATP Adenosine triphosphate BMI Body mass index
CD4+ Cluster of differentiation 4 – helper T cell marker CD8+ Cluster of differentiation 8 – cytotoxic T cell marker
GrB Grazyme B
H1N1 hemagglutinin 1 neuraminidase 1
HAI Hemagglutination inhibition assay IFN-γ Interferon gamma
IL-6 Interleukin-6 (pro-inflammatory)
MHCII Major histocompatibility complex II PBMC Peripheral blood mononuclear cell PCA Principal Component Analysis
1
CHAPTER I - INTRODUCTION
Obesity
In the United States and globally, rates of obesity have greatly increased and prevalence is continuing to grow. As of 2014, 35.0% of adult males and 40.4% of adult females in the U.S. were obese, according to the National Health and Nutrition Examination Survey (NHANES).1 Overweight and obesity are defined using the body mass index (BMI), a measure that incorporates both height and weight. BMI is reported using the formula weight (kg)/ height (m2). Not only is over a third of the U.S. obese (BMI ≥ 30 kg/m2), but over two thirds of the U.S. population is either overweight or obese (BMI ≥ 25 kg/m2).3 In the year 2000, 15% of total deaths in the U.S. were attributed to excess weight stemming from poor diet and low physical activity.4 Further, a 2019 publication by Afshin et al. showed that poor diets are responsible for more deaths globally (1990-2017) than any other risk factor, including smoking.5
2
races, and genders which raises concern for future trajectories of global health.4 However, it must be noted that disparity exists in the races most affected by obesity. The proportion of Hispanic and African American individuals in the U.S. who are affected by obesity is significantly higher than that of other ethnicities such as Caucasians and Asian Americans.7 The U.S. has the highest rates of obesity in the world, and there is a concerning increase in the prevalence of childhood obesity which places future generations at risk of health complications as well.7
Obesity is caused by increased energy intake and decreased energy expenditure that results in sustained positive energy balance and the accumulation of excess adipose tissue.8 Increased visceral adiposity in the abdomen, a key feature of obesity, is associated with metabolic perturbations that extend beyond the physical phenotype of increased adipose tissue. Visceral adipocytes are metabolically impaired in obesity and release increased amounts of pro-inflammatory cytokines in response to the abnormal surplus of lipid stores in the abdominal cavity.8 This in turn recruits increased numbers of immune cells, which then secrete pro-inflammatory mediators as well.8 These cytokines, including but not limited to TNF
α (tumor necrosis factor alpha) and IL-6 (interleukin-6), expose other tissues to a higher level of inflammatory stimulation in obese individuals compared to those who are lean.8 These signals cause systemic activation of other inflammatory pathways including but not limited to JNK (c-jun N-terminal kinase), inflammasome, and PRR (pattern recognition receptor) mechanisms.8 This indicates that obesity is associated with a variety of conditions related to low-grade chronic inflammation, in addition to hormonal and metabolic dysfunction as a result.8
3
three of the five following factors results in a diagnosis of metabolic syndrome: hyperglycemia, elevated blood pressure, elevated serum triglyceride levels, low high-density lipoprotein cholesterol levels, and obesity (particularly central adiposity).9 Recently, there has also developed a growing body of research suggesting that the risk of disease in obesity extends beyond just chronic conditions.3,10
Obesity has been shown to increase both the incidence of, and the risk associated with, infectious diseases.3,10 The course of bacterial infections is altered in obesity according to previous cohort studies and systematic reviews.11 Additionally, obesity appears to contribute to the overall development and progression of chronic viral infections such as hepatitis C.12 Acute viral infections are also riskier in obesity. H1NI influenza infections that result in hospitalization, intensive care treatment, or death have a common significant comorbidity of obesity.10 Notably, obesity is linked to impairment of the immune response to influenza virus and influenza vaccination as well.2,3,13–18
Influenza Virus and the Immune System
4
create a response that is faster and higher in magnitude to subsequent exposures to the same pathogen. Functioning properly, the immune system can recognize and eliminate pathogens without the host having any symptoms that typically characterize the infection. However, dysfunction in either arm of the immune system can put the host at risk for greater susceptibility to infection. The influenza virus is a good example of a pathogen that affects people very differently based on a variety of risk factors such as age and BMI.
Influenza, an RNA virus, contains 8 single stranded RNA segments. The influenza virus has a spherical shape with an outer layer that contains hemagglutinin (HA) and neuraminidase (NA) glycoproteins. These proteins are used in the naming system for all influenza viruses (i.e. H1N1 contains hemagglutinin type 1 and neuraminidase type 1), and are typically targeted in influenza vaccines and targeted by influenza specific antibodies.19 HA functions for attachment to host cell receptors and NA involves releasing new virus from the host cell. There are 16 known HA and 9 known NA proteins that lend to the wide diversity of influenza strains that have been isolated throughout history.20 All strains of influenza are not infectious to all organisms, only certain types of influenza can infect humans, and some can infect multiple species (i.e. historical pandemic swine or avian influenza which did not originate in humans).
5
become the outer surface of the viral particle. The viral RNA is then packaged inside the envelope proteins and the influenza virus buds out of host cell. This means that the viral surface is actually constructed from the hosts very own plasma membrane.19
Antigen presenting cells (APCs - dendritic cells and macrophages) are the first immune cells to come into contact with the influenza virus if it successfully penetrates the mucous layer and epithelial junctions in the respiratory tract, as influenza is an airborne virus. APCs are phagocytic and will engulf and digest the viral particle upon pathogen recognition. They will then present fragments of viral peptide (antigens) on their surface combined with MHC (major histocompatibility complex) class I and class II.21 After migrating to secondary lymphoid tissues such as draining lymph nodes or the spleen, the MHC class I and II bound antigens are presented to the adaptive immune cells, T and B lymphocytes. Upon contact with a naïve adaptive lymphocyte that has not encountered antigen and differentiated, the APC will initiate adaptive immunity by receptor recombination via somatic hypermutation and affinity maturation to the presented antigen.21
6
GrB) for this lytic activity.21 Th cells are responsible for helping B cells secrete antibodies, secreting cytokines that enhance macrophages phagocytosis, and activating cytotoxic T cells to kill virus-infected cells.21
The primary immunoglobulin secreted from plasma cells is IgG. There are 4 subclasses of IgG: IgG1, IgG2, IgG3, and IgG4 which are in order of decreasing abundance.22 IgG1 is typically part of the humoral response to protein antigens.22 IgG2 is effective in response to carbohydrate antigens such as capsular polysaccharides.22 IgG3 antibodies are best known for their pro-inflammatory function as inducers of effector function.22 IgG4 is known to be induced in response to allergens and long-term non-infectious antigen exposure.22 IgG1, IgG2, and IgG3 commonly induced in response to acute infections and vaccination and are of particular interest. Clearly, both arms of the immune system are crucial for this response and. After the infection has been controlled, approximately 90% of effector cells then undergo apoptosis and about 10% of the effector population with specificity transition to the aforementioned T and B memory cells. Influenza specific antibodies will also continue circulating, which can flag viral particles for destruction even after the plasma cells stop secreting, as the antibodies outlive the plasma cells for a short period of time.
7
because the 2009 pandemic was responsible for hundreds of thousands of deaths worldwide.3 With the rising burden of obesity globally that was being lead by the U.S., this became a critical need for further research because it meant that more obese countries could be more vulnerable to outbreaks of pandemic influenza.
Antigenic drift in the influenza virus is the mild level of annual change in the virus that results in seasonal outbreaks globally. Antigenic shift however, is a big and impactful change due to mutation and combination from multiple strains of virus which typically results in pandemic outbreaks. These two factors together ensure that the flu is a constant burden of disease. It is important to note that even though the flu season is typically worse from late fall to early spring, it is a year-round risk as summer outbreaks can occur too. In addition, the seasonal difference between the northern and southern hemispheres means that while it is summer in one half of the world, it is flu season in the other. The lack of seasonal variability in equatorial regions means that there is a relatively constant baseline level of influenza activity year round without seasonal cycling. That is why it is particularly important to keep up to date with the influenza vaccination if traveling between hemispheres. The risk is compounded by the wide variety of individuals who are especially susceptible to severe flu outcomes, including young children, the elderly, pregnant women, the immunocompromised, asthma, chronic pulmonary disease, and chronic cardiovascular disease in addition to those with obesity.3 In counteracting this public health threat, the influenza vaccination is the single most effective intervention for flu protection.
Obesity and Influenza Vaccine
8
though a diminished antibody response is likely not the cause of increased risk of influenza in obese adults, the T cell response to the vaccine is impaired. Compared with lean adults, T cells from obese adults stimulated with vaccine strains of virus are less functional and less activated. Thus, it is likely that impaired T cell responses in obese adults results in increased susceptibility to influenza, despite vaccination. However, the mechanisms underlying T cell impairment are not clear.13
9
The immune system’s mechanism of response to the influenza vaccination is almost identical to that against the influenza virus, as the vaccination is targeted to this pathway. The deltoid muscle, for example, is selected for because of its high concentration of dendritic cells (an APC) that will present the viral fragments and migrate to lymphoid tissues. Vaccination induces a memory response. This means that, when exposed to virus, plasma cells will more quickly produce larger amounts of specific antibody (primarily IgG), and CD4+ and CD8+ Th and CTL T cells will respond faster and more robustly by secreting inflammatory cytokines.
10
result indicates that some other components of the immune system might be the cause and not the humoral response.
An investigation by Smith et al. showed that mice with diet-induced obesity had worse lung pathology, higher mortality, and significantly differed immune responses following infection with the influenza virus.16 Smith’s investigation showed that obese mice had diminished cytokine responses and reduced natural killer (NK) cell effector function in response to the influenza virus compared to lean mice.16 This is notable because the NK cell is a key component of the innate immunity that is specially armed to initiate apoptosis virally infected cells. T cells are also of particular interest and it has been hypothesized they could be the source of impairment in the response to the TIV in obesity.
11
The Gut Microbiota as a Mediator of Obesity Impaired Vaccine Response
The perturbations seen in the inflammatory behavior of visceral adipocytes are not the only systemically impactful alterations that occur with obesity. The intestinal, or gut, microbiota is a current hot button of research because it is associated with disease states and can be modulated. In the past ten years there has been a frenzy of research published investigating the relationship between host obesity and the the microbial composition of the intestines. The gut microbiota is the population of microorganisms including bacteria, viruses, and fungi that colonize and inhabit the lower gastrointestinal tract.23 This is not to be confused with the commonly used, and often misused, term gut microbiome. The gut microbiome is the sum of the genetic materials of those organisms that make up the gut microbiota. The gut microbiota is often referred to as its own organ, in that it is physiologically “outside” of the human the body. The human gut microbiota is predominantly described by 5 phyla of bacteria: Bacteroidetes, Firmicutes, Actinobacteria, Proteobacteria, and Verrucomicrobia, with over 90% of the total bacterial species being in Firmicutes and Bacteroidetes.24
12
chronic low grade inflammation as well.23 In a chronic pro-inflammatory state such as obesity, this could be a contributing factor to the underlying immune impairment we see with the influenza vaccine.
13
genetic ob/ob, leptin deficient, and diet-inducted obese mice induce obesity in lean germ free gnotobiotic mice when transplanted.33,34
Background Figure 1. Conserved and variable aspects of the human microbiome, from the Human Microbiome Project, 2007.35
14
in the immune response to the influenza vaccination.36 They found that toll-like receptor 5 (TLR5) has a crucial role in the immune response to the TIV. TLR5 is responsible for the sensing of flagellin, a protein on flagellated bacteria and plays a role in influenza specific plasma cell differentiation.36 TLR5 directly stimulates lymph node macrophages to produce plasma cell growth factors.
These studies show that the gut microbiota is closely related to the immune response to vaccinations and infectious diseases. There are an innumerable number of possible mechanisms through which the gut microbiota can affect the immune system. Obesity as a predictor of the gut microbiome therefore, needs to be investigated in the context of the influenza vaccination to elucidate future directions of research into mechanism discovery into why the TIV fails in obese individuals.
There are many studies investigating these relationships in mice, but there is a lack of population-based human data that integrate data on obesity, the intestinal microbiota, and vaccine response in the same study. Therefore, for the first time this study will link BMI, the gut microbiota, and the immune response to the influenza vaccination. The goal of this research is to provide future directions for TIV research in obesity by taking a non-mechanistic correlative bioinformatics approach to these interactions. My hypothesis is that BMI and the gut microbiota will be correlated at the phylum level, and that the gut microbiota will be correlated in turn with impairment of the cellular response to the influenza vaccination. I propose 3 specific aims to test this hypothesis:
Aim 1: Determine if gut microbial composition is associated with body mass index.
15
and phylum Bacteroidetes is inversely associated with BMI. Obesity is known to cause alterations to the gut microbial communities.
Aim 2: Determine if gut microbiota phylum level relative abundance is associated
with the T and B cell response to the influenza vaccination. Hypothesis: T and Bcells from obese adults, upon stimulation with influenza vaccine strains, will be less activated and less functional compared with healthy weight adults.15 Furthermore, this impairment will be associated with increased Firmicutes and decreased Bacteroidetes species seen with increasing BMI.37
Aim 3: Determine if there is a correlation between the gut microbiota, obesity, and
16
CHAPTER II – METHODS, RESULTS, DISCUSSION
Methods
Study Design and Participants
Participants were recruited from the ongoing annual prospective observational cohort study on influenza vaccination carried out at the University of North Carolina at Chapel Hill Family Medicine Center conducted by the Beck Lab during the 2014-2015 influenza vaccine year. The Family Medicine Center is an academic outpatient primary care facility in Chapel Hill, North Carolina. Recruitment criteria for this study were adults 18 years of age or older receiving the seasonal trivalent inactivated influenza vaccination (TIV).
Exclusion criteria were immunosuppressive diseases such as HIV, use of immunomodulatory or immunosuppressive drugs, acute febrile illness, history of Guillain-Barre syndrome, use of theophylline preparations, or use of warfarin.2 All recruitment, vaccine administration, sample collection, and personal information collection procedures were approved by the Biomedical Institutional Review Board of the University of North Carolina at Chapel Hill.
17
and the first blood draw was collected. After 30 days post-vaccination, the second blood draw was conducted. See subsequent Vaccination and Blood Draw section for the clinical protocol.
A group of 17 participants were recruited from the flu study to participate in this sub-study during the 2014-2015 year of the study. This group of participants were selected from the cohort participants for relative equality by race, gender, and obesity status. Eligibility assessment and recruitment was completed by phone. Study staff met eligible and interested individuals at the UNC Family Medicine Center, where participants were consented and provided with instructions and materials for the at-home stool collection. Upon completion of their sample collection, participants called and dropped samples off at the UNC Family Medicine Center.
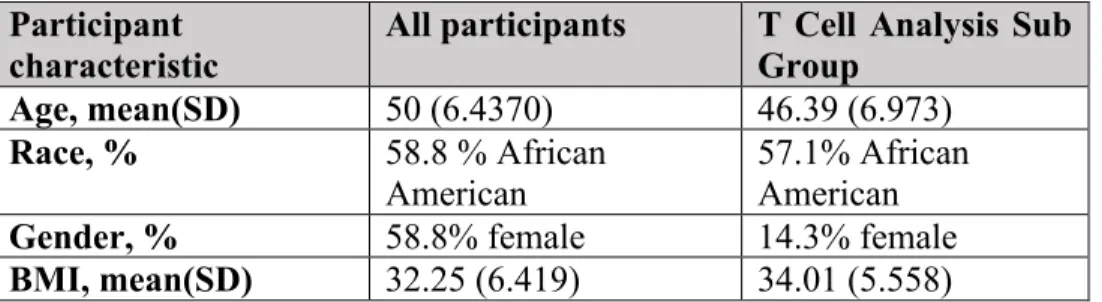
These participants were asked to provide a one-time stool. Race was dichotomized into African American and Caucasian. The study group was comprised 10 females (58.8% female), 10 African-Americans, (58.8% African American), 12 obese individuals, 1 non-obese overweight individual, and 4 lean individuals (70.6% obese). All participants had a serum sample used for analysis of antibody response, and a second second sample for perpipheral blood mononuclear cell isolation. A small 7-person group matched by age, race, and BMI was selected for exploratory T cell analysis on their blood samples. This T cell subgroup was comprised of 6 obese individuals (85.7% obese), 6 males (85.7% male), and 4 African American individuals (57.1% African American). Demographic information can be found in Table 1 and Table 2.
Participant
characteristic All participants T Cell Analysis Sub Group Age, mean(SD) 50 (6.4370) 46.39 (6.973)
Race, % 58.8 % African
American 57.1% African American
Gender, % 58.8% female 14.3% female
BMI, mean(SD) 32.25 (6.419) 34.01 (5.558)
18
of North Carolina at Chapel Hill Family Medicine Center conducted by the Beck Lab during the 2014-2015 influenza vaccination year.
Subject ID Number Sequencing ID Number Age (years) Sex (binary)
Race (binary) Body Mass Index (BMI)
T Cell Flow Cyt.
06_2104 s12 50 Female African
American 41.4 No
06_2133 s17 52.3 Female Caucasian 34.6 No
06_2135 s1 48.4 Female Caucasian 30.7 No
06_2152 s14 35.5 Female Caucasian 20.8 No
06_2157 s5 46.7 Female Caucasian 37.7 No
06_2180 s13 42.8 Male African
American
37.9 No
06_2192 s15 55.1 Male African
American 32.6 Yes
06_2226 s8 43 Male Caucasian 41.0 Yes
06_2229 s2 52.2 Female African
American
28.1 No
06_2230 s11 56.9 Female African American
31.6 No
06_2235 s9 42.2 Female African
American
22.6 No
06_2242 s10 34.8 Female African American
37.9 Yes
06_2243 s6 41.2 Female African
American 24.7 No
06_2278 s16 47.7 Male African
American
23.3 Yes
06_2325 s3 51 Male African
American
31.5 Yes
06_2392 s4 51.4 Male Caucasian 35.0 Yes
06_2469 s7 41.7 Male Caucasian 32.8 Yes
19
Vaccination and Blood Draw
One dose of the 2014-2015 trivalent inactivated influenza vaccine (0.5 ml Fluvirin; Novartis Vaccines and Diagnostics Limited, Basel, Switzerland) containing A/California/07/2009 H1N1, A/Texas/50/2012 H3N2, and B/Massachusetts/02/2012, was administered intramuscularly to the deltoid muscle, using a 1.5-inch needle.2 In addition to a pre-vaccination blood draw collected during the vaccination visit, the subjects were asked to return for a one-time blood draw one month (26-35 days) post-vaccination.2 Vaccination of participants took place from September 15, 2014 to October 28, 2014. Serum and peripheral blood mononuclear cells (PBMCs) were collected from each patient. Serum samples were stored at -80oC, and PBMCs were stored in liquid nitrogen until analyzed.
PBMC Stimulation
PBMCs were be thawed and cultured with Influenza A 2009 California pandemic strain, which was represented in the vaccine given to the study participants. Cells were cultured for 72 hours with stimulation by 20 µL of 5 µg protein/µL stock of live pandemic 2009 California Influenza A H1N1 virus (multiplicity of infection ~1) at 37oC in 5% CO
2. PMBC supernates were collected after 66 hours in culture and replaced with GolgiPlug (BD BioSciences) containing media.
T cell response using flow cytometry
20
fluorescence-activated cell sorter (FACS) staining fluorochromes for each different cell marker are shown in Table 3. Sample data were acquired using an Attune NxT (Thermo Fisher) flow cytometer and were analyzed with FlowJo (FlowJo LLC) analysis software and R.18 CD3+CD4+ and CD3+CD8+ cells were selected by gating the forward vs side scatter plot of the PBMC population.18 Cells were then analyzed for surface expression of CD69, and for intracellular expression of IFN-γ and GrB.18 An example gating strategy can be found in Figure 1. All marker-specific antibodies were titered to determine the most appropriate concentration to use in the flow cytometry panel.18 Single-stained cells and single-stained compensation beads for every fluorochrome were used as compensation controls. Autofluorescence was calculated and included in the compensation adjustments.
Marker Fluorophore Extra/intracellular Excitation Peak
Emission Peak
Attune Nxt
Laser Filter
Zombie Aqua Extracellular 405nm 512nm 405nm 512/25 CD3 AF700 Extracellular 637nm 720nm 637nm 720/30 CD8 AF594 Extracellular 561nm 620nm 561nm 620/15 CD4 PacificBlue Extracellular 405nm 550nm 405nm 440/50 CD28 AF488 Extracellular 488nm 520nm 488nm 530/30 CD69 BV711 Extracellular 405nm 780nm 405nm 710/50
GrB APC Intracellular 637nm 654nm 637nm 670/14
21
Figure 1. PBMC gating strategy for flow cytometry identification of T cell functionality.
Antibody response
22
The antibodies IgG1 (immunoglobulin 1), IgG2, IgG3, and total IgG was measured using enzyme-linked immunosorbent assay (ELISA). The samples were diluted and incubated in buffer in a pre-coated Falcon 96 well plate at 37oC for 2 hours. Anti IgG1, anti IgG2, and anti IgG3 conjugated to horseradish peroxidase was added to each well and incubated for 1 hour at 37oC. The plates were then washed with PBSt, and TMB substrate solution mix was added. PBSt is standard-phosphate-buffered saline (PBS) with Tween, a nonionic detergent emulsifier used to disrupt the plasma membrane for protein release. 3,3',5,5'-Tetramethylbenzidine (TMB) substrate solution is a visualizing agent in ELISA that detects horseradish peroxidase and changes from blue to yellow in response to low pH. After a brief final room temperature incubation, the reaction was stopped with 2M Sulfuric Acid. The absorbance of each well was measured at 450nm to characterize the amount of antibody present.
Stool Sample Collection and Sequencing
The participants in this study were requested to provide a stool sample during the 2014-2015 flu vaccine year. After participants dropped their stool sample at the UNC Family Medicine Center, they were picked up by study staff and transported to the Beck lab at the UNC Chapel Hill for storage at -80oC. Sample analysis was completed at UNC-Charlotte under the direction of Dr. Jennifer Weller in conjunction with Dr. Katie Meyer at UNC Chapel Hill. A similar protocol can be found in the CARDIA Study manuscript by Sun et al40 published by the Meyer Lab.
23
760ul Isopropanol/NaOAc at -20oC. A Qiagen column (QIAamp DNA Stool Mini Kit) was used to purify the genomic material. An E. coli positive control (100ng of genomic DNA in 200ul of low-TE buffer) and a buffer negative control were incorporated at this step. A NanoDrop 2000 machine was used to estimate the concentration and purity of the sample via 260/280 absorbance ratio.
The V3/V4 hypervariable regions were amplified (primers: 341F/785R)41 and index primers (Nextera XT Index Primers, Index 1 N7XX0, and Index 2 S5XX) were added in two subsequent polymerase chain reaction (PCR) runs. Run 1 cycle protocol: (95C 3min; 25 x (95oC for 30 sec, 55oC for 30 sec, 72o C for 30 sec), 72oC for 5 min, 4oC hold). Run 2 cycle protocol: (95oC for 3min; 8 x (95oC for 30 sec, 55oC for 30 sec, 72oC for 30 sec), 72oC for 5 min, 4oC hold). Ampure XP Beads were used for the PCR cleanup step after both runs. The NanoDrop 2000 was again used to yield and purity of the DNA. The 16S ribosomal RNA (rRNA) V3/V4 hypervariable regions were sequenced using the Illumina MiSeq platform.
16S raw sequence analysis
24
Linux. It then constructs the QIIME mapping file and conducts open reference OTU picking with the Silva database of conserved microbial 16S rRNA sequences. OTU picking was performed to generate abundances that corresponded to each OTU. Lastly it normalizes the data to mitigate differences in library sizes and generates OTU tables using R for statistical analysis. Rare / zero inflated taxa with zero counts greater than 25% of the sample size were removed from statistical consideration.
Variable Generation
The OTU abundances were normalized according to the methodology described in McCafferty et al and seen in Equation 1 below.42 The Vegan package in R was used to calculate the Shannon alpha diversity and richness for each individual at the phylum level. For Beta diversity, PCoA (principle coordinate analysis) based on a Bray Curtis dissimilarity matrix was generated to characterize inter-cluster variation between the groups of interest.
Equation 1. Normalization equation used on OTU outputs from open-reference picking. RC (number of raw counts in a given OTU), n (number of sequences in a sample), N (total number of samples), Σx (sum of the total number of counts in the OTU table).
Body mass index was calculated for each participant as weight in kilograms divided by height in meters-squared (kg/m2). Obesity was defined as a BMI greater than 30, overweight as a BMI from 25-29.9, and healthy weight as BMI of 18.5-24.9.
Inferential analysis
25
in the small sample size. Spearman correlation with each phylum level OTU was tested for BMI, IgG ELISA, HAI, and T cell flow cytometry data. Spearman correlation with phylum-level Shannon alpha diversity and richness was tested for BMI, IgG ELISA, HAI, and T cell flow cytometry data. For the BMI comparison with OTU, the data was subset by gender and race to address confounding. For comparisons done between gender and binary obesity and Shannon alpha diversity, a Wilcoxon rank sum test was used to generate a p-value. A significance level of α = 0.05 was used for these analyses. The Benjamini and Hochberg (BH) correction was used to generate false discovery rate (FDR) – adjusted p values as well, due to the large number of comparison conducted. In analyzing the adjusted p values, the significance level was increased to α = 0.1, because it is standard to increase the false discovery rate to 10% after FDR-adjustment. Bray Curtis Principle Coordinates Analysis (PCoA) were also run to analyze clustering based on body weight status and immune measures. Principle component analysis (PCA) was conducted as a second measure of clustering. PERMANOVA was not conducted due to a lack of clustering in the PCA.
Results
26
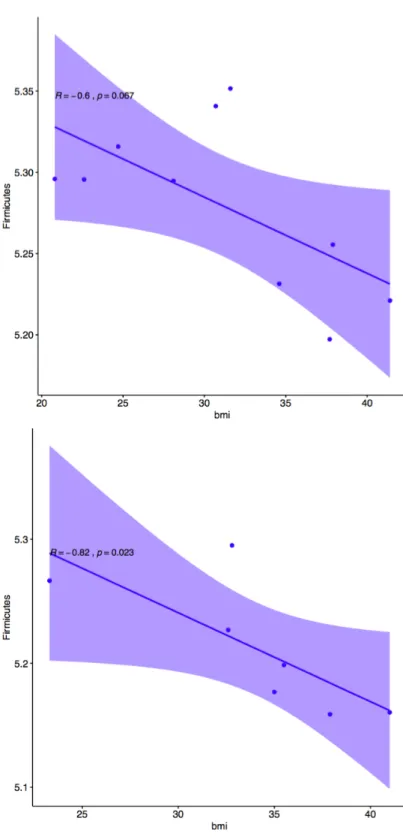
Body Mass Index Correlated with One Phylum Level OTU. The number of Firmicutes
OTUs was significantly correlated with body mass index (p = 0.004247, R = -0.76) as seen in Figure 2. This was contrary to the hypothesis that Firmicutes would increase in abundance as BMI increased. There was no observed change in the abundance of Bacteroidetes which was contrary to the hypothesis that Bacteroidetes OTUs would decrease with increased BMI. No other phyla were significantly correlated with BMI. After subsetting the data by gender and race to account for multiple predictors, it was determined that Caucasian participants had the highest amount of correlation in this comparison (p = 0.02519, R = -0.93), and the only significant correlation of all 4 subsets (African American p = 0.2109, R = -0.71), (male p = 0.1172, R = -0.82), (female p = 0.3334, R = -0.60). This method of accounting for the interaction between BMI and gender was stringent at this small sample size. Graphical correlation plots for the subset by race are found in Figure 3. Graphical correlation plots for the subset by gender are found in Figure 4.
27
28
29
30
Figure 5. Correlation plot (top) between Shannon alpha diversity and BMI (p = 0.0127). Wilcoxon rank sum (bottom) test comparing Shannon alpha diversity between obese and non-obese individuals (p = 0.0320). Both show diminishing Shannon alpha diversity of gut microbial flora with increased body mass.
B Cell Measures of Vaccine Response Correlated with BMI. BMI correlated positively
32
33
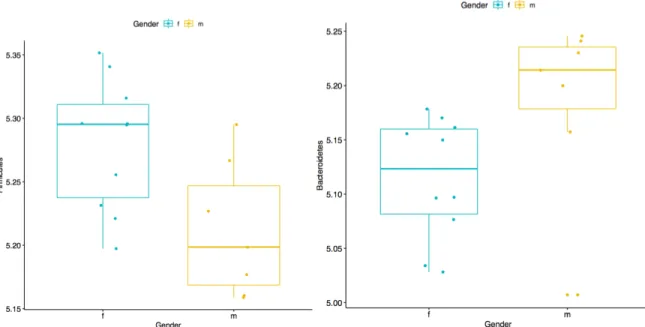
Firmicutes and Bacteroidetes OTUs differ with Gender. There were significant differences between Firmicutes (0.0811) and Bacteroidetes (0.03850) with gender as the binary stratification criteria. Males had lower abundance of Firmicutes and higher abundance of Bacteroidetes than females in the study population. No other microbial phyla had significant differences between genders.
Figure 7. Comparison of Firmicutes (top) and Bacteroidetes (bottom) phylum OTUs between gender. Male participants had a lower mean abundance of Firmicutes (p = 0.02811). Female participants had a lower abundance of Bacteroidetes (p = 0.03850).
Some OTUs Correlated with B Cell Measures. This is a notable finding, particularly in
34
36
37
B Cell Response not Correlated with Diversity. Neither Shannon alpha diversity nor richness at the phylum level were associated significantly with any of the IgG or HAI titer measures of the B cell response to the TIV or influenza virus.
T Cell response not Correlated with BMI. None of the T cell parameters designated in the functional panel gating strategy were significantly correlated with BMI in the study population.
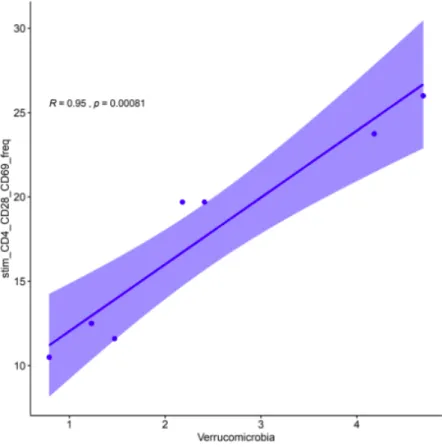
Some OTUs Correlated with T Cell Response. While the phylum Firmicutes, which is
39
Figure 9. Correlation plot between Actinobacteria (top) and the count of IFN-γ, GrB double-negative CD8+ cytotoxic T cells upon activation with influenza virus (p > 0.0001). Correlation plot between Patescibacteria (middle) and count of CD4+ helper T cells in unstimulated PBMCs (p = 0.04905). Correlation plot between Verrucomicrobia (bottom) and frequency of CD4+ CD28+ influenza activated helper T cells expressing CD69 (p = 0.0870).
40
41
OTUs did not Demonstrate Significant Clustering by Demographic, Body Mass, T Cell,
44
45
46
Figure 13. Biplot where individuals are plotted as points (e.g. S11) and the phyla are plotted as factors on the biplot to show which phyla contribute more to which individuals.
48
Figure 15. PCoA plot coloring by obese vs non-obese individuals (top), gender (middle), and median-stratified post-vaccination total IgG (bottom). None of the PCoA analyses yielded significant clustering after analyzing all dimensions.
Discussion
The tests in my analysis are designed to generate future hypotheses. In the bioinformatics analysis I conducted above, all tests are associative and therefore cannot prove mechanistic causation of any kind. This study offers the first reports of BMI – associated gut microbiota differences being associated with the humoral response to the influenza vaccination, which is promising for future studies.
BMI and the Immune Response to the TIV:
49
vaccination are measures of protection against the influenza virus. It is not true the obese individuals are more protected against the flu. Previous research in the Beck lab has shown B cell functionality to drop off significantly between one month and one-year post vaccination in obese individuals compared to healthy weight individuals. This means that obese individuals cannot sustain an influenza antibody response that lasts as long as healthy-weight individuals do after the TIV. Those with a diminished antibody response are more susceptible to infection and severe outcomes of infection.
Studies in Beck Lab have shown the adaptive immune system is impaired in response to influenza vaccination and infection. Despite vaccination, obese individuals are two times as likely to have influenza or influenza like illness.2 Further investigation identified T cells in obese individuals as the potential cause of impaired immune response. T cells from obese individuals express lower levels of activation markers CD69 and CD28 and lower levels of functional markers IFN-γ and Granzyme B.
None of the T cell parameters designated in the functional panel in this study were significantly correlated with BMI in the study population. This also contrasts previous research done in our lab which found notable impairment of T cell functional and metabolic function. This discrepancy is likely due to the small sample size of this investigation which could have made this study underpowered to detect smaller differences in flow cytometry data. Overall, my data suggest that the investigation should continue into obesity-related impairments of B cells and plasma cells.
BMI and the Gut Microbiota:
50
it is clear that amount of Firmicutes diminishes with increasing BMI. This contrasted with the hypothesis that the amount of Firmicutes would increase with BMI. It also contrasted the hypothesis that Bacteroidetes would diminish significantly with increasing BMI.
Normalized Shannon alpha diversity was correlated negatively with BMI according to Spearman’s correlation (p = 0.0127) such that Shannon alpha diversity decreases and BMI increases. Shannon alpha diversity is a measure of the intra-individual diversity of microbiota and accounts for differences in abundance and evenness. The normalized Shannon alpha diversity also differed significantly between obese and non-obese individuals according to a Wilcoxon Rank-sum test (p = 0.320). This contrasted the previous finding that obesity is associated with lower Shannon alpha diversity.
These results appear to further support the idea that according to the standard analytical and sequencing methods, there is an extreme lack of consistency in findings of association between BMI and any measures of the gut microbiota. This phenomenon could indicate a need for the development of smarter bioinformatics tools and more affordable and precise approaches to sequencing the gut microbiome. However, it could also indicate simply that obesity is highly variable in humans, and therefore has effects on the gut microbiota that are diverse in nature.
51
many recurring 97% matched 16S rRNA sequences were observed. However, this result could imply that in individuals with higher richness, more bacterial fragments and products could be permeating the gut, which could be caused by multiple potential factors. This would then result increased inflammation by causing visceral immune cells to secrete more pro-inflammatory cytokines. Richness was not found to be a function of BMI in this analysis however, but this should also be a direction for future research.
The Gut Microbiota and the Immune Response to TIV:
It is hypothesized that high fat diets cause increased intestinal permeability and increased translocation of bacterial components and their products which increases inflammation in the visceral adipose tissue.23 However, the mechanistic connections between specific gut microbiota and the immune components that are affected by the gut are poorly understood.39
52
In the relationship between BMI, the gut microbiota at the phylum level, and the humoral antibody response to the trivalent influenza vaccination, it is true that three factors are significantly correlated with each other. This data shows that there is a need for future investigation into the causal directionality of this interaction. This could be achieved by the use of a gnotobiotic mouse model where fecal samples from lean and obese individuals are transplanted and the mouse is analyzed for its immune response to influenza virus or the TIV immunization.
While the phylum Firmicutes, which is correlated with BMI and B cell response was not significantly correlated with the T cell response measured by flow cytometry, there were three other microbial phyla that were significantly correlated with the T cell response in the study population. Phylum Actinobacteria was significantly positively correlated with the number of CD8+ cytotoxic T cells that expressed neither IFN-γ (interferon gamma) nor GrB (granzyme B) upon stimulation with influenza virus (p > 0.0001). This implies that in our study population, gut microbiota states associated with higher OTUs of Actinobacteria are correlated with reduced expression of these functional cytokines that are necessary in the response to influenza virus. Additionally, the phylum Patescibacteria was significantly negatively correlated with the number of CD4+ helper T cells in unstimulated PBMCs (p = 0.04905). Lastly, phylum Verrucomicrobia was significantly correlated with the frequency of CD4+ CD28+ helper T cells expressing CD69 upon activation with influenza virus (p = 0.0870).
53 Conclusion and Other Future Directions:
54
BIBLIOGRAPHY
1. Flegal, K. M., Kruszon-Moran, D., Carroll, M. D., Fryar, C. D. & Ogden, C. L. Trends in obesity among adults in the united states, 2005 to 2014. JAMA 315, 2284–2291 (2016). 2. Neidich, S. D. et al. Increased risk of influenza among vaccinated adults who are obese. Int.
J. Obes. 41, 1324–1330 (2017).
3. Louie, J. K. et al. A novel risk factor for a novel virus: obesity and 2009 pandemic influenza A (H1N1). Clin. Infect. Dis. 52, 301–312 (2011).
4. Hruby, A. & Hu, F. B. The epidemiology of obesity: A big picture. Pharmacoeconomics 33, 673–689 (2015).
5. GBD 2017 Diet Collaborators. Health effects of dietary risks in 195 countries, 1990-2017: a systematic analysis for the Global Burden of Disease Study 2017. Lancet (2019).
doi:10.1016/S0140-6736(19)30041-8
6. Wright, S. M. & Aronne, L. J. Causes of obesity. Abdom Imaging 37, 730–732 (2012). 7. Arroyo-Johnson, C. & Mincey, K. D. Obesity Epidemiology Worldwide. Gastroenterol Clin
North Am 45, 571–579 (2016).
8. Gregor, M. F. & Hotamisligil, G. S. Inflammatory mechanisms in obesity. Annu. Rev. Immunol. 29, 415–445 (2011).
9. Alberti, K. G. M. M., Zimmet, P. & Shaw, J. Metabolic syndrome--a new world-wide definition. A Consensus Statement from the International Diabetes Federation. Diabet. Med. 23, 469–480 (2006).
10. Huttunen, R. & Syrjänen, J. Obesity and the outcome of infection. Lancet Infect. Dis. 10, 442–443 (2010).
11. Falagas, M. E., Athanasoulia, A. P., Peppas, G. & Karageorgopoulos, D. E. Effect of body mass index on the outcome of infections: a systematic review. Obes. Rev. 10, 280–289 (2009).
12. Charlton, M. R., Pockros, P. J. & Harrison, S. A. Impact of obesity on treatment of chronic hepatitis C. Hepatology 43, 1177–1186 (2006).
13. Sheridan, P. A. et al. Obesity is associated with impaired immune response to influenza vaccination in humans. Int. J. Obes. 36, 1072–1077 (2012).
14. Park, H.-L. et al. Obesity-induced chronic inflammation is associated with the reduced efficacy of influenza vaccine. Hum. Vaccin. Immunother. 10, 1181–1186 (2014).
55
16. Smith, A. G., Sheridan, P. A., Harp, J. B. & Beck, M. A. Diet-induced obese mice have increased mortality and altered immune responses when infected with influenza virus. J. Nutr. 137, 1236–1243 (2007).
17. Karlsson, E. A., Sheridan, P. A. & Beck, M. A. Diet-induced obesity impairs the T cell memory response to influenza virus infection. J. Immunol. 184, 3127–3133 (2010). 18. Paich, H. A. et al. Overweight and obese adult humans have a defective cellular immune
response to pandemic H1N1 influenza A virus. Obesity (Silver Spring) 21, 2377–2386 (2013).
19. Dou, D., Revol, R., Östbye, H., Wang, H. & Daniels, R. Influenza A virus cell entry, replication, virion assembly and movement. Front. Immunol. 9, 1581 (2018).
20. Hannoun, C. The evolving history of influenza viruses and influenza vaccines. Expert Rev. Vaccines 12, 1085–1094 (2013).
21. Kreijtz, J. H. C. M., Fouchier, R. A. M. & Rimmelzwaan, G. F. Immune responses to influenza virus infection. Virus Res. 162, 19–30 (2011).
22. Vidarsson, G., Dekkers, G. & Rispens, T. IgG subclasses and allotypes: from structure to effector functions. Front. Immunol. 5, 520 (2014).
23. Castaner, O. et al. The gut microbiome profile in obesity: A systematic review. Int J Endocrinol 2018, 4095789 (2018).
24. Qin, J. et al. A human gut microbial gene catalogue established by metagenomic sequencing. Nature 464, 59–65 (2010).
25. Dunn, A. B., Jordan, S., Baker, B. J. & Carlson, N. S. The maternal infant microbiome: considerations for labor and birth. MCN Am. J. Matern. Child Nurs. 42, 318–325 (2017). 26. Sekirov, I., Russell, S. L., Antunes, L. C. M. & Finlay, B. B. Gut microbiota in health and
disease. Physiol. Rev. 90, 859–904 (2010).
27. Cani, P. D., Osto, M., Geurts, L. & Everard, A. Involvement of gut microbiota in the development of low-grade inflammation and type 2 diabetes associated with obesity. Gut Microbes 3, 279–288 (2012).
28. Koliada, A. et al. Association between body mass index and Firmicutes/Bacteroidetes ratio in an adult Ukrainian population. BMC Microbiol. 17, 120 (2017).
29. Kasai, C. et al. Comparison of the gut microbiota composition between obese and non-obese individuals in a Japanese population, as analyzed by terminal restriction fragment length polymorphism and next-generation sequencing. BMC Gastroenterol. 15, 100 (2015). 30. Lin, S.-W. et al. Beta-diversity metrics of the upper digestive tract microbiome are
56
31. Finucane, M. M., Sharpton, T. J., Laurent, T. J. & Pollard, K. S. A taxonomic signature of obesity in the microbiome? Getting to the guts of the matter. PLoS One 9, e84689 (2014). 32. Ley, R. E., Turnbaugh, P. J., Klein, S. & Gordon, J. I. Microbial ecology: human gut
microbes associated with obesity. Nature 444, 1022–1023 (2006).
33. Turnbaugh, P. J. et al. An obesity-associated gut microbiome with increased capacity for energy harvest. Nature 444, 1027–1031 (2006).
34. Turnbaugh, P. J., Bäckhed, F., Fulton, L. & Gordon, J. I. Diet-induced obesity is linked to marked but reversible alterations in the mouse distal gut microbiome. Cell Host Microbe 3, 213–223 (2008).
35. Turnbaugh, P. J. et al. The human microbiome project. Nature 449, 804–810 (2007).
36. Oh, J. Z. et al. TLR5-mediated sensing of gut microbiota is necessary for antibody responses to seasonal influenza vaccination. Immunity 41, 478–492 (2014).
37. Zimmermann, P. & Curtis, N. The influence of the intestinal microbiome on vaccine responses. Vaccine 36, 4433–4439 (2018).
38. Tilg, H. & Kaser, A. Gut microbiome, obesity, and metabolic dysfunction. J. Clin. Invest. 121, 2126–2132 (2011).
39. Kau, A. L., Ahern, P. P., Griffin, N. W., Goodman, A. L. & Gordon, J. I. Human nutrition, the gut microbiome and the immune system. Nature 474, 327–336 (2011).
40. Sun, S. et al. Gut microbiota composition and blood pressure. Hypertension
HYPERTENSIONAHA11812109 (2019). doi:10.1161/HYPERTENSIONAHA.118.12109 41. Klindworth, A. et al. Evaluation of general 16S ribosomal RNA gene PCR primers for
classical and next-generation sequencing-based diversity studies. Nucleic Acids Res. 41, e1 (2013).