PILOT STUDY OF MENTAL HEALTH SYMPTOMS IN COLLEGIATE ATHLETES: THE INFLUENCE OF RESILIENCE ACROSS A COMPETITIVE SEASON
Megan Beth Simon
A thesis defense submitted to the faculty of the University of North Carolina at Chapel Hill in partial fulfillment of the requirements for the degree of Master of Arts in Department of Exercise and Sport Science (Athletic Training).
Chapel Hill 2019
Approved by: J.D. DeFreese
Johna Register-Mihalik Zachary Kerr
ABSTRACT
Megan Beth Simon: Mental Health Symptoms in Collegiate Athletes: The influence of resilience across a competitive season
(Under the direction of J.D. DeFreese)
Objectives: We explored associations between training load (TL) and mental health
symptoms (MHS) throughout a competitive season. Secondly, we examined resilience as an influencer on these associations. Participants: 114 student-athletes between 18-23 years old.
Methods: We measured MHS and resilience at 3 timepoints throughout a competitive season
TABLE OF CONTENTS
LIST OF TABLES ... vii
LIST OF FIGURES ... viii
LIST OF ABBREVIATIONS ... ix
CHAPTER I: INTRODUCTION ... 1
Purpose ... 4
Research Questions and Hypothesis... 4
CHAPTER II: REVIEW OF LITERATURE ... 5
Health and Well-Being in Athletes ... 5
Training Load ... 6
Physiological Response to Training ... 7
Internal Training Load ... 8
External Training Load ... 9
Total Training Load ... 10
Acute to Chronic Workload... 12
Mental Health Symptoms ... 13
Depression ... 14
Anxiety ... 17
Flourishing Mental Health... 20
Challenge versus Threat Appraisal ... 22
Resilience and Autonomic Flexibility ... 23
Measures of Mental Health, Resilience, and Training Load ... 24
Depression ... 25
Anxiety ... 26
Flourishing Mental Health... 26
Resilience ... 27
Training ... 28
Injury/Illness ... 30
Research Gap ... 31
Clinical Significance ... 31
CHAPTER III: METHODS ... 33
Participants ... 33
Power Analysis ... 34
Inclusion Criteria ... 34
Exclusion Criteria ... 35
Research Design ... 35
Procedures ... 36
Psychometric Questionnaires ... 36
Training Load ... 37
Injury Follow-Up... 38
Statistical Analysis ... 39
CHAPTER IV: RESULTS ... 40
Univariate Correlations ... 40
Depression ... 42
Anxiety ... 43
Flourishing Mental Health ... 44
CHAPTER V: DISCUSSION ... 46
Study Overview ... 46
Nonsignificant Findings ... 47
Resilience ... 50
Clinical Significance ... 50
Limitations ... 52
Future Research ... 53
Conclusions ... 54
LIST OF TABLES
LIST OF FIGURES
Figure 1 - Proposed Relationship Between Workload and Changes in Mental
Health Symptoms……….……5 Figure 2 - Moderating Effect of Resilience on the Relationship Between
Workload and Changes in Mental Health……….………...6 Figure 3 - Procedural Timeline.……….……….…...35 Figure 4 - Contour Fit Plot of the Moderating Effect of Resilience on the
LIST OF ABBREVIATIONS
ACWR Acute to Chronic Workload Ratio
CD-RISC-10 Connor-Davidson Resilience Scale-10 Questionnaire GAD-7 Generalized Anxiety Disorder 7-item Questionnaire HPA Hypothalamic Pituitary Axis
MHC-SF Mental Health Continuum-Short Form Questionnaire
MHS Mental Health Symptoms
PHQ-9 Patient Health Questionnaire 9-item Questionnaire RPE Rate of Perceived Exertion
sRPE Session Rate of Perceived Exertion
CHAPTER I: INTRODUCTION
Negative mental health symptoms, such as depression and anxiety, are most prevalent in the general population between the ages of 16-34 years old (Gulliver, Griffiths, Mackinnon, Batterham, & Stanimirovic, 2015). Generally, depression and anxiety symptoms include, feeling sad, empty, and hopeless, with diminished interest in almost all activities, and excessive fear or worry, among others (American Psychiatric Association., 2013). While depression and anxiety symptoms are prevalent in society, this does not necessarily indicate that adults are functioning positively and productively. Therefore, it is also essential to evaluate a person’s positive mental health, measured as flourishing mental health. Flourishing mental health can be defined as a state of positive mental functional performance and includes symptoms of positive feelings and adaptive functioning in individual life and community life (Keyes, 2002; Lamers, Westerhof, Ernst, Klooster, & Keyes, 2011). In alignment with extant holistic mental health research, we will investigate the multifaceted compilation of the symptoms associated with depression, anxiety, and flourishing mental health (Keyes, 2002; Rice et al., 2016).
Physically active individuals, such as athletes, have been shown to experience lower rates of negative mental health symptoms as compared to less active individuals (Gulliver et al., 2015). It can be posited, therefore, that collegiate student-athletes should experience less
1991; Yang et al., 2007). In a study conducted by the NCAA (2015), researchers found that approximately 25% of student-athletes felt depressed and approximately 40% of student-athletes felt anxiety (NCAA GOALS Study of the Student-Athlete Experience: Initial Summary of
Findings, 2016). Athletes may not be receiving the psychological benefits of exercise in part due to the exposure to stress, such as continual physical training, in competitive sport, which may increase their risk of experiencing negative mental health symptoms.
Generally, athletes must complete specific training cycles with periods of increased training and periods of recovery in order to enhance their performance (Soligard et al., 2016a). Recovery is an essential component to training cycles for athletes to regain vitality and reduce overall fatigue (DeFreese, Raedeke, & Smith, 2013; G Kenttä, 2002). Quantifying and
monitoring training is essential to confirm that athletes are adapting to their training and
recovering appropriately. Training loads are quantified via multiple components that correspond to the physical work of training (external load) and the perception of training (internal load) (Borg, 1982; Foster et al., 2001; Haddad et al., 2013; Soligard et al., 2016a). Internal training load is an individual’s response to training, which can be measured through heart rate variability, volume of oxygen consumption (VO2) values, blood variables, or a rating of perceived exertion
mechanism against injury (T. Gabbett, 2017; Huli et al., 2014). As training load varies
throughout a competitive season, measuring training load during the season will help clinicians better understand the amount of internal and external stress an athlete is facing and may then predict the mental health symptoms an athlete is experiencing.
To date, the relationship between training load and mental health symptoms remains unclear. One possible means to predicting adaptive or maladaptive outcomes following this physical stressor may be the intrapersonal characteristic of resilience. Resilience is a complex, dynamic process that involves how one adapts to adversity, with better adaptation reflecting higher resilience (Connor & Davidson, 2003). Due to the relationship between resilience and adversity, resilience may be essential to understanding negative mental health symptoms such as depression or anxiety, and subsequent reactions to stressful situations (Bonanno, 2008; Dray et al., 2017; Infurna & Luthar, 2016). Resilience has the potential to influence positive and negative mental health in many populations, but has been mainly explored in children or those who have experienced extreme trauma in their life (Sarkar & Fletcher, 2014). Resilience has been examined in sport mainly exploring its relationship to performance failure or qualitative interview studies to comprehend thoughts and feelings of athletes who have overcome adversity (Gail & Gonzalez, 2014).
As athletes experience different types of stressors throughout a season (such as academic requirements, numerous competitions, travel, and changing training load), it is important to identify whether resilience scores also vary over time throughout a competitive season.
her/his teammates and injury may affect mental health symptoms, injured athletes may be a confounding variable and therefore will be controlled for in all analyses. Better understanding the ways in which resilience influences mental health symptoms of depression and anxiety in otherwise healthy athletes may allow for better treatment and management of athletes struggling with these symptoms.
Purpose
The primary purpose of this study is to explore whether collegiate athletes’ mental health symptoms of depression, anxiety, and flourishing mental health are associated with training load over the course of a competitive season. A secondary purpose of this study is determining whether resilience act as a moderator of the relationship between training load and mental health symptoms of depression, anxiety, and flourishing mental health.
Research Questions and Hypothesis
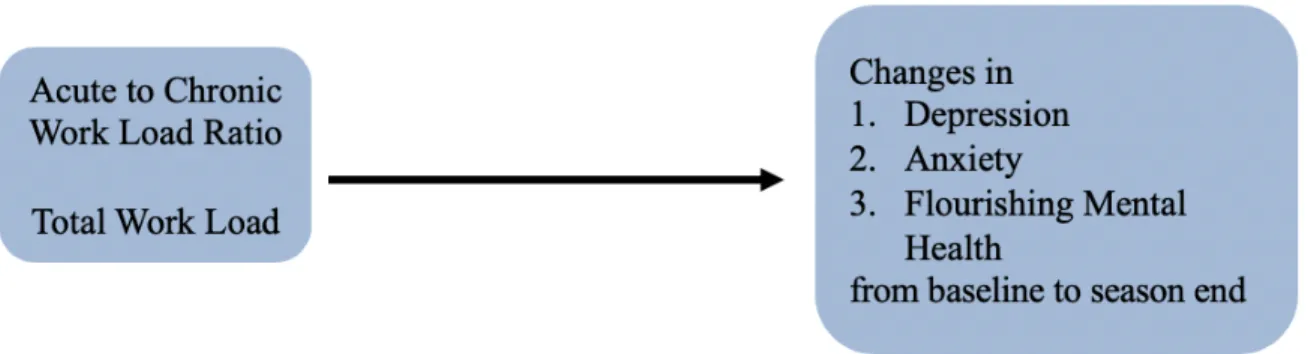
Research Question 1: What are the associations between training load and changes in mental health symptoms related to depression, anxiety, and flourishing mental health throughout a competitive season?
• Hypothesis 1: Individuals with a higher training load will tend to report greater increases in depression and anxiety scores as well as decreases flourishing mental health scores over time.
• Dependent variables: Mental health symptoms (depression, anxiety, and flourishing mental health symptoms) at all timepoints
Figure 1. Proposed Relationship Between Workload and Changes in Mental Health Symptoms
Research Question 2: Does resilience act as a moderator of the relationship between training load and changes in mental health symptom scores related to depression, anxiety, and flourishing mental health throughout a competitive season?
• Hypothesis 2: Individuals higher in resilience will tend to report the lowest increases in depression and anxiety scores as well as the lowest decreases in flourishing mental health scores with high training load.
• Independent variables: Total training load and acute to chronic workload ratios at all timepoints (baseline, 6 weeks, and 12 weeks), resilience scores
CHAPTER II: REVIEW OF LITERATURE
Health and Well-Being in Athletes
The World Health Organization (WHO) defines health as a state of physical, social and mental well-being (World health organization: Division of mental health and prevention of substance abuse., 1997). This indicates that these distinct factors of well-being are essential to maintaining positive functioning and overall health (Reinboth & Duda, 2006). One manner in which people aim to improve their health is through participation in athletics. Most athletes begin their participation in sport at a young age through deliberate play, a term that describes activities such as street hockey or pick-up basketball (Côté & Abernethy, 2007). This type of participation in sport is aimed at immediate gratification and pure enjoyment of the activity (Côté & Abernethy, 2007). As athletes age and become more elite, participation in athletics shifts towards more deliberate practice, emphasizing the need to achieve a future goal and improve overall performance (Côté & Abernethy, 2007). Research has indicated that many factors influence an athlete’s performance in their sport. In a study completed by Gould and colleagues (1999), researchers found that peak performance at the Olympic Games was influenced by a variety of physical, social, and psychological factors, such as high-quality training, coping skills for dealing with social distraction, and mental readiness (Gould, Guinan, Greenleaf, Medberty, & Peterson, 1999).
of well-being, nor the absence of mental illness and, as such, should be evaluated on a continuum (Keyes, 2002). Those with high levels of well-being are classified as maintaining flourishing mental health. Flourishing mental health can be recognized in individuals who function well socially and psychologically while being filled with positive emotion (Keyes, 2002). Those with low well-being and experiencing negative mental health symptoms are classified as having languishing mental health (Keyes, 2002). Languishing mental health is distinguished by feelings of emptiness and stagnation and may be accompanied with symptoms related to depression or anxiety (Keyes, 2002). If ignored, languishing mental health may manifest into maladaptive consequences such as clinical mental health disorders or physical injury. Ivarsson and colleagues (2013) found that anxiety and negative-life-event stress significantly predicted injury in Swedish professional soccer players. Additionally, Devantier and colleagues (2011) found that the best psychological predictors of injury severity were somatic anxiety and coping with adversity in Danish professional soccer players. Coaches and sports medicine clinicians aim to enhance the overall health of their athletes to promote performance in sport and positive functioning in society. To reach this goal, clinicians must optimize the athlete’s physical and mental health.
Training Load
performance as compared to baseline levels (Soligard et al., 2016a). Issues arise when athletes do not adapt to their training loads appropriately and can result in more serious conditions such as overtraining syndrome (Saw, Main, & Gastin, 2016). Overtraining syndrome is a condition where the patient experiences alterations in their physiological functioning and adaptations to training, dysfunction at the immune system level, biochemical changes, and impaired
psychological processing due to the inability to recover properly from their training (Halson & Jeukendrup, 2004). While often used interchangeably, overreaching is different from
overtraining (Halson & Jeukendrup, 2004). Overreaching is considered a normal outcome for elite athletes, allows for the possibility of the supercompensatory effect, and takes a relatively short time to recover from (approximately 2 weeks) (Halson & Jeukendrup, 2004). Overtraining syndrome often results in mood disturbances, symptoms similar to depression, and requires months to years of recovery time (Halson & Jeukendrup, 2004; Morgan, W P, Facsm D R, Raglin J S, O’Connor, P J, Ellickson, 1991; Saw et al., 2016). This demonstrates the importance of quantifying and monitoring training through more than a singular method.
Physiological Response to Training
Training load assessment is an essential component to improving performance as it focuses on the clinical features of muscle damage and fatigue in response to training.
Participation in sport and training results in acute fatigue and subclinical soft tissue damage (Fry, Morton, & Keast, 1991; Soligard et al., 2016a). Excessive participation in sport or lack of
fatigue including decreased range of motion, changes in neuromuscular factors, and increased muscle pain and soreness (Brownstein et al., 2017; Erickson et al., 2016; Frank, Gilsdorf, Goerger, Prentice, & Padua, 2014; Freehill et al., 2014; Nedelec et al., 2014; Reuther, Larsen, Kuhn, Kelly, & Thomas, 2016). All of these factors indicate the importance of monitoring training load to confirm that athletes achieve the appropriate recovery periods during training.
Internal Training Load
Internal training load is the physiological or perceptual response to training (Alexiou & Coutts, 2008; Soligard et al., 2016a). It can be measured through heart rate variability, VO2
values, endocrine and erythrocyte blood markers, and perceptual responses to training such as mood or perceived exertion (Saw et al., 2016). Internal training load can also be measured as rate of perceived exertion (RPE), as this assessment does not require training, is easy to use, and can be used across different sport scenarios (Alexiou & Coutts, 2008; Soligard et al., 2016a).
Additionally, researchers have found that humans are able to distinguish between sensations of effort and sensations of pain during exercise. In a study conducted by Pollak and colleagues in 2014, researchers injected metabolites that either evoked related or pain-unrelated sensations into skeletal muscle (Pollak et al., 2014). These metabolite injections were meant to mimic the sensations muscles experience during exercise yet, participants did not report perception of effort (Pollak et al., 2014). These results indicate that humans are able to
differentiate between sensations of pain and effort during exercise and that RPE is an accurate representation of perceived effort and not other sensations (Pollak et al., 2014).
Additionally, researchers have found significant relationships between changes in injuries during training and changes in perceived training intensity in semi-professional rugby league players and women’s collegiate basketball players (Anderson, Tripplett-McBride, Foster, Doberstein, & Brice, 2003; T. Gabbett, 2004; T. Gabbett & Domrow, 2007). Monitoring internal training load can also indicate the appropriate stimulus for ideal physiological adaptation to training (Soligard et al., 2016a). Additionally, it has been found that subjective well-being was negatively
correlated with internal training load (Saw et al., 2016). As measures of internal training load provide a quantitative assessment of psychological response to training, it is essential to
understand how internal load is related to markers of psychological health and flourishing mental health in athletes.
External Training Load
External training load is the physical work component of training or the external stimulus applied to the athlete which can be measured separately from their physiological response
is thought to be an early predictor of injury, monitoring these pitch counts can help to reduce the risk of injury in youth pitchers (Lyman et al., 2002). In a study by Olsen and colleagues,
researchers surveyed adolescent baseball pitchers who had elbow or shoulder surgery and pitchers who did not experience a significant pitching related injury (Olsen, Fleisig, Dun, Loftice, & Andrews, 2006). Results indicated that the surgical group had pitched significantly more months per year, games per year, innings per game, pitches per year, pitches per game, and warm-up pitches prior to a game (Olsen et al., 2006). In additional upper extremity research, Hulin and colleagues (2014) found that elite cricket fast bowlers with an external load training-stress balance of more than 200% had a 3.3 times greater risk for injury compared to those with an external load training-stress of 50-99% (Huli et al., 2014). These studies show that using external training load alone can be helpful for monitoring athlete health and risk of injury. In sum, internal training load is the physiological and perceptual response to training whereas external training load is the physical work component of training.
Total Training Load
External training loads are an important objective measure to combine with internal training loads to indicate total training load. These different portions of training programs provide a universal representation of what the body is experiencing and are likely associated to injury. Total training load can aid in detecting medical conditions, guide the amount of training prescribed to the athlete, and determine if there has been a decline in performance on a particular physical test (Saw et al., 2016).
relationship between total training load and injury risk (T. J. Gabbett et al., 2016; Soligard et al., 2016b). Gabbett (2017) describes the “Training-Injury Prevention Paradox” model. This model is the construct that athletes who are accustomed to high training loads actually have fewer injuries compared to athletes training at lower workloads. This construct, which can be measured via the acute to chronic work load ratio (ACWR), is based off evidence that it is more likely an inappropriate training program that causes non-contact injuries, not the amount of training completed by the athlete. Gabbett concludes through this work that an appropriately prescribed training program can improve an athletes overall fitness which could actually protect the athlete from injury (T. Gabbett, 2017).
While there is not much current research on the associations between training load and mental health symptoms, there have been some mental health changes observed in a condition known as over training syndrome (Aurélio, Peluso, Helena, & Guerra De Andrade, 2005). Overtraining syndrome is a condition where the patient experiences alterations in their
physiological functioning and adaptations to training, dysfunction at the immune system level, biochemical changes, and impaired psychological processing due to the inability to recover properly from their training (Halson & Jeukendrup, 2004). With overtraining syndrome, patients often experience associated mood disturbances, emotional lability, and depressive symptoms as well (Aurélio et al., 2005). In a seminal study examining over-trained swimmers, Morgan and colleagues (1987) found that these athletes experienced a significant increase in negative mood states during training (Morgan, Facsm, Raglin, O’Connor, & Ellickson, 1987). Interestingly, with a gradual tapering of training load prior to championship competition, athletes began to
reductions in training load (Saw et al., 2016). These studies show that these mood, depressive symptoms, and subjective measures are responsive to training load. (Saw et al., 2016)
Acute to Chronic Workload
The acute to chronic workload ratio (ACWR) is an outcome that models the relationship between the subjects current fatigue against their current fitness (Murray, Gabbett, Townshend, & Blanch, 2017). The overarching goal of acute to chronic workload ratio is to predict
performance or injury through the comparison to acute to chronic loads (Murray et al., 2017). Additionally, acute to chronic workload ratio has been utilized to predict injury, as high acute to chronic workload ratio ranges have been associated with an increased injury risk (T. Gabbett & Ullah, 2012). When studying elite cricket athletes, researchers found if the players acute to chronic workload ratio was less than or equal to 0.99 the likelihood of injury over the next week was approximately 4% (Huli et al., 2014). When the work load in the current week was 1.5 times greater than what the athlete was prepared for (i.e., ACWR greater or equal to 1.5) the risk for injury was increased by 2-4 times for the next week (Huli et al., 2014). In research on elite rugby athletes, Hulin and colleagues (2016) found that players who had acute to chronic workload ratios greater or equal to 1.6, increased risk of match injury by 3.4-5.8 times as compared to those with lower acute to chronic workload ratios (Hulin et al., 2016). Furthermore, the appropriate training load can provide a protective mechanism against injury (T. Gabbett, 2017; Malone et al., 2017; Windt & Gabbett, 2017). Malone and colleagues (2016) found that
increased risk for physical injury, but moderate acute to chronic workloads are associated to decreased risk for injury. Previous research has shown that when athletes are injured, they experience increases in negative mental health symptoms (Appaneal et al., 2009; Rice et al., 2016).
Mental Health Symptoms
Mental health symptoms are largely encompassing of both positive and negative states. These negative states include depressive symptoms, hyperactivity, obsessive-compulsive symptoms, or symptoms related to anxiety. Whereas positive states may include positive relationships, self-acceptance, and personal growth (American Psychiatric Association., 2013; Keyes, 2002). Mental health symptoms refer to the multifaceted compilation of the symptoms associated with depression, anxiety, and flourishing mental health (American Psychiatric
Association., 2013; Junge & Feddermann-Demont, 2015; Keyes, 2002; Rice et al., 2016). While the majority of the general population will never be clinically diagnosed with negative mental health disorders, this does not mean that the large majority of the population is without mental health symptoms that affect their normal day to day functioning (Keyes, 2002). An individual experiencing mental health symptoms may not necessarily be clinically diagnosed with
Depression
The prevalence of depression symptoms in collegiate athletes has been reported to be approximately 25%, but this number may be lower than expected as it has been determined that depression is under recognized in athletic settings (Appaneal et al., 2009; NCAA GOALS Study of the Student-Athlete Experience: Initial Summary of Findings, 2016; Trojian, 2016). Yet, in a recent study completed by the NCAA (2015), researchers stated that about 30% of student-athletes report that they have felt significantly overwhelmed (NCAA GOALS Study of the Student-Athlete Experience: Initial Summary of Findings, 2016). Additionally, approximately 33% of student-athletes struggled to find energy which they attributed to the physical demands of athletic participation and 25% reported exhaustion from the mental demands of their sport
(NCAA GOALS Study of the Student-Athlete Experience: Initial Summary of Findings, 2016). Predictors of depression in collegiate student-athletes include low self-esteem, decreased social connectedness, sleep, and gender (Trojian, 2016). Researchers have also found that injured athletes have significantly higher symptoms of depression as compared to uninjured athletes (Appaneal et al., 2009; Gulliver et al., 2015). Given the prevalence of depression in athletes and the implications of injury on depression levels in athletes, it is essential that clinicians are able to recognize the signs and symptoms of depressive disorders (Trojian, 2016).
screening for depressive symptoms prior to and throughout athletic participation should be utilized so that the overall health of the athlete is being monitored continuously (Trojian, 2016).
Previous research related to depression in athletes has typically focused on prevalence, risk factors, and the relationship between depression and injury. As previously stated the
prevalence of depression in collegiate athletes is around 25% (Armstrong, 2007; NCAA GOALS Study of the Student-Athlete Experience: Initial Summary of Findings, 2016; Yang et al., 2007). This prevalence is comparable to that of the general population (Appaneal et al., 2009; Gulliver et al., 2015; Radloff, 1991; Yang et al., 2007). Risk factors that have been previously researched in athletes include, low levels of social connectedness, low self-esteem, gender, collegiate class, and performance failure (Armstrong, 2007; Hammond, Gialloreto, Kubas, & Davis, 2013; Yang et al., 2007). In a study by Armstrong and colleagues (2007), researchers found a negative relationship between self-esteem and depression in collegiate athletes (Armstrong, 2007). This study also found a significant negative relationship between athlete social connectedness and depression (Armstrong, 2007). Yang and colleagues (2007) found that female student-athletes were at 1.3 times greater risk of experiencing depression symptoms as compared to male student-athletes (Yang et al., 2007). These researchers also found that collegiate freshman were 3 times more likely to experience symptoms of depression as compared to any other collegiate class (Yang et al., 2007). Additionally, in a study involving elite swimmers, Hammond and colleagues found a positive correlation between depression symptoms (scored on the DSM-IV) and
performances slower than their personal best times (Hammond et al., 2013).
competitive athletes utilizing the Center for Epidemiological Studies Depression (CES-D) Scale and the semistructured interview guide for the Hamilton Rating Scale for Depression (SIGH-D) (Appaneal et al., 2009). Analyses via a repeated measures design showed a significant main effect for time indicating that depression symptoms decreased over time after the initial injury incident. Additional analyses showed a significant interaction for injury group and time showing that the injured group experienced increased depression symptoms as compared to the uninjured group (Appaneal et al., 2009).
Finally, there is a plethora of research related to depression in athletes and its relationship with concussion. This research has indicated that athletes who experience concussions or their related syndromes often will experience depression throughout their recovery or later in life (Kerr, Evenson, et al., 2014; Kontos, Covassin, Elbin, & Parker, 2012). Kerr and colleagues found that former collegiate athletes who reported 3 or more concussions in total were 2.4 times more likely to experience moderate to severe depression as compared to former collegiate athletes who reported zero concussions (Kerr, Evenson, et al., 2014). Additionally, a study conducted by Kontos and colleagues demonstrated that concussed athletes displayed
There is limited research related to depression and athlete’s training load. Most existing research in this realm is related to overtraining syndrome. As previously defined, overtraining syndrome is a condition where athletes experiences alterations in their physiological functioning, dysfunction at the immune system level, biochemical changes, and impaired psychological processing due to the inability to recover properly from their training (Aurélio et al., 2005; Halson, 2014). This often presents with frequent infections and depression in athletes with this condition and requires significant rest to allow full recovery (Budgett, 1998). While it is important to understand the implications of overtraining syndrome and its relationship to depression symptoms, most athletes will respond to their training appropriately and not be diagnosed with overtraining syndrome. Yet, they may still experience depressive symptoms. An aim of the current research is to better understand the relationship between training load and depressive symptoms.
Anxiety
Generalized Anxiety Disorder is prevalent in approximately 6% of the general population but more of the population experiences symptoms related to anxiety (Spitzer, Kroenke, Williams, & Löwe, 2006). While anxiety disorders are often measured concurrently with depression
strikingly, a study conducted by the NCAA reported that on average 40% of student-athletes stated they felt anxiety (NCAA GOALS Study of the Student-Athlete Experience: Initial Summary of Findings, 2016). This prevalence of anxiety symptoms is relatively similar to the general population, yet much greater for collegiate student-athletes. Research by Gulliver and colleagues (2015) also found that the presence of injury predicted anxiety symptoms. In a recent study of elite Swiss soccer players, researchers found the average anxiety scores to be similar to the general population for both males and females (Junge & Feddermann-Demont, 2015). As these levels of clinical anxiety in athletes are comparable to its prevalence in the general population, it is very important to recognize the signs and symptoms of anxiety.
Anxiety disorders tend to have many overlapping qualities as they differ based on the types of situations or objects that induce fear, avoidance behavior, or anxiety (American Psychiatric Association., 2013). Key symptoms of anxiety include physical symptoms of increased heart rate, restlessness, difficulty concentrating or mind going blank, being easily fatigued, irritability, sleep disturbance, sweating or muscle tension (American Psychiatric Association., 2013). Cognitively, those with anxiety symptoms face persistent and excessive worry about various domains and fear about what could happen (American Psychiatric Association., 2013).
contrast, athletes with negative reactions to imperfection showed a positive correlation to competitive anxiety and a negative correlation to self-confidence (Hamidi & Besharat, 2010). Additional anxiety research shows associations between anxiety disorders and eating disorders in athletes (Hausenblas & Mack, 1999; Vardar, Vardar, & Kurt, 2007). In research conducted by Vardar and colleagues (2007) researchers found that disordered eating athletes experience significantly increased state anxiety as compared to a normal eating habits group (Vardar et al., 2007). While competitive anxiety is an important construct to understand in the context of athletics, limited research exists related to collegiate athletes and symptoms related to non-competition-specific anxiety.
Flourishing Mental Health
While depression and anxiety symptoms do have a prevalence in society, this does not necessarily indicate that adults free of mental illness are functioning positively and productively. Therefore, it is essential to evaluate a person’s positive mental health by determining if they have flourishing mental health. Flourishing mental health can be defined as a state of positive mental functional performance and positive feelings (Keyes, 2002). Those with flourishing mental health experience, as examples, positive relationships, purpose in life, independent functioning, self-acceptance, self-esteem, personal growth, and comfort in one’s environment, and positive emotions (Keyes, 2002).
Previous research related to flourishing mental health in athletes has focused on adaptive types of motivation and the effect of career-ending injuries (Blanchard, Amiot, Perreault,
Vallerand, & Provencher, 2009; Kleiber & Brock, 1992; Reinboth & Duda, 2004). In research on high school aged basketball players, Blanchard and colleagues (2009) found that self-determined motivation predicted positive emotions and satisfaction each of which are essential components of flourishing mental health (Blanchard et al., 2009). Reinboth and colleagues (2006) found that athlete autonomy, or the feeling that one is the initiator of one’s own actions and the experience of making one’s own choices, was the strongest predictor of flourishing mental health in terms of the athletes motivation (Reinboth & Duda, 2006). In a separate study Reinboth and Duda (2004) found that athlete’s self-esteem, an essential component of flourishing mental health, was
positively predicted by motivational situations that focused on task mastery and learning and also by perceived ability (Reinboth & Duda, 2004). In a study conducted by Kleiber and Brock
psychological well-being than those who did not in the 5 to 10 years following their retirement from sport (Kleiber & Brock, 1992).
While the relationships between flourishing mental health with adaptive types of
motivation and career-ending injuries are important to understand, they are only a small scope of the potential stressors student-athletes may face that effect their flourishing mental health. Student-athletes who have the ability to function positively and productively will translate this functioning to their life inside and outside of their respective sports. As sports medicine clinicians aim to provide their athletes with positive health related quality of life, it is essential that clinicians gain a deeper understanding of the relationship between flourishing mental health and training load.
Resilience
Resilience broadly is defined as the ability to thrive in the face of adversity or stress (Campbell-Sills & Stein, 2007; Luthar, Cicchetti, & Becker, 2000). The concept of resilience encompasses the effects of protective and promotive factors to aid in adaptation which will vary situationally and across one’s lifespan (Fletcher & Sarkar, 2013). An individual may react positively to stressors at one point in their life, demonstrating high resilience but, this does not guarantee that they will react the same way to stressors at other points of their life (Fletcher & Sarkar, 2013). Resilience can be broken up into two factors including hardiness, which is considered the dispositional or static component of resilience, and persistence, which is
ability to achieve goals despite impediments, giving one’s best effort no matter what, working to attain goals despite difficulty, and not giving up in the moment of adversity/stressor (Fletcher & Sarkar, 2013).
Within this dual process, an individual possesses a particular level of hardiness that aids in management of stressors throughout their lifetime, but their level of persistence may vary throughout their life resulting in changes in their ability to thrive when faced with stressors (Fletcher & Sarkar, 2013). To support that resilience is a dynamic process, it is key to note that resilience has been found to be modifiable in patients. Dray et al. (2017) concluded from a meta-analytical review that resilience-focused interventions (i.e., training students to utilize the characteristics of resilient people when faced with adversity) were effective in reducing
depressive symptoms, and general psychological distress (Dray et al., 2017). This suggests that resilience is dynamic process that one is able to learn and utilize when faced with adversities. Moreover, resilience-focused interventions may provide short-term reduction in depressive and anxiety symptoms in young people (Dray et al., 2017). Resilience is a concept involving dispositional and situational components. The current research aims to explore resilience specifically as this dynamic process and its influence on mental health symptoms.
Challenge versus Threat Appraisal
When faced with stressors, those who are more resilient tend to appraise the stressor differently than those who are less resilient (Blascovich, 2008). Those who have lower resilience scores may appraise adversity as a threat (Seery, 2011). Those who have higher levels of
thrive by utilizing a challenge appraisal approach. Determining if an athlete appraises a stressor as a challenge or a threat may help the athlete to act more resiliently.
Resilience and Autonomic Flexibility
Once an individual appraises a stressor as a challenge, there is a specific physiological framework of autonomic flexibility observed in people with high resilience and those with low resilience. Autonomic flexibility involves the capacity of the parasympathetic nervous system to adapt to changes in circumstance by modifying arousal, respiration, heart rate, and attention (Kok & Fredrickson, 2010). When a stressor is experienced, the sympathetic nervous system is activated resulting in sympathetic-adrenomedullary (SAM) activation in all individuals
(Blascovich, 2008). Those with low resilience interpret the stressor as a threat, then experience greater hypothalamic pituitary axis (HPA) activation. HPA activation increases release of the stress hormone cortisol, resulting in inefficient use of internal resources and maladaptive consequences (Seery, 2011).
Those with high resilience experience greater sympathetic-adrenomedullary (SAM) activation, causing a release in epinephrine and vasoconstriction (Blascovich, 2008). This
these cognitive responses include prolonged psychosocial health, cognitive performance, and cardiovascular health (Kok & Fredrickson, 2010). As those with high resilience have faster physiological recovery to stressors, it is important to understand how resilient athletes recover from the stressor of training. With positive outcomes such as these, it is clear that having higher levels of resilience is beneficial to overall health and mental well-being, especially in our at-risk population of student-athletes.
Previous research has indicated that athletes experience a similar prevalence of mental health symptoms to that of the general population (Gulliver et al., 2015; Junge & Feddermann-Demont, 2015; Schaal et al., 2011). Training load is a consistent stressor athletes face that is distinct from the general population’s experiences, which motivates the current research to examine the associations between mental health symptoms and training load. When exposed to stressors, those with high resilience display faster and more efficient physiological recovery (Blascovich, 2008). The current research will also explore if resilience influences the association between training load and mental health. Gaining a deeper understanding of these associations will improve screening and management strategies of athletes experiencing negative mental health symptoms related to depression and anxiety.
Measures of Mental Health, Resilience, and Training Load
resilience. Finally, training load will be assessed daily utilizing a session-RPE method. Details of these measures are elaborated on below including how subjects will be asked to respond and their respective validities.
Depression
The Patient Health Questionnaire (PHQ-9) has been utilized in mental health assessment of the general population, but its use in athletes has been documented mainly as the relationship between depression and concussion (Kerr, Defreese, & Marshall, 2014; Trojian, 2016). The PHQ-9 is a diagnostic tool that can be utilized in mental health assessment but it is not the only piece required for a clinical diagnosis of depression. The PHQ-9 assesses depressive symptoms that can accumulate to display minor to major depressive symptoms that have occurred over the previous two weeks. The questionnaire includes items such as, “Over the last 2 weeks, how often have you been bothered by any of the following? Little interest or pleasure in doing things” or “Feeling tired or having little energy”. This psychometric also assesses the severity and
demonstrating that this short questionnaire would be effective to utilize in an efficient clinical environment (El-Den et al., 2018; Kroenke et al., 2001).
Anxiety
Anxiety is typically measured through the Generalized Anxiety Disorder 7-item (GAD-7) assessment, although the GAD-7 cannot diagnosis clinical anxiety independently. The GAD-7 consists of 7 items rated on a Likert scale of 0-3 where 0 is analogous to “Not at all” and 3 is “Nearly every day” (Spitzer et al., 2006). The questionnaire includes items such as, “Over the last 2 weeks, how often have you been bothered by the following problems? Being so restless that it's hard to sit still” or “Not being able to stop or control worrying”. Scores on the GAD-7 can help to classify the level of anxiety faced by the patient, where 5 points indicates mild anxiety, 10 points indicates moderate anxiety, and 15 points indicates severe anxiety (Spitzer et al., 2006). The GAD-7 was found to have good convergent validity when assessed with the Beck Anxiety Inventory (r=0.72) and the anxiety subscale of the Symptom Checklist-90 (r=0.74) (Spitzer et al., 2006). Additionally, the GAD-7 demonstrated strong construct validity and high criterion validity for identifying cases of GAD in subjects 18 years old and up (Spitzer et al., 2006). Additionally, researchers have previously demonstrated acceptable internal consistency reliability of the GAD-7 in athletic populations (Fraser et al., 2016). These results indicate that the GAD-7 is a valid and efficient screening tool for generalized anxiety disorder which could be utilized in a sports medicine environment (Keyes, 2002).
Flourishing Mental Health
the following questions are about how you have been feeling during the past month. Place a
check mark in the box that best represents how often you have experienced or felt the following:
That you had warm and trusting relationships with others” or “That your life has a sense of
direction and meaning to it”. Responses are rated on a scale from 0 (reflecting “none of the time”) and 5 (reflecting “all of the time) (Keyes, 2002; Petrillo, Capone, Caso, & Keyes, 2015). These scores are summed across all questions with a maximum score possible of 70 with high scores reflecting flourishing mental health and low scores indicating languishing mental health. Assessment of the MHC-SF in subjects 18 years old and up revealed subscales had good internal reliability (alpha = 0.89) and moderate test-retest reliability suggesting that MCH-SF is stable over time and sensitive to change (Lamers et al., 2011). Finally, the MHC-SF has good convergent validity suggesting that it can be utilized as a valid measurement of flourishing mental health (Lamers et al., 2011).
Resilience
There are multiple scales that can be utilized to measure resilience scores as a dynamic process. One such scale is the Connor-Davidson Resilience Scale-10 or CD-RISC-10. The content of this scale was developed off various constructs related to resilience developed by previous researchers (Connor & Davidson, 2003). Content of this scale includes items such as, “Able to adapt to change” and “Can handle unpleasant feelings” and is rated on a scale of 1 (not true at all) to 5 (true nearly all of the time) (Campbell-Sills & Stein, 2007). A maximum score of 50 reflects someone who portrays highly resilient qualities. This version of the scale was
constructs, ranging from .39 to .80, all ps < .001) (Campbell-Sills & Stein, 2007; Ehrich, Mornane, & Powern, 2017). Additionally, the CD-RISC-10 focuses on the hardiness and
persistence factors of resilience and eliminates extraneous concepts that are not necessary in the evaluation of an individual’s resilience (Campbell-Sills & Stein, 2007). Results of analyses from Campbell-Sills and Stein (2007) suggest that CD-RISC-10 measures characteristics that
differentiate individuals who are thriving after adversity from those who are not (Gonzalez, Moore, Newton, & Galli, 2016). Furthermore, Gonzalez and colleagues (2016) found initial psychometric evidence for the use of the CD-RISC-10 in athletes through a sample of competitive American distance runners (Gonzalez et al., 2016).
Training
Measuring training via training load can be broken up into three different categories, internal training load, external training load, and total training load. Internal training load can be measured via rate of perceived exertion (RPE). RPE was designed to reflect the intensity of activity on a scale from 6-20, where 6 would correlate with “nothing at all” and 20 would related to “very, very hard” (Borg, 1982). The range from 6-20 was expected to predict changes in heart rate ranging from a resting 60 to a maximal 200 beats per minute (Borg, 1982). RPE is now typically measured on a 0 to 10 point scale where 0 would indicate “rest” and 10 would indicate “maximal effort”. The 0 to 10 RPE scale reflects only the intensity of an exercise and not the generalized fatigue and stress perceived before the beginning of training (Foster et al., 2001; Haddad et al., 2013).
Chitwood, Beason, & Mclemore, 1996b; M. J. Chen et al., 2016; Coutts, Rampinini, Marcora, Castagna, & Impellizzeri, 2009; Stoudemire et al., 1996). Maximal oxygen consumption during exercise, known as VO2max, has been shown to be an extremely valid measure of fitness (Brown
et al., 1996b; Brown, Chitwood, Beason, & Mclemore, 1996a). In addition, %VO2max is highly
correlated with heart rate (Hall, Macdonald, Maddison, & O’Hare, 1998). In a meta-analysis examining the correlation between RPE and %VO2max, researchers found a moderate to strong
correlation (mean r with Fischer’s z transformation = 0.64) between the two variables (M. J. Chen et al., 2016; Wilmore et al., 1985). This indicates that RPE can reflect oxygen consumption during physical work. Another physiological change that has been found with exercise is blood lactate levels (Stoudemire et al., 1996). Blood lactate concentration is an objective measure of exercise intensity at a local level (Stoudemire et al., 1996). Researchers have found a moderate correlation between RPE and blood lactate concentration (M. J. Chen et al., 2016; Kolkhorst, Mittelstadt, & Dolgener, 1996; Ljunggren, Ceci, & Karlsson, 1987). Heart rate is an additional physiological indicator of physical work. Initially formatted to match changes in heart rate, the RPE scale was found to have a moderate to strong correlation with heart rate (mean r1 = 0.58 and
mean r2 = 0.62) (Borg, 1982; M. J. Chen et al., 2016; Ljunggren et al., 1987; Mackinnon, 1999).
Respiration rate, or breathes per minute, has been considered the most effective physiological measure of oxygen consumption due to different amounts of oxygen being inspired at various testing environments (M. J. Chen et al., 2016). Respiration rate has the strongest correlations of measures of oxygen consumption at mean r1 = 0.67 and mean r2 = 0.72 indicating a strong
correlation (M. J. Chen et al., 2016). These correlations to physiological responses to
External Training Load is typically measured by quantifying the load from training and competition (Soligard et al., 2016b). This quantification can occur in many ways such as the hours of training, distance run, weight lifted, number/intensity of sprints, jumps, pitches thrown or collisions (T. J. Gabbett et al., 2016; Soligard et al., 2016b). Measuring external training load gives the clinician an objective understanding of the total work completed by the athlete
(Soligard et al., 2016b). In this study, external training load will be measured through minutes of training.
Total training load is the product of internal training load and external training load, which is often measured as session RPE (sRPE) (Soligard et al., 2016b). Total training load can also be quantified via total training load and the acute to chronic work load ratio (ACWR). Total training load is the sum of training load over a specific duration of time. For the acute to chronic workload ratio, the acute or rolling 7-day work load accounts for current fatigue measures whereas the rolling 28-day workload measures the current fitness aspect of this model (Banister & Calvert, 1980; Huli et al., 2014).
Injury/Illness
Research Gap
Keyes (2002) proposed that mental health fluctuates on a continuum from flourishing mental health, involving positive emotion and productive relationships, to languishing mental health, involving symptoms that are associated with depression and anxiety (Keyes, 2002). Current research has indicated a near equivalent prevalence of negative mental health symptoms in athletes as compared to the general population (Gulliver et al., 2015; Junge & Feddermann-Demont, 2015; Rice et al., 2016; Yang et al., 2007). But, the existing research related to the potential causes of mental health symptoms in the athletic population is lacking. There has yet to be research connecting the relationships between the mental health continumm, training load stressors, and resilience in an athletic population. The current study will emphasize monitoring training load before an athlete experiences injury and is at increased risk for negative mental health symptoms. Further conceptual understanding of these relationships is essential for a variety of clinical reasons. Understanding these relationships may help sports medicine clinicians predict when their athletes are at increased risk for negative mental health symptoms and allow them to refer to sports psychologists at more opportune times. Once the relationships between mental health symptoms, training load, and resilience are better understood through the context of this study, future research could aim to understand what specific aspects of a college student-athletes life increases negative mental health symptoms most significantly.
Clinical Significance
external stressors that elite athletes face, symptoms of depression and anxiety often are under-recognized in the sporting population (Trojian, 2016). One constant stressor athletes face is that of training. Training loads are known to vary throughout an athletic season, typically with a bolus of training during pre-season and tapering during regular season play. While current research demonstrates that high acute to chronic workload ratios have been associated with an increased injury risk, there is little existing research on the associations between training load, mental health symptoms, and resilience.
Although there is current research on resilience in the general population, such as those dealing with long term diseases, children who have experienced trauma, and the military, there are few current studies that examine resilience in elite athletes (Bonanno, 2008; Dray et al., 2017; Infurna & Luthar, 2016). More resilient athletes should appraise training load stressors as a challenge as opposed to a threat, which will enhance the probability in a more adaptive
psychophysiological response (Blascovich, 2008). Coaches may benefit from this research by gaining a deeper understanding of how their athletes respond to the stress of training and the potential negative effect that training loads have on their athletes’ overall physical and mental health. Sports medicine professionals will benefit from the current research as they will gain perspective on athletes’ mental health throughout a competitive season. The current research will provide a deeper understanding of athletes’ mental health and will aid in patient-centered,
CHAPTER III: METHODS
Participants
A total of 160 NCAA Division I athletes were recruited (age 18-23 years old) as a convenience sample from the University of North Carolina at Chapel Hill Varsity Volleyball, Field Hockey, Women’s Soccer, Men’s Soccer and Men’s Lacrosse teams during their Fall 2018 training. Rosters of each team contained the following number of athletes: volleyball n=15; field hockey n=28; women’s soccer n=30; men’s soccer n=36; and men’s lacrosse n=51. Participants were selected to represent a targeted group of male and female athletes competing in both contact and non-contact sports. Participants were informed of the requirements for full
participation in the study through their sports medicine staff. Each participant signed an informed consent approved by the university’s Institutional Review Board.
By timepoint 3, we experienced a 28.8% attrition rate, resulting in an n of 114.
Power Analysis
A power analysis for between-factors repeated measures analysis of variance (ANOVA) using G*power software indicated a sample size of 78 participants. Data was analyzed as between-factors as this study examined the influence of training load and resilience on mental health symptoms. The type of power analysis utilized was a priori, as there was no pilot study data to conduct the power analysis. Extant literature involving repeated measures on post injury depression in athletes was utilized to determine effect size, which was set at 0.16 (Appaneal et al., 2009). The alpha value was allowed to remain at .05. Resilience will be incorporated into this model as a predictor but, it will solely act as a secondary moderator. Data was collected at 3 timepoints across a competitive season, at pre-season screening (+1 week) as well as at approximately 6 weeks (range of 5-7 weeks) into the season, and 12 weeks (range of 11-13 weeks) into the season. It is an assumption of repeated measures analyses of variance that observations at each timepoint are not correlated. Due to the potential attrition associated with longitudinal designs, we recruited 160 participants, approximately 2x more than the required power analysis.
Inclusion Criteria
Exclusion Criteria
Subjects were excluded from participation if they are uncomfortable completing regular questionnaires related to mental health symptoms (n=0).
Research Design
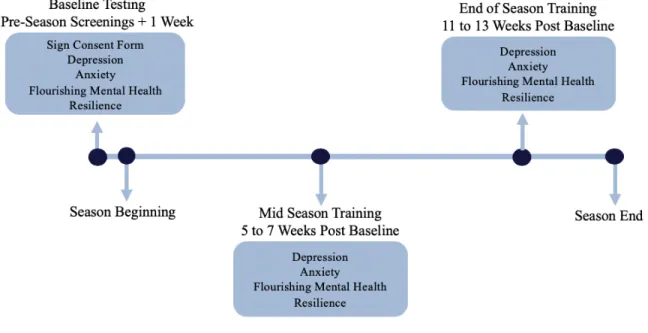
This study followed a longitudinal repeated measures design. Athletes were examined for resilience, depression, anxiety and flourishing mental health symptoms at a baseline testing session during their preseason screening with sports medicine staff. Athletes then completed follow up assessments at approximately 6 and 12 weeks post-baseline reassessing depression, anxiety, flourishing mental health symptoms and resilience. Throughout their competitive season, session RPE was tracked after official team training sessions to monitor training load.
Procedures
During the athlete’s pre-season screening with sports medicine clinicians, athletes reported to the central athletic training facility on campus to complete a baseline psychometric assessment. Participants signed a consent form indicating that they were comfortable completing questionnaires related to mental health symptoms. Via pen and paper, athletes completed the PHQ-9 to assess symptoms related to depression, the GAD-7 to assess anxiety symptoms, and the MHC-SF to assess flourishing mental health. Athletes also completed the CD-RISC-10 to assess resilience. They repeated this process at approximately 6 (within 5-7 weeks) and 12 (within 11-13 weeks) weeks after baseline testing for the PHQ-9, GAD-7, MHC-SF, and CD-RISC-10 via email follow-up. Throughout their training, RPE and training duration was recorded after official team training as previously stated through pen and paper tracking by athletic
training staff or via online questionnaire. On days where no training was completed, training duration was documented as zero minutes with the associated RPE value. These values were important in calculating the total training load and acute to chronic workload ratio.
Psychometric Questionnaires
A variety of psychometric questionnaires were used to assess the mental health symptoms of the participants. The PHQ-9 was utilized to monitor symptoms related to depression. This questionnaire was found to have excellent internal consistency and test-retest reliability in previous research involving college aged students (Cronbach a = .89), which demonstrates its effectiveness (El-Den et al., 2018; Kroenke et al., 2001). Additionally, when validated
Symptoms related to anxiety were measured through the GAD-7 questionnaire which previous research has shown strong construct validity and high criterion validity (Spitzer et al., 2006). Research shows excellent internal consistency of the GAD-7 (Cronbach a = .92) (Spitzer et al., 2006). Furthermore, when assessed in Portuguese college students the GAD-7
demonstrated good convergent validity (Bártolo, Monteiro, & Pereira, 2017). This is the only comprehensive validation of the GAD-7 in collegiate students to our knowledge. Additionally, previous research has demonstrated acceptable internal consistency reliability of the PHQ-9 and GAD-7 in athletic populations (Fraser et al., 2016).
The MHC-SF, utilized to measure flourishing mental health, has good convergent
validity suggesting that it can be utilized as a valid measurement (Lamers et al., 2011). Although the MHC-SF has not been validated in college students specifically, it has demonstrated high internal reliability (Cronbach a = .89) in patients 18 years old and up (Lamers et al., 2011).
Finally, resilience was measured through the CD-RISC-10. Campbell-Sills and Stein (2007) found good psychometric functioning of this scale based off factor analyses (salient loadings on their latent constructs, ranging from .39 to .80, all p < .001) (Campbell-Sills & Stein, 2007). The CD-RISC-10 has also been validated in competitive sport demonstrating excellent internal reliability (Cronbach a = .87) (Gonzalez et al., 2016). Although these instruments have been validated in various populations (including college students and in competitive sport), these measures are not sufficient to diagnose these disorders clinically.
Training Load
associated internal training load via RPE value using manual tracking via pen and paper. Athletes received detailed descriptions of the RPE scale and were instructed to report training RPE within 15 minutes of the cessation of their training session. Due to limited athletic training staff, one team completed session duration and associated RPE value tracking through an online workload questionnaire which was completed on the student-athlete’s personal phone, computer, or tablet. RPEs were collected only after official team practices and competition and did not include additional official team training that occurs in the weight room. This was due to the inability of athletic training staff to be at all weight training sessions. Further, there were situations where it was not clinically or socially appropriate to probe student-athletes for their RPE value. All training load information was filtered to create data points at which the
psychometric questionnaires are distributed. Cumulative sums of training load were utilized to assess total training load at 12 weeks. Weekly averages were utilized to calculate the athlete’s acute to chronic workload ratio. Acute to chronic workload ratio is calculated through dividing the acute workload, training load for 1-week, by the chronic workload, training load from 4-weeks (ACWR = ) (Huli et al., 2014; Stares et al., 2018). For example, if an athlete’s average workload for 1 week’s training is 428.6 arbitrary units and their average workload for 4 weeks’ training is 422.3 arbitrary units, their acute to chronic workload ratio would be 1.0.
Injury Follow-Up
participants via email. The survey obtained self-reported injury and time loss during Fall 2018 training. Injury was defined as an incident that removed the subject from practice or competition. This information was utilized in statistical analyses to control for any potentially confounding variables.
Statistical Analysis
CHAPTER IV: RESULTS
Descriptive Statistics
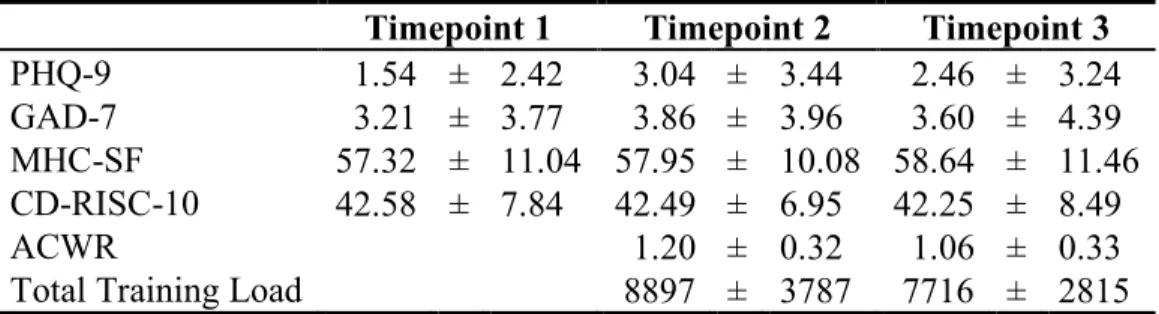
160 student-athletes were recruited to participate in the current study. By timepoint 3, we experienced a 28.8% attrition rate, resulting in an n of 114. 155 subjects completed timepoint 1, 135 subjects completed timepoint 2, and 114 subjects completed timepoint 3.Means and standard deviations among psychometrics and acute to chronic workload ratios can be found in Table 1. It is important to note that on average across all timepoints, participants did not report symptoms high enough that would warrant referral to team psychologists, as PHQ-9 scores from 5-9, 10-14, and greater than 15 indicate mild, moderate, and severe levels of depression
symptoms respectively (Kroenke et al., 2001). Research indicates that cut-off scores for
detection of major depressive disorder and referral is a score greater than 8 on a PHQ-9 (Manea, Gilbody, & McMillian, 2012). In this study average depressive symptom scores were 1.5, 3.0, and 2.5 at the three timepoints respectively. For GAD-7 assessments of anxiety, scores of 5 points, 10 points, and 15 points indicate mild, moderate, and severe anxiety respectively (Spitzer et al., 2006). Sum scores of greater or equal to 10 points are cause for referral to the appropriate mental health care provider for those with anxiety symptoms (Löwe et al., 2008). In this study average anxiety symptom scores were 3.2, 3.9, 3.6, at the three timepoints respectively.
Univariate Correlations
ratio at timepoint 3 (approximately 12 weeks). Resilience and workload were also not associated with the changes in each dependent variable across the study period (p-values > 0.05). However, they were associated with aggregate scores of mental health symptoms at certain timepoints in the expected directions. Specifically, higher baseline, 6 weeks, and 12 weeks resilience were associated with higher flourishing mental health at each timepoint (0.001 < p-values < 0.0014). Further, higher baseline, 6 weeks, and 12 weeks resilience were associated with lower anxiety symptoms at each timepoint, excluding baseline resilience on flourishing mental health at 6 weeks and 12 weeks (0.001 < p-values < 0.049). Finally, higher baseline, 6 weeks, and 12 weeks resilience was associated with lower depressive symptoms at each timepoint, excluding baseline resilience on flourishing mental health at 12 weeks (0.001 < p-values < 0.002).
Females reported lower resilience (r = -0.214, p = 0.024) and lower acute to chronic workload ratio at timepoint 3 (r = -0.270, p = 0.004). Gender was not associated with total training load at timepoint 3. Recovery, a potential confounding variable to changes in mental health symptoms, was investigated for significant associations amongst study variables. We found that at all timepoints recovery was associated with each dependent variable at all
timepoints, excluding recovery at 6 and 12 weeks on flourishing mental health and resilience at baseline, recovery at 12 weeks on flourishing mental health at 6 weeks, and recovery at 6 weeks on flourishing mental health, resilience, and anxiety at 12 weeks (0.001 < p-values < 0.044). For acute to chronic workload ratio, scores for 6 weeks were significant and trending toward
Depression
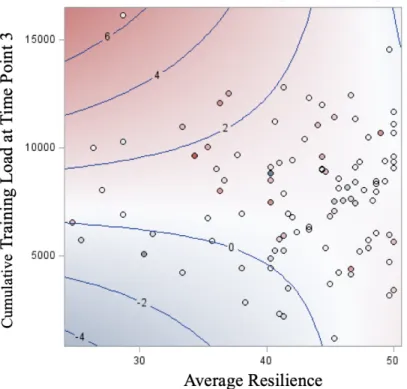
To answer Hypothesis 1, we tested both acute to chronic workload ratio and total training load at timepoint 3 as predictors of depression across the study period. Total training load at timepoint 3 was the only significant main effect. Total training load at timepoint 3 had a positive main effect, in that those who had greater total training load had greater increases in depressive symptoms (t-score = 2.14, p-value = 0.035). To control for any potentially confounding variables average recovery, gender, and injury were added to the model. Gender was the only significant predictor in changes in depression across the study period (t-scores = -2.52, p-value = 0.013), and recovery was dropped from the final model. Males experienced greater increases in depressive symptoms than females.
Figure 4. Contour Fit Plot of the Moderating Effect of Resilience on the Relationship between Total Training Load and Changes in Depressive Symptoms
Anxiety
We tested both acute to chronic workload ratio and total training load at timepoint 3 as predictors of anxiety across the study period to answer the first hypothesis. Neither workload variable showed a significant effect, F(2,102) = 0.23, p-value = 0.7973. To answer Hypothesis 2 average resilience, as well as the interaction between both training load measures were added to the model. None of our hypothesized variables predicted the change in anxiety (see Table 3, t-scores = 0.85, 0.33, 0.66, -0.44, and -0.71 respectively, p-values = 0.40, 0.74, 0.51, 0.66, and 0.48 respectively). This model accounted for less than 2% of the variance in changes in anxiety symptoms. No variables predicted any variance in anxiety symptom changes across the
Flourishing Mental Health
To answer Hypothesis 1, we tested both acute to chronic workload ratio and total training load at timepoint 3 as predictors of flourishing mental health across the study period. Total training load at timepoint 3 was the only significant effect and it had a negative effect meaning, as there were increases in total training load, changes in flourishing mental health symptoms went from increases, to no change, to decreases (t-scores = -2.29, p-value = 0.024). To control for any potentially confounding variables average recovery, gender, and injury were added to the model, none were significant, p-value > 0.05, and therefore were dropped from the final model.
To answer Hypothesis 2 average resilience as well as the interaction between both training load measures were added to the model. Total training load, acute to chronic workload ratio, gender, resilience, and the interactions between workload variables and resilience trended toward significantly predicting the variance in flourishing mental health symptom changes. This model accounted for almost 7% of the variance in changes in flourishing mental health symptom changes. None of our hypothesized variables predicted the change in flourishing mental health (see Table 3, t-scores = -0.14, -0.79, 0.27, 0.72, and 0.34 respectively, p-values = 0.89, 0.43, 0.79, 0.47, and 0.56 respectively).
Table 1. Descriptive Statistics (Mean ± SD)
(n =114)
Timepoint 1 Timepoint 2 Timepoint 3
PHQ-9 1.54 ± 2.42 3.04 ± 3.44 2.46 ± 3.24 GAD-7 3.21 ± 3.77 3.86 ± 3.96 3.60 ± 4.39 MHC-SF 57.32 ± 11.04 57.95 ± 10.08 58.64 ± 11.46 CD-RISC-10 42.58 ± 7.84 42.49 ± 6.95 42.25 ± 8.49
ACWR 1.20 ± 0.32 1.06 ± 0.33
Table 2. Mental Health Symptoms Correlations to Predictors
(n = 114)
PHQ GAD MHC
Time 1 Time 2 Time 3 Time 1 Time 2 Time 3 Time 1 Time 2 Time 3
CD-RISC-10 -0.37*** -0.40*** -0.33** -0.33** -0.35** -0.27** 0.47*** 0.51*** 0.52***
ACWR -0.04 -0.04 -0.04 0.11 0.02 0.04 0.09 -0.0005 0.08
Total Training Load
0.09 0.09 0.24 0.13 0.11 0.10 0.15 0.01 -0.07
Note. PHQ = Depression, GAD = Anxiety, MHC = Flourishing Mental Health Symptoms. Time 1 = Baseline, Time 2 = Approx. 6 Weeks, Time 3 = Approx. 12 Weeks.
*p < .05, **p < .01, ***p < .001
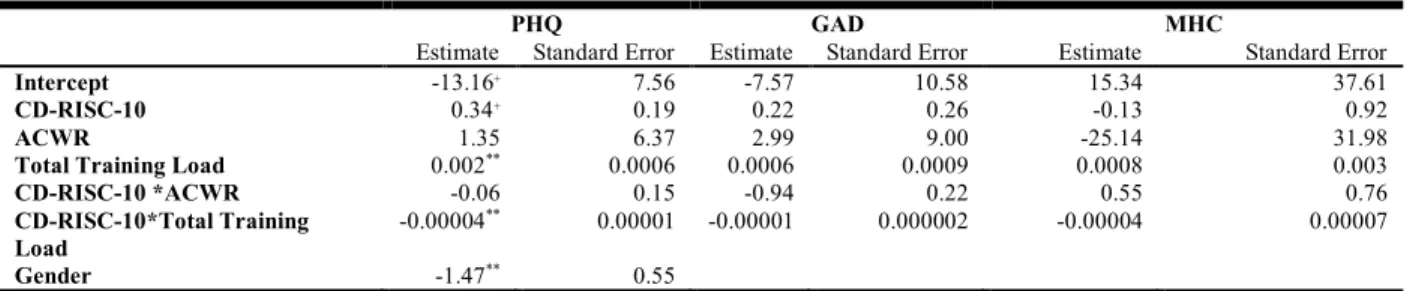
Table 3. Full Model Estimates and Standard Errors.
(n = 114)
PHQ GAD MHC
Estimate Standard Error Estimate Standard Error Estimate Standard Error
Intercept -13.16+ 7.56 -7.57 10.58 15.34 37.61
CD-RISC-10 0.34+ 0.19 0.22 0.26 -0.13 0.92
ACWR 1.35 6.37 2.99 9.00 -25.14 31.98
Total Training Load 0.002** 0.0006 0.0006 0.0009 0.0008 0.003
CD-RISC-10 *ACWR -0.06 0.15 -0.94 0.22 0.55 0.76
CD-RISC-10*Total Training
Load -0.00004
** 0.00001 -0.00001 0.000002 -0.00004 0.00007
Gender -1.47** 0.55
Note. PHQ = Depression, GAD = Anxiety, MHC = Flourishing Mental Health Symptoms.