EFFECT OF THE AFFORDABLE CARE ACT ON UTILIZATION OF EMERGENCY AND PRIMARY CARE
Paul Ronald Shafer
A dissertation submitted to the faculty at the University of North Carolina at Chapel Hill in partial fulfillment of the requirements for the degree of Doctor of Philosophy in the Department of Health Policy and Management in the Gillings School of Global Public Health.
Chapel Hill 2019
ABSTRACT
Paul Ronald Shafer: Effect of the Affordable Care Act on Utilization of Emergency and Primary Care
(Under the direction of Justin Trogdon)
The Affordable Care Act (ACA) has considerably reduced the uninsured rate nationally through availability of guaranteed issue private plans (Marketplace) and Medicaid expansion. However, expanding access to health insurance coverage may not be a sufficient incentive for consumers to change their usual setting for care, reduce avoidable use of emergency departments (ED), or increase use of preventive care. One of the core arguments for expansion has been that individuals without coverage may forego preventive care, delay treatment, and subsequently overutilize the ED––leading to worse health outcomes and higher long-run health expenditures. The objective of this dissertation is to investigate the effect of the ACA on substitution between ED and primary care among the newly insured (aim 1), potential delayed effects of coverage gains on avoidable use of the ED (aim 2), and whether high deductibles serve as a barrier to the use of no-cost preventive services (aim 3).
MarketScan® for 2008 through 2016 to estimate the effect of high deductible health plan enrollment on use of high-value preventive services using difference-in-differences models.
ACKNOWLEDGEMENTS
It is hard to know where to start, there are so many people that made this dissertation and the dream of doing a PhD possible. I cannot thank my committee enough, a wonderful group of thoughtful researchers who were so giving of their expertise. They helped me refine and execute what was an ambitious dissertation project to get through in two years. Justin, thank you for being an encouraging and level-headed guide throughout this journey. You always pushed me to think about whether I was trying to do too much but never tried to talk me out of pushing my boundaries. Sally, thank you for always asking the tough questions and providing lots of wisdom and counsel about the job market. Stacie, thank you for being one of my favorite people and a model for the type of researcher, colleague, and person that I hope to be. Lindsay, thank you for sharing your time and positivity with me from afar. Two of these aims built directly upon your work, which made it so great to have you involved. Tim, thank you for the insights into life in the emergency department, both while shadowing and in framing this work.
To my HPM cohort, thank you so much for your friendship and support. It has been so fun to learn and grow alongside you for the past four years. To my fellow scholars in the Robert Wood Johnson Foundation Health Policy Research Scholars program, thank for your friendship and inspiration. You are all such amazing people doing important work on so many topics that matter to health and equity, it is going to be wonderful to look back later in life to see the collective impact that we have had on our world.
It is not a stretch at all to say that I would not be in this position and certainly not as well-prepared for a transition into faculty life and independent scholarship without my time at RTI. Kevin Davis, Brett Loomis, Jennifer Duke, Annice Kim, Matthew Farrelly, and others, thank you for giving me the chance to learn and grow as a researcher. You saw such potential in me and gave me so many opportunities to realize it. I never thought that I would do half of what I ended up doing in those early years of my career and I am so much better for it now. Stu Allen and Ken Snowden, thank you for taking a chance on a very motivated but high-risk applicant to UNC Greensboro nearly a decade ago. Chuck Courtemanche, thank you for showing me behind the curtain a bit of being a health economist and junior faculty member. You helped me believe that I could actually do the kind of work that I wanted to do as a career.
And of course, thank you to my parents and Jenni. We have had our ups and downs but I wouldn’t be the person I am without you, and I cannot thank you enough for your support in pursuing this dream. To my Ellie, thank you for being the smartest, kindest, and most tenacious little girl I know. You bring so much joy to my life and I will always love you so very much. I can’t wait to see where your interests and life take you.
TABLE OF CONTENTS
LIST OF TABLES ... x
LIST OF FIGURES ...xii
LIST OF ABBREVIATIONS ... xiii
CHAPTER 1: INTRODUCTION ... 1
Affordable Care Act ... 1
Expectations of ACA effects on health care use... 2
Prior evidence ... 4
Specific aims ... 18
Implications ... 19
CHAPTER 2: IS PERSISTENCE OF UNINSURANCE ASSOCIATED WITH SUBSTITUTION BETWEEN EMERGENCY DEPARTMENT AND PRIMARY CARE USE? ... 21
Introduction ... 21
Methods ... 22
Results ... 27
Discussion ... 30
CHAPTER 3: IS THERE A DELAYED EFFECT OF COVERAGE GAINS UNDER THE
AFFORDABLE CARE ACT ON AVOIDABLE ED VISIT RATES? ... 44
Introduction ... 44
Methods ... 46
Results ... 51
Discussion ... 54
Tables and Figures ... 58
CHAPTER 4: DO HIGH DEDUCTIBLES REDUCE THE USE OF ‘FREE’ PREVENTIVE SERVICES UNDER THE AFFORDABLE CARE ACT? ... 74
Introduction ... 74
Methods ... 77
Results ... 84
Discussion ... 88
Tables and Figures ... 93
CHAPTER 5: CONCLUSION ... 105
Implications ... 105
Future Directions ... 108
LIST OF TABLES
Table 1. Weighted sample characteristics by persistence of uninsurance,
United States, 2013–2014 ... 35
Table 2. Weighted linear regression estimates of year-over-year change in emergency department visits, United States, 2013–2014 ... 37
Table 3. Weighted linear regression estimates of year-over-year change in primary care visits, United States, 2013–2014 ... 37
Table 4. Predicted probabilities of substitution and marginal effects by persistence of uninsurance prior to 2014, United States, 2013–2014 ... 38
Table 5. Weighted multinomial logistic regression estimates of year-over-year substitution, United States, 2013–2014 ... 39
Table 6. Sensitivity analysis of year-over-year change in emergency department visits, United States, 2013–2014 ... 40
Table 7. Sensitivity analysis of year-over-year change in primary care visits, ... 40
Table 8. Sensitivity analysis of year-over-year substitution, United States, 2013–2014... 41
Table 9. Stratified marginal effects of persistence of uninsurance prior to 2014 ... 42
Table 10. State demographic characteristics, 2008 and 2016 ... 66
Table 11. ED visit volumes and classification for non-elderly adults by state ... 67
Table 12. Fixed effect estimates of the contemporaneous effect of changes in county-level insurance coverage on ED visit rates, 2008 to 2016 ... 68
Table 13. Fixed effect estimates of the lagged effect of changes in county-level insurance coverage on ED visit rates, 2008 to 2016 ... 69
Table 14. Fixed effect estimates of the lagged effect of changes in county-level insurance coverage on ED visit rates, 2008 to quarter 3 of 2015 ... 70
Table 15. Fixed effect estimates of the lagged effect of changes in county-level insurance coverage on ED visit rates, including urgent care centers, 2008 to 2016 ... 71
Table 16. Spatial regression estimates of the contemporaneous effect of changes in county-level insurance coverage on ED visit rates, 2008 to 2016 ... 72
Table 18. Preventive services covered without cost sharing by non-grandfathered plans ... 95 Table 19. Underlying preventive services included... 96 Table 20. Diagnosis and procedure codes used to identify preventive services in claims ... 97 Table 21. Unweighted and weighted baseline (2010) sample characteristics by
HDHP enrollment, cohort sample ... 101 Table 22. Any use of and unconditional real costs for potentially covered preventive
services by HDHP enrollment, cohort sample ... 102 Table 23. Difference-in-differences estimates of the effect of HDHP enrollment
on any use of potentially covered preventive services in 2011, cohort sample ... 102 Table 24. Difference-in-differences estimates of the effect of HDHP enrollment
on category-specific use of potentially covered preventive services in 2011,
cohort sample ... 103 Table 25. Difference-in-differences estimates of the effect of HDHP enrollment
LIST OF FIGURES
Figure 1. Conceptual model ... 4 Figure 2. Sample size and inclusion criteria... 33 Figure 3. Weighted average emergency department and primary care visits
by persistence of uninsurance prior to 2014, United States, 2013–2014 ... 34 Figure 4. Weighted adjusted year-over-year change in emergency department
and primary care visits by persistence of uninsurance, United States, 2013–2014 ... 34 Figure 5. Average quarterly ED visits per 1,000 non-elderly adults by county for
included states, 2008 ... 58 Figure 6. Annual non-elderly insured rate by county for included states, 2008 ... 59 Figure 7. Change in average quarterly ED visits per 1,000 non-elderly adults by
county for included states, 2008 to 2016 ... 60 Figure 8. Change in annual non-elderly adult insured rate by county for included
states, 2008 to 2016 ... 61 Figure 9. Average quarterly ED visits per 1,000 non-elderly adults for ambulatory
care sensitive conditions by county for included states, 2008 ... 62 Figure 10. Average quarterly ED visits per 1,000 non-elderly adults for
non-emergent or emergent but primary care treatable conditions by county
for included states, 2008 ... 63 Figure 11. Change in average quarterly ED visits per 1,000 non-elderly adults
for ambulatory care sensitive conditions by county for included states,
2008 to 2016 ... 64 Figure 12. Change in average quarterly ED visits per 1,000 non-elderly adults
for non-emergent or emergent but primary care treatable conditions by
county for included states, 2008 to 2016 ... 65 Figure 13. Use of any potentially covered preventive service by HDHP enrollment,
cross-sectional sample ... 93 Figure 14. Real total costs for potentially covered preventive services
by HDHP enrollment, cross-sectional sample ... 93 Figure 15. Real out-of-pocket costs for potentially covered preventive services by
LIST OF ABBREVIATIONS
ACA Patient Protection and Affordable Care Act of 2010 ACSC ambulatory care sensitive condition
AFDC Aid to Families with Dependent Children AHRF Area Health Resources Files
AHRQ Agency for Healthcare Research and Quality aOR adjusted odds ratio
CBP County Business Patterns
CHIP Children’s Health Insurance Program CI confidence interval
CPS Current Population Survey CPT Current Procedural Terminology DID difference-in-differences
ED emergency department
EDA Emergency Department Algorithm EPO exclusive provider organization FPL federal poverty level
FQHC federally qualified health center
HCPCS Healthcare Common Procedure Coding System HCUP Healthcare Cost and Utilization Project
HDHP high deductible health plan HMO health maintenance organization
ICD-9 International Classification of Diseases, Ninth Revision ICD-10 International Classification of Diseases, Tenth Revision MCO managed care organization
MEPS Medical Expenditure Panel Survey MSA metropolitan statistical area
NAICS North American Industry Classification System
NEPCT non-emergent or emergent but primary care treatable condition NHIS National Health Interview Survey
NYU New York University OHP Oregon Health Plan OT occupational therapy
PC primary care
POS point of service
PPO preferred provider organization PT physical therapy
PQI Prevention Quality Indicators
SAHIE Small Area Health Insurance Estimates SDID semi-parametric difference-in-differences
SE standard error
SEDD State Emergency Department Databases SID State Inpatient Databases
CHAPTER 1: INTRODUCTION
Affordable Care Act
of state health insurance exchanges is commonly known. Those in the coverage gap have little hope of obtaining affordable coverage unless employer-based coverage is or becomes an option.
Under the ACA, states were given the flexibility to setup insurance exchanges in one of several forms—a based marketplace (fully designed and implemented by the state), state-based marketplace–federal platform or state-federal partnership marketplace (all or most functions performed by the state except for the enrollment platform), or a federally-facilitated marketplace (completely managed by the federal government). In the Marketplace, individuals between 100% and 400% of the federal poverty are eligible for subsidies in the form of advanced premium tax credits to help them purchase private insurance coverage from participating insurers in their state. Many who have qualified for subsidized individual coverage through the exchange are still in danger of delaying or refusing to seek care because of high deductibles that require enrollees to pay for the first several thousands of dollars’ worth of services received each year. The in-network deductible and out-of-pocket maximum were capped at $6,350 for self-only coverage and $12,700 for family coverage for the 2014 plan year (Kaiser Family Foundation, 2015a), increasing slightly each year thereafter. These caps are doubled for out-of-network coverage, an important factor given the prevalence of so-called narrow network plans, or those plans with more restrictive provider networks that qualify for in-network cost sharing, in the Marketplace (Sen, Chen, Cox, & Epstein, 2017; Zhu, Zhang, & Polsky, 2017). Both cost sharing and provider availability have implications for how individuals will use health care after gaining coverage.
Expectations of ACA effects on health care use
Association of Public Hospitals and Health Systems, 2013). Overutilization of the ED has implications not only for hospitals and their budgets, but for other patients as well. ED crowding has been linked to quality of care measures, including timeliness of and satisfaction with care provided, as well as health outcomes (Bernstein et al., 2009; Mullins & Pines, 2014; Stang, Crotts, Johnson, Hartling, & Guttmann, 2015). There is widespread disagreement about the size of the problem and focusing on ED use for non-emergent or preventable conditions as a problem rather than only a symptom of a larger problem (e.g., unmet social needs, lack of access) may be misplaced (Uscher-Pines, Pines, Kellermann, Gillen, & Mehrotra, 2013).
The ACA is the most fundamental national reform of the health insurance system since the passage of Medicare and Medicaid as amendments to the Social Security Act in 1965. As such, there was little empirical evidence from which to draw conclusions about the potential impact of the ACA on health care use. Prior studies have examined the impact of earlier state-based expansions of Medicaid on health care utilization for distinct services and provider types. Providers are an important component of any model of coverage expansion as physicians may respond to changes in service volume and reimbursement rates, a concept referred to as induced demand. Empirical evidence of provider induced demand exists for both the U.S. and abroad (Janet Currie & Gruber, 2001; Gosden et al., 2000; van Dijk et al., 2013). We will largely ignore the potential for induced demand as a component of the effects of coverage expansion on health care use, as the literature does, but it is an important factor to keep in mind.
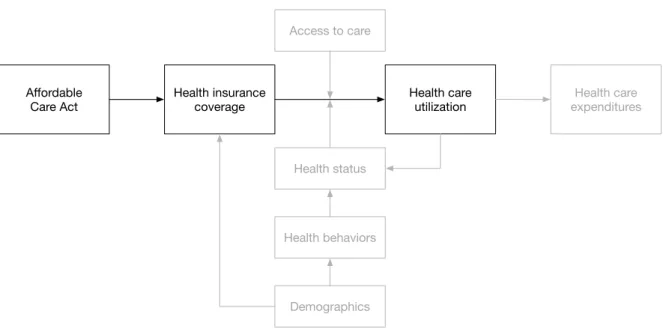
model (Figure 1) was adapted from the Aday and Andersen framework on access to care in which “health policy” has an impact on “characteristics of population at risk”, which is related to “utilization of health services” including the “type”, “site”, and “purpose” of medical care used (Aday & Andersen, 1974). Using that framework, insurance coverage can be considered a “mutable” (changeable) “enabling” factor for individuals that has an effect on how they consume health care. The pathway highlighted in Figure 1 is the focus for the three aims in this study with the other factors (i.e., access to care, health status, health behaviors, demographics) serving as covariates. Expenditures are not the focus of this study; however, changes in spending on preventive services will be discussed in the third aim.
Figure 1. Conceptual model
Prior evidence
Pre-ACA
We can draw on evidence from prior changes in state Medicaid eligibility criteria to develop hypotheses for how Medicaid expansion under the ACA may impact health care utilization in the states that have elected to expand Medicaid.The findings from this review will be organized
Affordable
Care Act Health insurance coverage Health care utilization expendituresHealth care Access to care
Health status
around three distinct groups of patients: adults, children, and pregnant women. Generally, we would expect expansions of eligibility and/or coverage to result in increases in utilization; however, shifting between types of services is also possible. For example, we could hypothesize that newly covered adults may be more likely to visit a primary care provider instead of using the ED as a safety net. The short-term implications for utilization from this type of behavior are less clear, though obviously one could expect long-term cost savings and improvement in health outcomes from earlier diagnosis and greater use of less expensive types of providers and treatment. Adults
For adults, we will review the findings from five studies, four of which looked at changes in eligibility or benefits in five states (Tennessee, Kentucky, Idaho, Massachusetts, and Oregon). The final study is a longer-term comparison of utilization across 10 states that expanded Medicaid in the 2000s with 14 bordering states that did not change their eligibility or benefits. Reducing eligibility and increasing cost sharing tended to result in lower utilization of services among the insured population. Increasing eligibility or benefits showed mixed results, with positive changes (reduction in preventable admissions) in some states, but null or poor findings (no changes in ED use, low uptake of wellness visits) in other states.
weekly mean ED visits for private insurance, Medicare, and other coverage were either not significant and/or a change of less than 150 visits per week. Since weekly totals do not account for the relative size of each payer population, the authors also examined changes in payer composition of ED visits descriptively and using multivariate analysis. They found that proportion of visits decreased for TennCare (30.6% to 24.4%, p<0.01) and increased for the uninsured (12.2% to 17.5%, p<0.01) with both results persisting in fully adjusted models. Similarly, for visits per person-year, they found a decrease for TennCare (0.910 to 0.885, p<0.01) and an increase for the uninsured (0.455 to 0.587, p<0.01). Though overall ED volume did not markedly increase as one might hypothesize, it is clear from their findings that disenrollment was associated with an increased “role of the Tennessee ED as a safety net provider” (Heavrin et al., 2011).
visit newly covered under their plan during the period following the benefit change. These findings indicate that adding copayments and limitations on name-brand prescription drug use had little impact on overall utilization of services and prescriptions, with perhaps some small amount of shifting from name-brand to generic drugs. Also, providing free well-care visits did not result in significant uptake of preventive services, at least in the short term.
In 2006, Massachusetts passed what became a model for the Affordable Care Act in an effort to provide and require health insurance coverage for all residents. This was accomplished through an expansion of MassHealth, the state Medicaid program, and the creation of CommCare, through which eligible residents could obtain free or subsidized coverage in the new state health insurance exchange, referred to as the Connector. Kolstad and Kowalski used difference-in-difference models to examine the effects of the statewide coverage expansion on length of hospital stays and admissions from the emergency department (Kolstad & Kowalski, 2012). Unfortunately, their study design could not isolate the specific impact of the Medicaid expansion since the other coverage expansions were happening at the same time. They observed that health reform in Massachusetts was associated with a 36% decline in uninsurance among the inpatient hospital population, which was also associated with decreased length of stay, preventable admissions, and hospital cost growth.
Act, EDs were unable to refuse to provide service if an enrollee was unable to pay the copayment and the copayment requirement itself was ultimately reversed by a court order in June 2004. They used administrative and claims data for participants enrolled in the OHP from 2001 to 2004, excluding dual eligible, minors, and those with special eligibility from the study, providing a pre-post examination of the benefit changes. ED use by OHP Standard enrollees decreased by 16% (aOR=0.84, 95% CI=0.83, 0.86) as a result of the imposition of the copayment before recovering 9% of the decline after the copayment was reversed (aOR=1.09, 95% CI=1.06, 1.12). ED use was still approximately 8% lower after the copayment was reversed compared to before the benefit changes (aOR=0.92, 95% CI=0.89, 0.95). Their findings indicate that increases in cost sharing for Medicaid patients had a negative effect on ED utilization, even after the copayment for ED services was nullified by a court order.
An analysis of Kaiser Family Foundation data from 1999 to 2011 found that state-based Medicaid expansions in 10 states between 2000 and 2009 were not associated with a change in the percentage of enrollees with high ED utilization (≥2 emergency visits per year) when compared with enrollees in 14 bordering states that did not expand Medicaid (Ndumele, Mor, Allen, Burgess, & Trivedi, 2014). It provides evidence that expanding Medicaid eligibility was not associated with changes in high use of ED services among adults, suggesting that providing health insurance coverage may not necessarily change ED utilization habits among low-income individuals. Children
the other examined effects of increased service coverage and reimbursement rate changes for medical and dental services in Kentucky and Idaho.
In the early 1980s, eligibility for Medicaid was determined by participation in Aid to Families with Dependent Children, a cash transfer (welfare) program for very low-income families. By 1992, federal Medicaid rules required states to expand coverage to groups of children in poor families with incomes higher than the AFDC limits (ages 0-5: up to 133% FPL, ages 6-19: up to 100% FPL; optional coverage for infants up to 185% FPL). Currie and Gruber exploit the variation in the timing and specific eligibility criteria employed by each state to assess the impact of Medicaid eligibility on health care utilization in children (J Currie & Gruber, 1996). Using data from the Current Population Survey, they first estimated that the takeup rate, or enrollment in Medicaid as a result of the expanded eligibility criteria between 1984 and 1992 had an upper bound of 71%, indicating that nearly 30% of those eligible were not enrolling. The CPS data were used to impute income for similar households in the National Health Interview Survey, where incomes are only reported within a range and are missing for some households. Medicaid eligibility was associated with a 9.6% drop in likelihood of not having a doctor visit in the last year, nearly halving the baseline probability, and a 4.0% increase in likelihood of hospitalization within the last year, nearly doubling the baseline probability. Their analysis indicates that Medicaid expansions, even with less than perfect uptake by those newly eligible, results in increased use of health care services by children.
reimbursement rates for well-child visits by 12.5% in July 2007. Similarly, Idaho increased reimbursement rates for well-child visits by 8% to 24%, created a premium forgiveness program for those keeping up with preventive care in January 2007, and increased reimbursement rates for dental care by outsourcing to an MCO in September 2007. Kenney and colleagues used Medicaid and CHIP enrollment and claims data prior to, during, and following the policy changes to examine medical (ages 0-18) and dental visits (ages 3-18) among children in Kentucky and Idaho (Kenney, Marton, Klein, Pelletier, & Talbert, 2011). In Kentucky, there was no association between the reimbursement increase and probability of having any annual well-child visits within the last year; however, there was a 16% increase in likelihood of having any annual preventive dental visits associated with the changes in dental coverage. In Idaho, probability of receiving any annual well-child visits increased by 6% for well-children aged 0-5 and 19% for well-children aged 6-18. The reimbursement rate increase for dental services under the MCO were marginally associated with a small increase (2 percentage points) in probability of a preventive dental visit. Their findings suggest that reimbursement rate and coverage increases for Medicaid and CHIP-covered children in Kentucky and Idaho were associated with increases in medical and dental care use to varying degrees.
Pregnant women
As a result of a federal mandate to expand coverage for prenatal and maternity care, California expanded eligibility for pregnant women in Medi-Cal, the state’s Medicaid program, in 1989 and again in 1990. Eligibility rose from the prior income limit of approximately 100% of the federal poverty level to 185% in July 1989 and 200% in January 1990. Braveman and colleagues conduced an analysis of birth certificates for singleton (single child) in-state births to state residents in 1990 to assess the effect of insurance status on untimely and insufficient care (Braveman, Bennett, Lewis, Egerter, & Showstack, 1993). Women on Medi-Cal were at higher risk for untimely care (aOR=3.33, 95% CI=3.26, 3.40), defined as initiation of care occurring after the first trimester, than the reference group (women with private fee-for-service insurance). Notably, this was worse than the likelihood of uninsured women receiving untimely care (aOR=2.54, 95% CI=2.47, 2.60). Compared to the reference group, women with Medi-Cal were less likely to have had insufficient prenatal care (aOR=1.63, 95% CI=1.60, 1.66), among those receiving any prenatal care, than those who were uninsured (aOR=2.49, 95% CI=2.44, 2.55). This study is limited by the lack of longitudinal data with which to look at average changes in utilization before and after these expansions or the ability to differentiate women eligible under the prior eligibility requirements versus the expanded limits. However, it does provide evidence that expanded Medicaid coverage for pregnant women is positively associated with an increased number of prenatal visits, despite seemingly having no effect on timely initiation of care.
obtained from the National Center for Health Statistics. As such, they chose to stratify the sample of childbirths by characteristics strongly correlated with availability of private insurance coverage, such as age, education, and marital status. They used this to infer which pathway a mother likely took to Medicaid coverage, either transitioning from being uninsured to gaining Medicaid coverage during pregnancy or transitioning from private insurance to Medicaid as eligibility expanded in the late 1980s for pregnant women. They estimated that a 10% increase in proportion of pregnant women eligible for Medicaid was associated with increases of 0.32% for Cesarean section delivery, 0.92% for use of a fetal monitor, 0.19% for induction of labor, and 0.55% for ultrasound among the group of women gaining coverage through Medicaid. Conversely, they found that a 10% increase in proportion eligible for Medicaid was associated with decreases of 0.79% for Cesarean section delivery, 0.53% for use of a fetal monitor, 0.30% for induction of labor, and 0.21% for ultrasound among the group of pregnant women transitioning from private insurance to Medicaid. Patterns of treatment intensity generally increased for those transitioning from being uninsured to newly Medicaid-eligible but decreased for those transitioning from private to public insurance, demonstrating that physicians may be responding to economic incentives via differences in reimbursement rates (Medicaid reimbursements were approximately half that of private insurers at the time).
Quality of included studies
design to examine annualized ED use between Medicaid enrollees in expansion and matched control states; however, its conclusions are limited by a small cross-sectional sample (particularly in expansion states) and lack of multivariate analysis. Heavrin et al. (2011) uses administrative data from all ED visits in Tennessee for two years prior to and following disenrollment of 171,000 participants from TennCare. While longer periods would be preferable, weekly data were used in their multivariate analysis so sample sizes were not an issue. This study is helped by the fact that it is not based on claims data and therefore can incorporate all patients regardless of payer. Marton
et al. (2012) uses Medicaid enrollment and claims data from Kentucky and Idaho to examine changes in utilization at the individual level. They use logistic and linear probability models to estimate the individual likelihood of several utilization outcomes; however, this ignores possible changes in continuous utilization outcomes such as number of visits, length of inpatient stay, etc. Kolstad and Kowalski (2012) uses a nationally representative sample of hospitals with a difference-in-differences design to look at hospital utilization in Massachusetts versus the rest of the United States following Massachusetts health reform in 2006. Lowe et al. (2010) uses administrative data from Medicaid enrollees to conduct a comparison group analysis of ED visits over time between those enrollees subject to increased cost sharing and those not.
2011), who may have a higher likelihood of being uninsured (U.S. Department of Health and Human Services, Office of the Assistant Secretary for Planning and Evaluation, 2005), lower health literacy (Sentell & Braun, 2012), and cultural norms around health and health care that encourage delayed treatment (U.S. Department of Health and Human Services, Centers for Disease Control and Prevention, n.d.). Therefore, the impact of coverage on utilization may not be as strongly positive or shift as much utilization to earlier and less intensive treatment as we might expect. Prior studies in states with larger Hispanic populations, like California or Texas, if they exist, may provide more useful evidence for potential effects of increased coverage for the fastest growing segment of the U.S. population.
provide limited evidence from which to project what effect the ACA may have on utilization among children, though it would seem safe to assume that increased coverage for children would be associated with increased utilization. However, youth are generally less costly (i.e. use fewer services) than other age groups (U.S. Department of Health and Human Services, n.d.-b), covered at higher rates due to pre-ACA Medicaid and CHIP availability, and mandatory immunizations for school entry in many states already serve to encourage parents to bring their children for regular wellness visits. Therefore, the impact of expanded coverage for children under the ACA may be muted.
pregnant women under the ACA. Perhaps the most important question for researchers and policymakers, based on the findings of Currie and Gruber (2001), is whether expanded insurance coverage will yield unnecessarily intensive care rather than simple increases in utilization, as prenatal care is relatively standardized in terms of recommended visit and testing schedules compared to other health conditions (American Academy of Pediatrics & American College of Obstetricians and Gynecologists, 2012).
The findings described above generally demonstrate that eligibility and benefit expansions in Medicaid are associated with increases in utilization of preventive services and decreases in utilization of more intensive care. Similarly, we find that increases in cost sharing or outright disenrollment from Medicaid coverage is associated with decreased utilization by those still insured but also have the potential unintended consequence of increases in the use of more expensive care, such as ED visits, by those newly uninsured. With the passage of the ACA in 2010, there was an expectation among policymakers and patient advocates that those newly covered, either through the Marketplace or through Medicaid expansion, would be able to more affordably access preventive services and thus shift utilization away from providers (hospitals) and services of last resort (ED visits, preventable hospital admissions). This is meant to bend the cost curve downwards over time by providing earlier treatment of disease and better management of chronic conditions, reducing long-term health care expenditures and improving health outcomes. While this review does not address health outcomes, the evidence based on past Medicaid expansions shows that at least some of the desired behavior associated with this type of policy can be expected as a result of the ACA.
or incomplete. I am also limited by the fact that many studies do not address underlying factors that may also impact access and utilization of services in a given state, such as Medicaid provider participation and reimbursement rates relative to other public and private insurers. Many of the studies included are for individual states and those effects may not be generalizable to the population at-large for various reasons (e.g. health literacy, cultural beliefs, access to providers, demographics, etc.). This was largely unavoidable due to the limited number of changes to national Medicaid eligibility and benefits over the past few decades. However, each patient population studied in this review had one study that was either national or covered a large number of states.
Post-ACA
Previous studies have estimated the effect of coverage gains on ED utilization after ACA implementation (Nikpay, Freedman, Levy, & Buchmueller, 2017; Sommers, Blendon, Orav, & Epstein, 2016; Sommers et al., 2017), yielding mixed findings. Nikpay et al. (2017) found that total ED use increased in Medicaid expansion states by 2.5 visits more after 2014 relative to non-expansion states (95% CI: 1.1, 3.9). Conversely, Sommers et al. (2016) found that Medicaid expansion was associated with a significantly decreased probability of any ED use (−6.0 percentage points, p<0.05) and lower use of the ED as a usual source of care (-6.1 percentage points, p<0.01) along with a corresponding increased use of primary care visits (0.7 per person-year, p<0.05). Sommers et al. (2017) found significant decreases in the probability of any ED use in 2015 (-5.8 percentage points, p<0.01) and 2016 (-6.6 percentage points, p<0.01) in two Medicaid expansion states (Arkansas and Kentucky) relative to a non-expansion state (Texas), but no change in average ED visits.
Specific aims
In this dissertation, I chose to focus on non-elderly adults (18 to 64 years of age) given that they had the least generous prevailing coverage environment prior to the ACA outside of employer-sponsored insurance. Each of the three populations for which I described the pre-ACA evidence above had very different eligibility profiles for Medicaid before expansion and relative costs for non-group commercial insurance. I assess the impact of the ACA on health care use among non-elderly adults through the following three aims, filling in gaps in our knowledge about its effects.
associate insurance status with changes in person-level patterns of ED and primary care visits in 2013 and 2014. It uses the first year of the Marketplace and Medicaid expansion to provide a large set of individuals transitioning into coverage, also exploring how utilization responses vary by the differences in cost sharing burden between public and private coverage.
2) Is there a delayed effect of coverage gains under the ACA on non-emergent ED visit rates? This aim uses data on ED discharges from seven states from the Healthcare Cost and Utilization Project State Inpatient Databases and State Emergency Department Databases from 2008 through 2016. This allows for the isolation of pre-existing trends prior to large coverage gains in the years following the passage of the ACA. Two algorithms are used to identify preventable and non-emergent visits that are more likely to be substitutable to a primary care, retail clinic, and/or urgent care setting, exploring the presence of lagged effects and spatial correlation at the county level within states.
3) Do high deductibles reduce the use of ‘free’ preventive services under the Affordable Care Act? This aim uses commercial health insurance claims data from IBM Health® MarketScan® to identify whether high deductible plan enrollment is associated with lower use of preventive services for which the Affordable Care Act eliminated cost sharing in late 2010. It uses a cohort of adults who are continuously insured in the same plan type to assess whether there is differential response to the price shock, employing a semi-parametric difference-in-differences estimator to relax the parallel trends assumption.
Implications
CHAPTER 2: IS PERSISTENCE OF UNINSURANCE ASSOCIATED WITH SUBSTITUTION BETWEEN EMERGENCY DEPARTMENT AND
PRIMARY CARE USE?
Introduction
More efficient use of health care resources is often touted by policymakers, insurers, employers, and others as a goal of health insurance reforms along with improvements in access, affordability, and quality of care. Prior to the Patient Protection and Affordable Care Act of 2010, the majority of the evidence describing the effect of coverage on utilization was based on expanded eligibility for public coverage, primarily Medicaid, with the Massachusetts health reform of 2006 serving as the notable exception. These eligibility changes yielded mixed results for emergency department and/or primary care utilization (Anderson, Dobkin, & Gross, 2014; Chen, Scheffler, & Chandra, 2011; Heavrin et al., 2011; Kolstad & Kowalski, 2012; Lowe et al., 2010; Marton et al., 2012; Ndumele et al., 2014; Sommers & Simon, 2017; Taubman, Allen, Wright, Baicker, & Finkelstein, 2014). For example, the Oregon Health Insurance Experiment showed that coverage gains yielded persistently higher ED use two years after gaining coverage (Taubman et al., 2014). The state and local contexts for insurance expansion (e.g., baseline rates of coverage, health status) matter with recent work showing that these differences can explain seemingly contradictory findings in the past (Kowalski, 2018).
declines in uninsurance and evidence of improvements in self-reported health and preventive service use (Courtemanche et al., 2018; Sommers et al., 2017). Despite worries about PC appointment availability with a large influx of newly insured patients, widespread issues never materialized (Rhodes et al., 2017). However, it is possible that although availability for new patients did not worsen, wait times and other availability barriers were enough to make PC inconvenient and would depress transitions away from the ED. The ACA led to improvements in individuals reporting a usual source of care (Wherry & Miller, 2016), but research has not yet empirically addressed whether patients are actually changing their usual setting for care in response to coverage gains. Increasing length of time uninsured has been associated with lower access to care and those with insurance instability are more likely to use the ED as a primary source of care (Abdus, 2014; Schoen & DesRoches, 2000). However, to our knowledge, the relationship between changes in health care utilization and persistence of uninsurance prior to gaining coverage has not been examined in depth. Another gap is the failure to measure substitution across settings, or shifts in utilization between ED and PC after gaining coverage. Instead, studies often evaluate utilization within each setting separately. This study addresses both of these gaps by quantifying substitution between ED and PC settings within the same individuals over time and assessing whether persistence of uninsurance is associated with how patients use care once insured using a nationally representative sample.
Methods
Data
Prevention, 2018). These years were chosen due to the implementation of the two largest ACA coverage expansions in 2014 (Medicaid expansion and Marketplace), providing a large number of individuals transitioning from uninsurance into coverage. We merged on data from the Area Health Resources File to capture county-level population characteristics and access to health care. We also used the Marketplace Public Use Files from the Centers for Medicare and Medicaid Services and data published by the Kaiser Family Foundation to create measures of Marketplace plan availability and costs in 2014, the first year in which the health insurance exchanges were in operation. This study was approved as exempt by the Non-Biomedical Institutional Review Board at the University of North Carolina at Chapel Hill (#17-0774).
Sample
Measures
To assess substitution between ED and primary care, we first calculated the year-over-year change in utilization (the number of visits in 2014 minus the number of visits in 2013) within each setting separately for each individual in the analytic sample. We defined primary care visits in each year as the total number of office-based visits (as opposed to outpatient clinic visits) with a physician, physician assistant, nurse practitioner, or nurse. Visits to other types of providers (e.g., PT/OT, chiropractor, optometrist, dentist) were not included. Then, we generated a four-level categorical outcome for year-over-year substitution between settings with the following mutually exclusive and exhaustive categories: 1) increase in both ED and primary care visits (>ED, >PC); 2) same or fewer ED visits with an increase in primary care visits (£ED, >PC); 3) increase in ED visits with the same or fewer primary care visits, (>ED, £PC); and 4) same or fewer of both primary care and ED visits (£ED, £PC).
Persistence of uninsurance prior to 2014 was the explanatory variable of interest, defined as being continuously insured (covered for all of 2013); transiently uninsured (covered for at least one month in 2013 but not the full year); or persistently uninsured (uninsured for all of 2013) (Cannon, 2004; Short, Graefe, & Schoen, 2003). Among those categorized as persistently uninsured, over 80% (81.7%) were continuously uninsured for at least 36 months, providing a strong justification for considering this group as meaningfully different in health insurance experience than those only transiently uninsured.
health decline based on the year-over-year change (2013 to 2014) in perceived health status and an indicator for having an ambulatory care sensitive condition in 2013 (Agency for Healthcare Research and Quality, 2001; Centers for Medicare and Medicaid Services, 2015). We captured payer type in 2014 (i.e., private, public) to look for differential effects by benefit design (e.g., exposure to significant cost-sharing). Using the 2012 NHIS data, we created an indicator for having a declinable pre-existing condition for health insurance underwriting purposes using a methodology developed by the Kaiser Family Foundation (Kaiser Family Foundation, 2016b).
We included several state and county-level factors associated with access to care and health insurance along with characteristics of the socioeconomic environment in our analysis. Quartiles for the number of hospitals with an ED, number of primary care physicians, number of physician extenders, number of federally qualified health centers, and whether the county was a health professional shortage area were used to describe the availability of providers in each county (Health Resources and Services Administration, 2016). We also included unemployment rate, percentage of population white, in poverty, and uninsured, and whether the county was non-metro to account for the socioeconomic environment. Medicaid expansion status, number of Marketplace insurers, and average benchmark Marketplace premium for 2014 were used to describe the availability and affordability of health insurance in each state.
Statistical analysis
marginal effects of transient and persistent uninsurance on the predicted probability of being in each substitution category relative to the continuously insured group. As we are focused on individual-level changes in utilization rather than state-level policy differences (e.g., differences in Medicaid provider reimbursement rates), we include state fixed effects to account for any remaining time-invariant unobservable differences between states. We used the survey weights and design effects provided to account for the complex sampling design. All analyses were conducted in Stata® 15 for Linux (StataCorp, 2017b).
We also ran stratified versions of these analyses by presence of a declinable pre-existing condition (in 2012), having a visit for an ambulatory care sensitive condition (in 2013), and payer type (in 2014). We also performed numerous sensitivity analyses, including 1) raising the lower bound on age to 27 (as the dependent coverage provision allowed parents to include children up to the age of 26), 2) dropping those with family incomes over 400% of the federal poverty level (not eligible for advanced premium tax credits in the Marketplace), and 3) excluding those with no utilization in both years.
dependent on the profile of individuals who are potentially gaining coverage, including their experience with health insurance coverage, health literacy, and potential pent-up demand for health care.
Results
The mean age in our weighted sample was 41.2 years old with the two uninsured groups being significantly younger (transiently uninsured: 36.0, persistently uninsured: 38.9) than the continuously insured group (41.6) (Table 1). The sample was 52.5% female overall with only the transiently uninsured group (61.2% female) skewed noticeably away from a near even split. The percentage of each insurance status group that is white non-Hispanic decreases as persistence of uninsurance increased, from more than two-thirds (67.3%) for the continuously insured group to about half (50.9%) for the persistently uninsured group. Educational attainment, being employed, being married, and household income were all negatively associated with persistence of uninsurance.
Across the three groups of insurance status in 2013, we do not find significant differences in number of hospitals with an ED, number of primary care physicians, or number of physician extenders by persistence of uninsurance. We do observe lower availability of federally qualified health centers (at the county-level) within the two uninsured groups. Those in the two uninsured groups were significantly more likely to live in a county with a higher percentage of its population non-white, unemployed, in poverty, and uninsured. We find no significant differences between groups by health professional shortage area status or being in a non-metro (rural) area.
visit per year (3.3) than the transiently uninsured (2.2) and persistently uninsured (2.3) groups. Figure 4 shows survey weighted regression adjusted year-over-year change in ED and primary care utilization by persistence of uninsurance. We find no year-over-year change in ED use for the continuously insured and transiently uninsured groups but observe a small increase in ED use for the persistently uninsured group (0.06 visits per person, p<0.01). We observe small changes in year-over-year primary care utilization for the continuously insured (0.10 visit increase, p<0.01) and transiently uninsured (0.23 visit decrease, p<0.05) groups, but more than a one visit per year increase for the persistently uninsured group (1.10 visits per person, p<0.01). This sizable increase for the persistently uninsured group essentially catches it up with the continuously insured group once covered in 2014. These estimates of the year-over-year changes conform with the marginal effect estimates from our linear regression models of year-over-year change in ED and primary care utilization (Tables 2 and 3).
Table 4 shows the predicted probabilities for each substitution category and marginal effects by persistence of uninsurance. Nearly 60% of people across all three groups (continuously insured, transiently uninsured, persistently uninsured) are predicted to stay the same or decrease utilization in both settings with very little variation between groups. None of the marginal effects of persistence of uninsurance on substitution are significant at the 0.05 level. Coefficient estimates for the substitution models are shown in Table 5 and the sensitivity analyses described above are shown in Tables 6 through 8.
persistently uninsured. For the persistently uninsured through 2013 who transitioned to public insurance (e.g., Medicaid) in 2014, we observe a 0.24 visit increase in ED use (p<0.01) and a 1.94 visit increase in PC use (p<0.10) year-over-year. We find no changes among those who were persistently uninsured and gained private insurance or those who were transiently uninsured regardless of payer type gained in 2014. For the substitution outcome, we also observe a large negative marginal effect (-8.9 percentage points) of being persistently uninsured and gaining public insurance, relative to continuously insured, on the predicted probability of staying the same or decreasing utilization of both types of care, holding all else in the model constant, which indicates a shift towards increased utilization of one or both settings and is consistent with the other results shown. For this model only, we added state-level factors related to the ACA including Medicaid expansion status, number of Marketplace insurers, and the average benchmark premium to account for differences in plan competition and pricing across states.
predicted probability of increases in use of both settings for the transiently uninsured with an ambulatory care sensitive condition (p<0.05).
Discussion
as more states begin to experiment with so-called community engagement requirements (work requirements) in Medicaid that will likely increase churn.
Tables and Figures
Figure 3. Weighted average emergency department and primary care visits by persistence of uninsurance prior to 2014, United States, 2013–2014
Figure 4. Weighted adjusted year-over-year change in emergency department and primary care visits by persistence of uninsurance, United States, 2013–2014
* p<0.05 for year-over-year change not equal to zero + p<0.05 for difference from continuously insured group
0.16 0.16 3.32 3.43 0.16 0.17 2.23 2.00 0.18 0.24 2.34 3.46 0 0.5 1 1.5 2 2.5 3 3.5 4
2013 2014 2013 2014
ED Primary care
Av er ag e nu m be r o f v is its
Continuously insured Transiently uninsured (1-11 months) Persistently uninsured (≥12 months)
-0.01 0.10* 0.00 -0.23* 0.06*+ 1.10*+ -0.4 -0.2 0 0.2 0.4 0.6 0.8 1 1.2
ED Primary care
Ye ar -ov er -ye ar c ha ng e in v is its
Table 1. Weighted sample characteristics by persistence of uninsurance, United States, 2013–2014
Characteristic
% or mean (standard error)
Overall
By persistence of uninsurance prior to 2014
Continuously insured Transiently uninsured (1-11 months) Persistently uninsured (≥12 months) Number of
observations 6,435 5,555 251 629
Individual-level
Age* 41.2 (0.2) 41.6 (0.3) 36.0 (1.1) 38.9 (0.7)
Sex*
Female 52.5% 52.4% 61.2% 49.9%
Male 47.5% 47.6% 38.8% 50.1%
Race/ethnicity*
White,
non-Hispanic 65.7% 67.3% 54.7% 50.9%
African American,
non-Hispanic 11.4% 10.9% 19.2% 13.9%
Hispanic 13.7% 12.5% 18.5% 26.8%
Other,
non-Hispanic 9.1% 9.3% 7.6% 8.3%
Education*
High school
or less 31.0% 29.1% 40.9% 49.1%
Some college or
more 69.0% 70.9% 59.1% 50.9%
Employed* 79.2% 80.6% 68.7% 66.4%
Married* 57.6% 60.3% 35.8% 34.1%
Household size 3.0 (0.04) 3.0 (0.04) 2.8 (0.2) 2.9 (0.1) Household income*
0–99% 9.4% 7.7% 20.5% 24.5%
100–199% 13.7% 11.5% 23.0% 36.0%
200-400% 30.1% 30.1% 33.8% 28.0%
>400% 46.8% 50.6% 22.7% 11.6%
Perceived decline in health (from 2013
to 2014)* 22.8% 22.0% 27.3% 30.2%
Had an ambulatory care sensitive condition (in 2013)*
County-level Number of hospitals
with an ED (quartiles)
1 – top 41.5% 41.7% 37.1% 41.3%
2 17.6% 18.0% 16.4% 13.6%
3 22.6% 22.8% 23.3% 20.4%
4 – bottom 18.3% 17.5% 23.1% 24.7%
Number of primary care physicians (quartiles)
1 – top 30.9% 30.9% 29.9% 31.6%
2 29.2% 29.5% 26.9% 26.0%
3 21.6% 21.8% 19.4% 20.0%
4 – bottom 18.4% 17.9% 23.9% 22.4%
Number of physician extenders
(quartiles)
1 – top 31.0% 31.0% 28.3% 31.6%
2 29.0% 29.3% 25.0% 26.7%
3 20.5% 20.4% 25.0% 19.5%
4 – bottom 19.6% 19.3% 21.8% 22.2%
Number of federally qualified health centers
(quartiles)*
1 – top 34.8% 35.3% 29.8% 31.4%
2 26.2% 26.7% 27.2% 20.1%
3 23.4% 22.9% 22.0% 29.9%
4 – bottom 15.6% 15.2% 21.0% 18.7%
Percentage of county population
non-white* 34.3% 33.9% 38.0% 36.8%
Percentage of county population
unemployed* 7.3% 7.2% 7.8% 7.7%
Percentage of county population in
poverty* 15.5% 15.3% 17.1% 16.8%
Percentage of county population
uninsured* 19.5% 19.2% 22.3% 21.9%
Health professional
shortage area 35.8% 35.3% 38.5% 40.0%
Non-metro area 13.9% 13.8% 13.0% 16.2%
Table 2. Weighted linear regression estimates of year-over-year change in emergency department visits, United States, 2013–2014
Change in emergency
department visits (1) Coefficient (standard error) (2) (3) (4) Persistence of uninsurance
prior to 2014
Continuously insured – – – –
Transiently uninsured (0.04) 0.009 (0.04) 0.05 (0.04) 0.05 (0.04) 0.06 Persistently uninsured (0.04) 0.06 0.10** (0.04) 0.10** (0.04) (0.04) 0.10* Controls
Individual-level X X X
County-level X X
State fixed effects X
Number of observations 6,435 6,371 6,371 6,371
* p<0.05, ** p<0.01
Individual-level controls include age, sex, race/ethnicity, education, employment status, marital status, household size, household income, presence of a perceived decline in health, and presence of an ambulatory care sensitive condition. County-level controls include number of hospitals with an ED (quartiles), number of primary care physicians (quartiles), number of physician extenders (quartiles), number of federally qualified health centers (quartiles), percentage of population non-white, percentage of population unemployed, percentage of population in poverty, percentage of population uninsured, being in a health professional shortage area, and non-metro area.
Table 3. Weighted linear regression estimates of year-over-year change in primary care visits, United States, 2013–2014
Change in primary care visits
Coefficient (standard error)
(1) (2) (3) (4)
Persistence of uninsurance prior to 2014
Continuously insured – – – –
Transiently uninsured (0.31) –0.34 (0.36) –0.15 (0.36) –0.24 (0.36) –0.21 Persistently uninsured (0.50) 1.02* (0.60) 1.24* (0.60) 1.22* (0.61) 1.18 Controls
Individual-level X X X
County-level X X
State fixed effects X
Number of observations 6,435 6,371 6,371 6,371
* p<0.05, ** p<0.01
Table 4. Predicted probabilities of substitution and marginal effects by persistence of uninsurance prior to 2014, United States, 2013–2014
Outcome
Predicted probabilities (95% confidence interval) Average marginal effects
Continuously insured
Transiently uninsured
(1-11 months)
Persistently uninsured
(≥12 months)
Transiently uninsured
(1-11 months)
Persistently uninsured
(≥12 months) >ED, >PC 5.0% 4.3% 6.6% (-3.8, 3.0) -4.4 (-1.1, 3.4) 1.2 £ED, >PC 31.9% 28.7% 29.1% (-9.4, 5.8) -1.8 (-5.0, 5.7) 0.3 >ED, £PC 3.7% 8.1% 5.5% (-1.0, 8.2) 3.6 (-1.9, 2.8) 0.5 £ED, £PC 59.4% 58.9% 58.7% (-9.1, 6.4) -1.4 (-7.7, 3.7) -2.0 ED – emergency department, PC – primary care.
Table 5. Weighted multinomial logistic regression estimates of year-over-year substitution, United States, 2013–2014
Substitution Coefficient (standard error)
(1) (2) (3) (4)
Outcome categories >ED, >PC
Continuously
insured – – – –
Transiently
uninsured (0.40) –0.14 (0.40) –0.14 (0.41) –0.18 (0.41) –0.06 Persistently
uninsured (0.21) 0.30 (0.20) 0.24 (0.20) 0.25 (0.22) 0.25 £ED, >PC
Continuously
insured – – – –
Transiently
uninsured (0.18) –0.09 (0.19) –0.01 (0.19) –0.04 (0.19) –0.04 Persistently
uninsured (0.12) –0.06 (0.13) 0.04 (0.13) 0.03 (0.14) 0.05 >ED, £PC
Continuously
insured – – – –
Transiently
uninsured (0.34) 0.80* (0.36) 0.71 (0.37) 0.67 (0.37) 0.73* Persistently
uninsured (0.29) 0.39 (0.28) 0.25 (0.29) 0.22 (0.31) 0.16 £ED, £PC
(base outcome) – – – –
Controls
Individual-level X X X
County-level X X
State fixed
effects X
Number of
observations 6,435 6,371 6,371 6,371
* p<0.05, ** p<0.01
Table 6. Sensitivity analysis of year-over-year change in emergency department visits, United States, 2013–2014
Change in emergency department visits
Coefficient (standard error) Full analytic
sample Drop ages 18 to 26 >400% FPL Drop those
Include with >0 total visits in both
years Persistence of uninsurance
prior to 2014
Continuously insured – – – –
Transiently uninsured (0.04) 0.06 (0.05) 0.10* (0.06) 0.06 (0.08) 0.03 Persistently uninsured (0.04) 0.10* (0.04) 0.09* 0.12** (0.04) (0.08) 0.11
Number of observations 6,371 5,205 4,147 3,549
* p<0.05, ** p<0.01
All models are weighted and include individual- and county-level controls and state fixed effects.
Table 7. Sensitivity analysis of year-over-year change in primary care visits, United States, 2013–2014
Change in primary care visits
Coefficient (standard error) Full analytic
sample Drop ages 18 to 26 >400% FPL Drop those
Include with >0 total visits in both
years Persistence of uninsurance
prior to 2014
Continuously insured – – – –
Transiently uninsured (0.36) –0.21 (0.39) –0.47 (0.39) –0.24 (0.59) –0.67 Persistently uninsured (0.61) 1.18 (0.37) 0.92* (0.32) 0.65* (1.45) 2.62
Number of observations 6,371 5,205 4,147 3,549
* p<0.05, ** p<0.01
Table 8. Sensitivity analysis of year-over-year substitution, United States, 2013–2014
Substitution
Coefficient (standard error) Full analytic
sample Drop ages 18 to 26a >400% FPL Drop those
Include with >0 total visits in both
years Outcome
categories >ED, >PC
Continuously
insured – – – –
Transiently
uninsured (0.41) –0.06 –0.10 (–) (0.52) –0.04 (0.63) –0.28 Persistently
uninsured (0.22) 0.25 0.23 (–) (0.24) 0.54* (0.34) 0.39 £ED, >PC
Continuously
insured – – – –
Transiently
uninsured (0.19) –0.04 –0.14 (–) (0.20) 0.15 (0.23) 0.02 Persistently
uninsured (0.14) 0.05 0.06 (–) (0.14) 0.11 (0.20) 0.32 >ED, £PC
Continuously
insured – – – –
Transiently
uninsured (0.37) 0.73* 1.09 (–) (0.41) 0.76 (0.40) 0.55 Persistently
uninsured (0.31) 0.16 –0.07 (–) (0.29) 0.34 (0.37) 0.31 £ED, £PC
(base outcome) – – – –
Number of
observations 6,371 5,205 4,147 3,549
a Weighted variance matrix was nonsymmetric, standard errors and p-values not obtained.
* p<0.05, ** p<0.01
Table 9. Stratified marginal effects of persistence of uninsurance prior to 2014
on year-over-year utilization of emergency departments and primary care, United States, 2013–2014
Outcome
Average marginal effect (95% confidence interval)
Payer typea (2014) Declinable pre-existing condition (2012) Ambulatory care sensitive condition (2013)
Private Public No Yes No Yes
ED visits (change in visits)
Continuously insured – – – – – –
Transiently uninsured (-0.02, 0.07 0.16) 0.09 (-0.13, 0.30) 0.10 (-0.01, 0.22) 0.27 (-0.02, 0.57) 0.10* (0.01, 0.20) -0.13 (-0.32, 0.07) Persistently uninsured (-0.03, 0.03
0.09) 0.24** (0.07, 0.41) 0.06 (-0.09, 0.21) –0.11 (-0.35, 0.13) 0.09* (0.003, 0.17) 0.10 (-0.07, 0.28) PC visits (change in visits)
Continuously insured – – – – – –
Transiently uninsured (-1.00, -0.31 0.38) -0.44 (-2.42, 1.55) -0.13 (-1.40, 1.14) 0.03 (-2.75, 2.80) –0.11 (-0.86, 0.64) –0.65 (-2.21, 0.92) Persistently uninsured (-0.34, 0.06
0.47) 1.94 (-0.26, 4.14) 2.62 (-0.82, 6.06) 0.87 (-1.43, 3.17) 0.42 (-0.01, 0.84) 3.31 (-0.64, 7.26) Substitution (percentage point change in predicted probability)
>ED, >PC
Continuously insured – – – – – –
Transiently uninsured -0.5 (-4.7, 3.7) 1.0 (-8.3, 10.2) 4.1 (-4.4, 12.6) -2.8 (-11.0, 5.3) 0.8
(-3.3, 4.9) (-7.9, 0.0) -4.0* Persistently uninsured -0.7
(-3.1, 1.7) 2.9 (-1.9, 7.7) 0.8 (-2.3, 3.8) -3.7 (-11.0, 3.7) 0.6
(-1.7, 2.9) (-4.1, 8.4) 2.1 £ED, >PC
Continuously insured – – – – – –
Transiently uninsured -3.3 (-11.3, 4.8) 0.6 (-12.8, 14.0) -8.7 (-21.1, 3.7) -3.2 (-22.9, 16.6) -2.5 (-11.2, 6.1) 1.7 (-13.6, 17.0) Persistently uninsured -1.6
(-8.0, 4.8) 2.4 (-6.1, 11.0) 1.2 (-7.1, 9.6) 3.9 (-14.4, 22.2) 1.5 (-4.2, 7.2) -1.2 (-14.0, 11.6) >ED, £PC
Continuously insured – – – – – –
Transiently uninsured 2.8 (-1.6, 7.3) 4.6 (-2.5, 11.8) 0.5 (-4.2, 5.3) -2.7 (-7.4, 2.1) 4.6
(-0.8, 10.1) (-6.9, 3.8) -1.5 Persistently uninsured -0.8
(-3.2, 1.5) 3.6 (-1.0, 8.2) 0.7 (-2.3, 3.7) -5.3** (-7.2, -3.3) 0.3
£ED, £PC
Continuously insured – – – – – –
Transiently uninsured 1.0 (-7.8, 9.7) -6.2 (-20.1, 7.6) 4.1 (-9.2, 17.3) 8.7 (-12.2, 29.6) -2.9 (-11.5, 5.7) 3.8 (-12.3, 19.7) Persistently uninsured 3.1
(-4.0, 10.2) -8.9* (-17.6, -0.2) -2.7 (-11.6, 6.2) 5.0 (-13.2, 23.3) -2.5 (-8.6, 3.7) -0.3 (-13.5, 12.8)
Number of observations 6,371 2,762 6,371
ED – emergency department, PC – primary care. * p<0.05, ** p<0.01
a Payer type models also include controls for state Medicaid expansion status, number of Marketplace insurers
CHAPTER 3: IS THERE A DELAYED EFFECT OF COVERAGE GAINS UNDER THE AFFORDABLE CARE ACT ON AVOIDABLE ED VISIT RATES?
Introduction
Potentially avoidable visits to the emergency department are an indication of missed opportunities for the health care system and patients—for earlier intervention in disease, developing an ongoing relationship with a primary care provider and/or practice, and assessing social needs. A study of a single large commercial insurer suggests that care for “low-acuity” conditions has shifted away from ED settings (Poon et al., 2018) but it is unclear if this finding is generalizable to the wider insured population. Those findings could be driven by changes in plan generosity (e.g., increasing deductibles and copayments) or enrollment composition of the single national insurer in their study (Aetna), or reflective of an increase in the supply of non-ED care settings.
The ACA expanded health insurance coverage in the non-elderly adult population through the dependent coverage provision, establishing a health insurance Marketplace with key consumer protections, and by expanding Medicaid eligibility. The dependent coverage provision took effect in September 2010, six months after the passage of the ACA, allowing young adults to remain on their parents’ health insurance plan up to age 26. The Marketplace, as the collection of federally and state-run health insurance exchanges is known, provides access to guaranteed issue health insurance coverage with premium subsidies available to those between 100% and 400% of the federal poverty level, as long as employer-based coverage is not already available. Medicaid expansion, if adopted by a state, allows residents with incomes up to 138% of the federal poverty level to enroll in Medicaid regardless of failure to meet prior categorical eligibility requirements (e.g., pregnant women, parents of young children).