THE HIGH FREQUENCY ECONOMICS OF GOVERNMENT BOND MARKETS
Giang Thi Huong Nguyen
A dissertation submitted to the faculty of the University of North Carolina at Chapel Hill in partial fulfillment of the requirements for the degree of Doctor of Philosophy in the Department of Economics.
Chapel Hill 2014
Approved by:
Eric Ghysels
Michael Fleming
Neville Francis
Jonathan Hill
Adam Reed
©2014
Giang Thi Huong Nguyen ALL RIGHTS RESERVED
ABSTRACT
Giang Nguyen: The High Frequency Economics of Government Bond Markets (Under the Direction of Eric Ghysels)
This dissertation is a collection of four essays examining different aspects of government bond markets,
with a special focus on the US Treasury securities. The first is a study of the microstructure of BrokerTec, the
larger of the two electronic interdealer trading platforms for US Treasury securities, providing institutional
background essential for subsequent studies. We characterize empirically market activities and the price
discovery process. We show that both limit orders and trades affect prices, and that these effects are greater
around monetary policy announcements. Contrary to previous findings pertaining to equity markets, we find
that iceberg orders, which allow traders to hide liquidity, are not used frequently, even around volatile times.
The second essay examines a frequently used channel of hidden liquidity – the workup protocol. We
ask whether trading activities during workups contain any private information and leave harmful effects on
uninformed traders. We find that workup activities account for a significant portion of market liquidity not
ex ante observable, but they tend to be less informative than transparent trades. We show that workups are
used more often, but contain relatively less information, around volatile times, indicating that workups tend
to be used as a channel to guard against adverse price movements, rather than as a channel to hide private
information.
In the third essay, we propose a novel model to study jointly the intraday dynamics of liquidity and price
risks, two important determinants of bond yields. We show that liquidity declines sharply during the 2008
crisis and on flight–to–safety days, accompanied by increased price volatility. Our model reveals a negative
feedback effect between liquidity and volatility, and that each becomes more persistent during the crisis.
The fourth study provides an international perspective by studying the propagation of liquidity and
volatility shocks during the 2010-2012 sovereign debt crisis across major euro-area bond markets, namely
Belgium, France, Germany, Italy, the Netherlands, and Spain. We show that liquidity is generally the more
important source of shocks transmitted across the borders, and this transmission largely originates from Italy
and around the Italian crisis.
ACKNOWLEDGEMENTS
Over the last five years, I have received help, support and encouragement from a great number of
individuals without whom this dissertation would not have been possible. First and foremost, I would like to
thank Dr. Eric Ghysels for always being there to provide guidance and inspiration. I have grown so much as
a researcher thanking to his mentoring. I am also indebted to Dr. Michael Fleming, who has been extremely
generous with his time and resources, for providing very helpful and detailed feedback on my work. I greatly
appreciate insightful comments and suggestions from Dr. Neville Francis, Dr. Jonathan Hill and Dr. Eric
Renault during various stages of this dissertation. I would like to thank Dr. Adam Reed for broadening my
prospective and offering great career advice. I would like to thank Dr. Helen Tauchen for her resourcefulness
and encouragement. I thank Toan Phan, a faculty member and a friend, for his willingness to listen and
provide feedback. I thank my friends, including my fellow doctoral students, for their help, support and
friendship over the years.
I would like to thank Weiling Liu and Neel Krishnan, formerly at the Federal Bank of New York, for
tremendous help with data processing and analysis. I thank Rita Moss, Michele Hayslett and the data team at
the UNC Library for acquiring the European bond market data used in the last chapter of this dissertation.
I also thank Arthur D’Arcy, Dan Cleaves, and Stuart Wexler from ICAP for clarifying how the BrokerTec
platform works, and James Greco from Jefferies for helpful information on the trading of U.S. Treasury
securities.
This dissertation is written with the financial support from the UNC Graduate School’s Lovick P. Corn
Dissertation Fellowship, made possible by a generous gift from the late Mr. Lovick Pierce Corn. Mr. Corn’s
legacy and generosity will always be remembered. In addition, the financial support from the Kampf Family
for my graduate study and research is gratefully acknowledged.
Last but not least, I would like to thank my family for their unconditional love. Words cannot express
how grateful I am for everything my husband Anh, my parents, and my mother in law have done to support
my academic pursuit. My double bundle of joy, Khuˆe and K`y, are truly a blessing and I thank them everyday
for making my life super fun (and super busy, of course).
TABLE OF CONTENTS
LIST OF TABLES . . . x
LIST OF FIGURES . . . xii
1 INTRODUCTION . . . 1
2 THE MICROSTRUCTURE OF A US TREASURY ECN . . . 5
2.1 Introduction. . . 5
2.2 Market Structure . . . 9
2.2.1 The Electronic Platforms . . . 10
2.2.2 The Voice-Assisted Brokers: GovPX . . . 11
2.3 Data . . . 12
2.3.1 Data Processing . . . 12
2.3.2 Trends in Trading Activity . . . 13
2.3.3 Liquidity Around the Clock . . . 14
2.3.4 Spreads . . . 14
2.3.5 Market Depth . . . 15
2.3.6 Hidden Depth . . . 16
2.4 Price Impact of Trades . . . 17
2.4.1 Baseline Specification . . . 18
2.4.2 Separate Effects of Trade Direction and Size . . . 19
2.4.3 Asymmetric Effects of Buys and Sells . . . 20
2.4.4 Asymmetric Effects on the Bid and Ask . . . 21
2.5 Price Impact of Limit Orders . . . 22
2.5.1 Price Impact of Limit Orders . . . 23
2.5.2 Market Impact Following FOMC Announcements . . . 24
2.6 Hidden Orders . . . 26
2.6.1 Descriptive Analysis of Hidden Orders . . . 26
2.6.2 Determinants of Hidden Orders . . . 27
2.6.3 Determinants of Hidden Volume . . . 31
2.7 Conclusion . . . 32
3 DARK POOL TRADING IN THE US TREASURY MARKET . . . 53
3.1 Introduction. . . 53
3.2 The Workup Process . . . 59
3.2.1 Market Overview . . . 59
3.2.2 The Workup Process . . . 61
3.2.3 The BrokerTec Data . . . 62
3.2.4 Univariate Analysis of Workup Activities . . . 64
3.2.4.1 Trading and Workup Activities . . . 64
3.2.4.2 Intradaily Pattern of Workup Usage . . . 65
3.2.4.3 Workups and Order Flow . . . 66
3.2.4.4 Direction of Workup Volume Expansion . . . 66
3.3 Informational Value of Workup Trades . . . 68
3.3.1 A Microstructure Model of Price and Trade . . . 68
3.3.2 Permanent Price Impact of Trades . . . 71
3.3.3 Information Content of Workup Trades . . . 72
3.3.4 Information Structure on Special Days . . . 74
3.3.4.1 Announcement Days . . . 74
3.3.4.2 Volatile Days . . . 75
3.3.4.3 Days with Extreme Net Order Flow . . . 75
3.3.5 Comparison with Standard Model of Price Impact of Trades . . . 76
3.3.6 Is Direction of Workup Expansion Informationally Relevant? . . . 77
3.4 Determinants of Workup Trades . . . 78
3.5 Conclusion . . . 82
4 INTRADAY DYNAMICS OF VOLATILITY AND LIQUIDITY IN THE US TREA-SURY MARKET . . . 99
4.1 Introduction. . . 99
4.2 The U.S. Treasury Market – Some Stylized Facts . . . 104
4.2.1 Data Description . . . 104
4.2.2 Some Stylized Facts . . . 106
4.3 A New Class of Dynamic Limit Order Book Models . . . 110
4.3.1 Multiplicative Error Model for nonnegative Valued Processes . . . 111
4.3.2 Model Specification . . . 113
4.3.3 Measurement of Volatility . . . 114
4.3.4 Diurnal Pattern Adjustment . . . 116
4.4 Empirical Analysis . . . 117
4.4.1 The Baseline Model . . . 117
4.4.2 Announcement Effects . . . 119
4.4.3 Dynamics During Crisis . . . 120
4.4.4 Limit Order Book Dynamics and the News Impact Curve . . . 121
4.4.5 Effect of Liquidity Demand . . . 122
4.5 Liquidity and Volatility During Flights to Safety . . . 123
4.5.1 Identification of Flights to Safety . . . 123
4.5.2 How Different Are Flight-to-Safety Days? . . . 125
4.5.3 Liquidity and Volatility Dynamics and Flights to Safety . . . 126
4.6 Conclusion . . . 127
5 VOLATILITY AND LIQUIDITY SPILLOVERS DURING THE EURO AREA SOVEREIGN DEBT CRISIS . . . 144
5.1 Introduction. . . 144
5.2 Data . . . 148
5.2.1 European Sovereign Bond Markets . . . 148
5.2.1.1 Bond Market Volatility . . . 149
5.2.1.2 Market Liquidity . . . 150
5.2.2 Market Variables . . . 151
5.2.3 The European Sovereign Debt Crisis . . . 152
5.3 Model . . . 154
5.3.1 Modeling Dynamic Interdependencies . . . 155
5.3.2 Effects of General Market Conditions . . . 156
5.3.3 Spillover Measures . . . 157
5.3.4 Measuring Time-Varying Spillovers . . . 158
5.3.5 Modeling Considerations . . . 160
5.4 Full Sample Analysis of Spillovers . . . 161
5.4.1 Model Estimates . . . 161
5.4.1.1 Feedback Effects . . . 161
5.4.2 Effects of Market Conditions . . . 162
5.4.2.1 Correlation of Liquidity and Volatility Innovations . . . 163
5.4.3 Volatility and Liquidity Spillovers . . . 163
5.4.3.1 Bilateral Spillovers . . . 163
5.4.3.2 Intra-Country Spillovers . . . 164
5.4.3.3 Inter-Country Spillovers . . . 164
5.5 The Dynamics of Spillovers . . . 165
5.5.1 Trends in Aggregate Spillovers . . . 166
5.5.2 Inter-Country Shock Transmission: A Decomposition . . . 167
5.5.3 The Dynamics of Italy’s Systemic Role . . . 168
5.6 Conclusion . . . 168
A ECONOMIC ANNOUNCEMENTS . . . 183
A.1 Macroeconomic Announcements . . . 183
A.2 Monetary Policy Announcements . . . 183
A.3 Treasury Auction Result Announcements . . . 184
B FLIGHT-TO-SAFETY EPISODES DURING 2006-2010Q2 PERIOD . . . 185
C OVERVIEW OF THE EUROPEAN GOVERNMENT BOND MARKET . . . 187
C.1 Market Overview. . . 187
C.2 Relevant Statistics for Six Select Countries . . . 188
REFERENCES . . . 192
LIST OF TABLES
2.1 Trading Activity . . . 35
2.2 Average Bid-Ask Spread and Inter-Tier Price Distance . . . 36
2.3 Limit Order Book Depth . . . 37
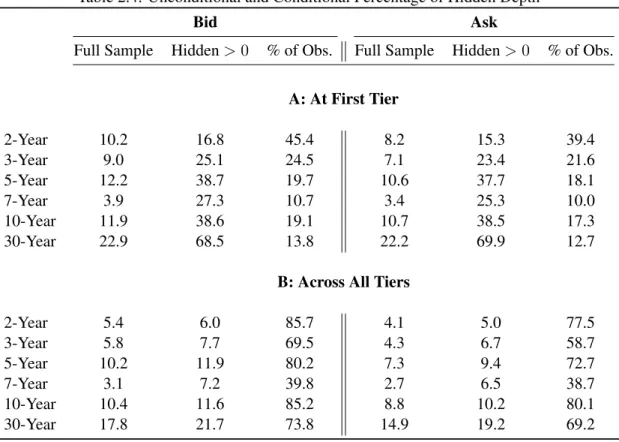
2.4 Unconditional and Conditional Percentage of Hidden Depth . . . 38
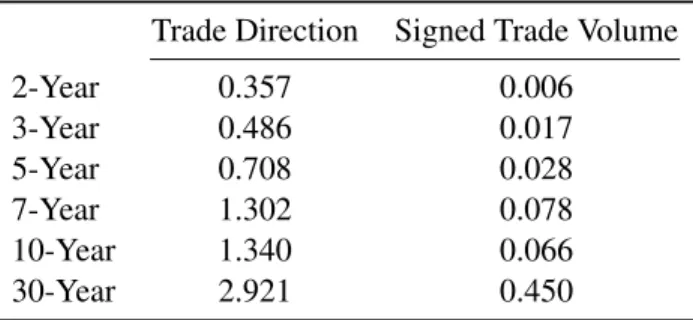
2.5 Baseline Price Impact of Trades . . . 39
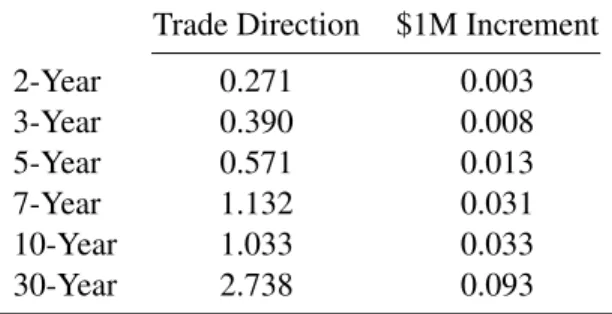
2.6 Separate Price Impact of Trade Direction and Size . . . 40
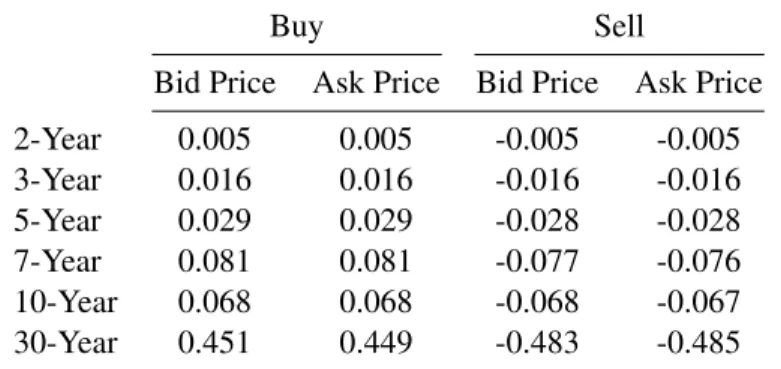
2.7 Price Impact of Buyer-Initiated versus Seller-Initiated Trades . . . 41
2.8 Bid and Ask Price Impact of Buys and Sells (VECM) . . . 42
2.9 Price Impact of Trades and Limit Orders . . . 43
2.10 Price Impact of Trades After FOMC Announcements . . . 44
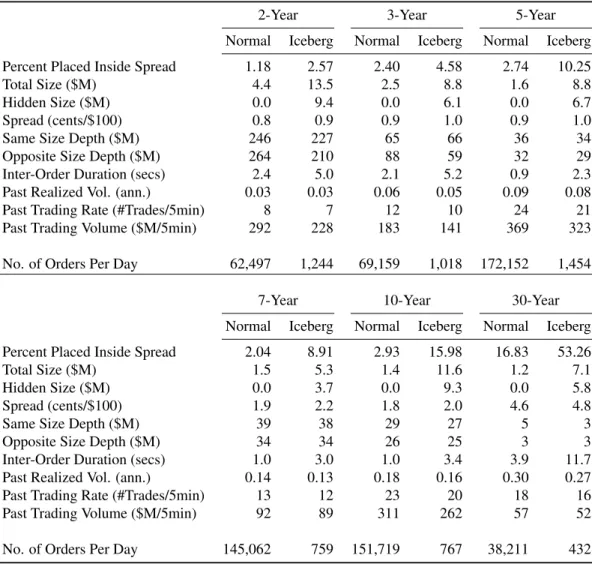
2.11 Descriptive Statistics of Normal versus Iceberg Orders . . . 45
2.12 Hidden Order Choice Model . . . 46
2.13 Determinants of Hidden Size Conditional on Hidden Order Choice . . . 47
3.1 Summary Statistics of Trading and Workup Activities . . . 85
3.2 Correlations of Workup and Order Flow Variables . . . 86
3.3 Permanent Price Impact of Segmented Order Flow . . . 87
3.4 Share of Trade and Non-Trade Related Information . . . 88
3.5 Information Structure on Days with Announcements and Extreme Market Movements . . . 89
3.6 Informational Content of Segmented versus Generic Order Flow . . . 90
3.7 Information Share of Workup Trades by How Workup Volume Arises . . . 91
3.8 Determinants of Workups . . . 92
4.1 Summary Statistics of Depth and Volatility . . . 129
4.2 Average Daily Trading Volume and Number of Trades on FTS and non-FTS days . . . 130
4.3 Liquidity Dynamics With Flight-to-Safety Effect . . . 131
4.4 Volatility Dynamics With Flight-to-Safety Effect. . . 132
4.5 Liquidity and Volatility Dynamics: Baseline Estimates for 2-Year Treasury Note . . . 133
4.6 Liquidity and Volatility Dynamics With Announcement Effects for 2-Year Treasury Note . . . . 134
4.7 Liquidity and Volatility Dynamics With Crisis Period and Announcement Effects for 2-Year Treasury Note . . . 135
4.8 Liquidity and Volatility Dynamics With News Impact Curve for 2-Year Treasury Note . . . 136
4.9 Liquidity and Volatility Dynamics With Trading Volume Effects for 2-Year Trea-sury Note . . . 137
5.1 Descriptive Statistics of Volatility and Liquidity . . . 170
5.2 Correlation of Liquidity and Volatility Across Markets . . . 171
5.3 Model Estimates – Feedback Effects . . . 172
5.4 Model Estimates – Effects of Aggregate Market Conditions . . . 173
5.5 Correlation of Residuals . . . 174
5.6 Bilateral Spillover Matrix . . . 175
5.7 Intra-Country Spillovers . . . 176
5.8 Inter-Country Spillovers . . . 176
C.1 European Bond Market . . . 187
C.2 Country Statistics . . . 189
LIST OF FIGURES
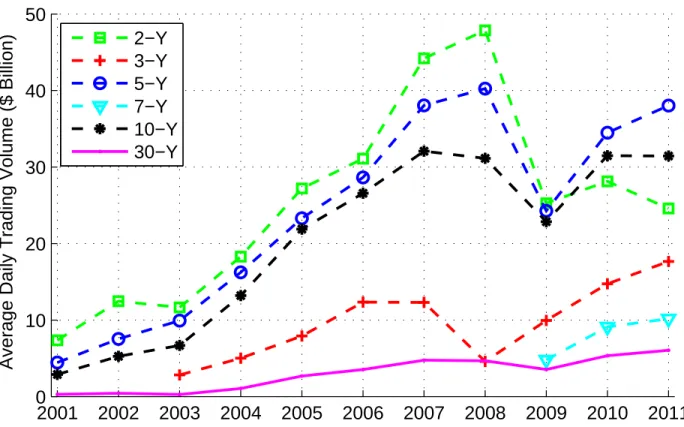
2.1 Trading Activity Over Time. . . 48
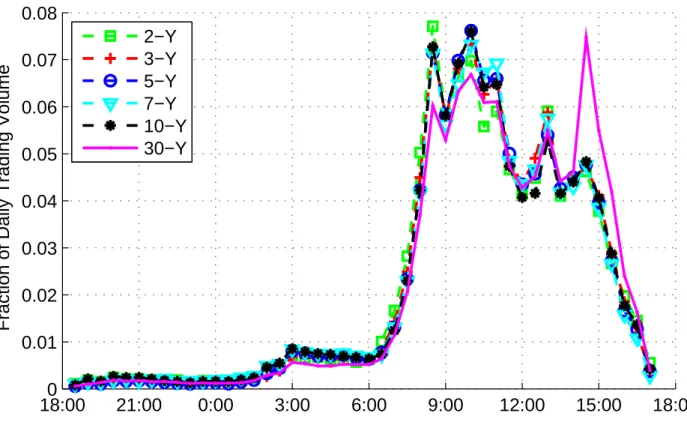
2.2 Round-the-Clock Trading Activity . . . 49
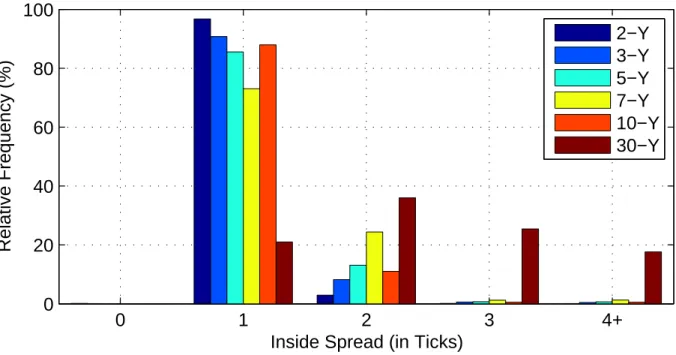
2.3 Frequency Distribution of Inside Spread . . . 50
2.4 Displayed and Hidden Liquidity at the First Five Tiers . . . 51
2.5 Non-linear Price Impact of Trade Size . . . 52
3.1 Workup Activity over Time . . . 93
3.2 Intraday Pattern of Workup Probability . . . 94
3.3 Which Side Do Workups Expand? . . . 95
3.4 Cumulative Impulse Response of Price to Trade . . . 96
3.5 Permanent Price Impact of Trade . . . 97
3.6 Information Share of Pre-Workup and Workup Order Flow . . . 98
4.1 Daily Liquidity and Volatility at First Price Tier of 2-Year Treasury Note . . . 138
4.2 Daily Bid-Ask Spread at First Price Tier . . . 139
4.3 Intraday Patterns of Liquidity and Volatility at First Price Tier of 2-Year Treasury Note . . . 140
4.4 2-Year Treasury Note’s Depth, Trading Volume and Price Volatility on Days With and Without Key Announcements . . . 141
4.5 Comparison of Realized Volatility Measures: Price Changes or Yield Changes? . . . 142
4.6 Liquidity and Volatility on FTS and non-FTS days . . . 143
5.1 The Euro Area Sovereign Debt Crisis . . . 177
5.2 Time Series Variation in Euro Area Bond Market Volatility . . . 178
5.3 Time Series Variation in Euro Area Bond Market Liquidity . . . 179
5.4 Dynamics of Total Spillover Among Key European Government Bond Markets . . . 180
5.5 The Sources of Shocks that Travel Across Borders . . . 181
5.6 The Systemic Role of Italy. . . 182
C.1 Trading Activity By Country . . . 190
C.2 Intraday Pattern of Trading Activity . . . 191
CHAPTER 1 INTRODUCTION
This dissertation is a collection of four essays on the high–frequency economics of government bond
markets, with a special focus on the market for securities issued by the U.S. Government. Currently, the total
outstanding amount of US Treasury securities exceeds $11 trillion. This market serves many vital roles in the
financial system, not only in the U.S. but also around the globe with foreign countries holding nearly half of
all Treasuries outstanding. The securities’ creditworthiness and sheer liquidity make them a main instrument
of monetary policy, a key store of value, a crucial source of collateral for financial transactions and a pricing
benchmark for other financial assets.
The need to understand market dynamics in this important market at increasingly high frequencies arises
from recent trends in trading. Since the Securities and Exchange Commission (SEC) authorized electronic
markets in 1998, speed competition and technological advancements have turned the trading environment into
one highly automated by computer algorithms and in which even a few milliseconds can affect the trading
outcome (e.g., the Flash Crash of May 2010). The past few years have seen a growing body of literature
seeking to further our knowledge of the new high speed trading environment. However, most research
addresses equities markets. The Treasury market, despite its vital roles, remains much less studied, in part
due to data availability (or lack thereof). The dissertation helps bridge this gap by providing a comprehensive
analysis of this market along several dimensions of great interest to market participants, policy makers and
academic researchers.
The first essay provides a detailed examination of an electronic trading platform for US Treasury
securities, the BrokerTec platform (the larger of the two electronic interdealer trading platforms). Our
findings suggest a level of liquidity on the BrokerTec platform that is improving over time and markedly
greater than that found by other studies using data from the period before trading in these Treasury securities
went electronic.
Importantly, we examine the price impact of not only trades but also of order book activities not previously
available for the Treasury market. In fact, given the sheer amount of limit order book activities in comparison
to trades, there is a lot to be learned about how these activities affect price dynamics. Furthermore, limit
orders are often considered as supplying liquidity and market orders consuming it. Accordingly, our study
can delineate the response of price to shocks in liquidity supply from that to shocks in liquidity demand. and
show that limit orders as well as trades affect prices. In particular, the price impacts are found to be greater
around monetary policy announcements, an important type of information events in this market.
In addition, we shed lights on the use of iceberg orders to hide liquidity in this fixed income market, an
analysis not heretofore possible for Treasury securities. Several of our findings are consistent with the equity
market evidence, but more importantly, we contribute evidence novel to the U.S. Treasury market. We find
that iceberg orders are used much less often than in other markets examined in the literature. Furthermore,
contrary to some earlier evidence on iceberg orders in equity markets, we find that Treasury traders are less
likely to use iceberg orders when they post more aggressively priced limit orders, or when the market is more
volatile, precisely when traders need greater protection.
The puzzling lack of popularity of iceberg orders contrasts sharply with the high usage of the workup
protocol, an alternative mechanism to hide liquidity. This is the main subject of the second study. We examine
this protocol and ask whether trading activities induced by this protocol, which generally account for more
than half of market liquidity, are motivated by private information.
The contribution of this work extends beyond a study of a specific microstructure feature of the U.S.
Treasury market. First, the workup mechanism is essentially a dark pool trading mechanism. Our study
provides the first set of evidence on dark pool trading in a fixed income market setting. It is therefore a timely
addition to the literature on dark pool trading and the current discussion among researchers and policy makers
on the effects and implications of dark pool activities on market quality and welfare. We find that volatility
tends to generate more workups, but that those workups tend to be less informative, suggesting the value of
this dark pool mechanism in protecting traders against adverse price movements. In general, the amount of
private information hidden in this Treasury dark pool is quite small, easing concerns that the dark pool could
harm less informed traders.
Secondly, our work helps inform the current debate on market design response to high frequency trading.
High frequency trading, or computer-driven trading in general, has increased significantly over the last few
years – a trend dubbed “rise of the machines” in Chaboud et al. (2013). There is a continual need to devise
new market design features to keep up with changing trends in trading, and to understand the implications of
those features. The BrokerTec market design with the workup protocol fits neatly into this discussion via
an interesting mix of continuous auction (the limit order book) and periodic call auctions (workups). Our
empirical results readily provide a glimpse of the implications of such a market feature on price discovery
and trading patterns.
With the first two studies providing a micro foundation for our understanding of the trading environment
in the US Treasury market, the third study aims to understand the dynamics of liquidity and volatility, two
important determinants of Treasury securities values. To this end, we propose a new class of econometric
models to capture jointly the dynamics of liquidity and volatility at a high frequency interval (i.e.,
five-minute). Our models address several interesting questions for the US Treasury market. Is liquidity supply
available when it is needed most? How is liquidity supply driven by uncertainty and other market factors, and
conversely, does the supply of liquidity have any role in dampening or magnifying volatility in the market?
How do the dynamics of the Treasury limit order book differ around the time of economic announcements,
through the recent financial crisis, and during flight-to-safety episodes? Most of the previous studies use data
prior to the 2008 crisis period, leaving market dynamics during the crisis – the most serious to hit the global
economy since the Great Depression – much less understood.
We show that liquidity posted in the order book is lower on flight-to-safety days, when liquidity is
especially needed. However, a high level of trading activity is also observed on those days, along with an
elevated level of price uncertainty. These patterns collectively suggest that liquidity providers monitor the
market more closely on these days and refrain from using limit orders to passively supply liquidity to the
market. In general, price volatility and liquidity supply at the best price tier are negatively interrelated and
each becomes more persistent during the crisis. This dangerous combination provides a great illustration to
models of liquidity crashes (for example, Cespa and Foucault (2012)) in that bad shocks to either volatility or
liquidity can intensify the negative feedback effect, leading to liquidity crashing while volatility spiking up.
Our models also provide consistent evidence with the earlier literature that depth is withdrawn immediately
before important economic announcements but then quickly gets refilled once the announcement is released,
accompanied by a surge in trading activity and price uncertainty.
If the third essay focuses solely on the interaction between volatility and liquidity within the same bond
market, namely the market for US Treasury securities, the final essay provides an international perspective by
studying shock transmission across multiple bond markets. Shock propagation during a crisis is a particular
concern for policy makers. The euro area sovereign debt crisis provides a valuable opportunity to study bond
market linkages and spillover effects. In addition, with some of the bond markets in the area being among the
largest in the world, only after the US and Japan markets, the findings of this study complement nicely what
we have learned from the US government bond market.
We first measure spillovers via a forecast error variance decomposition of a vector autoregressive model,
which captures jointly the dynamics of liquidity and volatility in the government bond markets of Belgium,
France, Germany, Italy, the Netherlands, and Spain. The model controls for common trends in sovereign
credit risk, financial sector credit risk, funding conditions, aggregate default risk, and proxies for regional and
global risk aversion. As in the US Treasury market, liquidity and volatility in these euro area bond markets are
closely inter-related, but we show that liquidity is generally the stronger force driving this inter-relationship.
We further show that liquidity is more responsive to macroeconomic developments and also the more
important source of shocks transmitted across borders during the euro-area sovereign bond crisis. Our
framework permits an assessment of the systemic role of each bond market during the crisis. The evidence
consistently points to Italy as the sole net sender of liquidity shocks to other countries in the region.
Furthermore, this transmission is greatest around the Italian crisis, as compared to that around the crisis
associated with the other smaller sized periphery countries (i.e., Greece, Ireland, Portugal and Spain).
CHAPTER 2
THE MICROSTRUCTURE OF A US TREASURY ECN
2.1 Introduction
Since the early 2000’s, trading in the U.S. Treasury securities market has migrated from voice-assisted
brokers to fully electronic platforms (Mizrach and Neely (2006)). For the most recently auctioned securities
in particular, the transition has been nearly complete, with nearly all interdealer trading now taking place via
one of two electronic communications networks, BrokerTec and eSpeed (Barclay et al. (2006)). BrokerTec
accounts for about 60% of trading activity (based on comparison with earlier studies using data from eSpeed).
This chapter assesses the microstructure of the U.S. Treasury securities market using tick data from
BrokerTec. It is the first paper to closely study a U.S. Treasury market electronic communications network
(ECN) and one of the first to analyze any fixed income market ECN.1Many previous papers have examined
the microstructure of the Treasury market using data from GovPX, which consolidates data from
voice-assisted brokers.2 The migration of bond trading to the electronic platforms (which do not contribute to
GovPX) has sharply reduced GovPX coverage of the interdealer market, as noted by Boni and Leach (2004)
and others. The breadth of the BrokerTec tick data allows us to provide a comprehensive analysis of the
market’s microstructure as orders enter and leave the order book, and characterize market liquidity beyond
1
Campbell and Hendry (2007) examine price discovery in the 10-year note using transactions data from BrokerTec. Mizrach and Neely (2006) estimate bid-ask spreads and market impact using transactions data from eSpeed. Additional studies examine the euro area sovereign debt market using data from MTS (e.g., Cheung et al. (2005), Menkveld et al. (2005), and Beber et al. (2009)). In addition, since the first draft of this chapter, there are several studies that look at different aspects of this market, including Dungey et al. (2013) for trade duration on eSpeed, Engle et al. (2012c) for intraday dynamics of market liquidity and volatility on BrokerTec, and Fleming and Nguyen (2013) for the order flow segmentation induced by the workup protocol on BrokerTec and the informational content of workup and non-workup trades.
2Fleming (1997) characterizes intraday liquidity, Fleming and Remolona (1997), Fleming and Remolona (1999), Balduzzi et al. (2001), Huang et al. (2002), and Fleming and Piazzesi (2005) look at announcement effects, Fleming (2002) examines the relationship between issue size and liquidity, Fleming (2003), Brandt and Kavajecz (2004), Green (2004), and Pasquariello and Vega (2007) assess the information content of trades, Goldreich et al. (2005) gauge the relationship between liquidity and value, and Brandt et al. (2007), Campbell and Hendry (2007), and Mizrach and Neely (2008) compare the information content of trades in spot and futures markets.
the inside tier for the first time. This is an important improvement, as the BrokerTec data shows that the inside
tier depth is often not greatest in the book, and accounts for only a small fraction of the book’s total depth.3
In addition, electronic trading facilitates greater speed of order manipulation and execution, permits an
increased role for computer-driven and automated trading processes, and enables better market information
collection, dissemination and processing. Coupled with the rise in electronic trading is a newly emergent
trend in high frequency and/or algorithmic trading, the so-called “rise of the machines” (Chaboud et al.
(2013)). Therefore, there is a great interest in understanding this new market structure and its level of trading
activity and market liquidity from both academic and practitioner points of view.
Using tick data from 2010 to 2011, we characterize trading activity and liquidity on the BrokerTec
platform for the on-the-run 2-, 3-, 5-, 7-, 10-, and 30-year Treasury securities.4 Our findings suggest a level
of liquidity on the BrokerTec platform that is improving over time and markedly greater than that found by
earlier studies using data from GovPX. Since BrokerTec’s inception, trading activity has grown many folds,
e.g., starting at below $5 billion per day in 2001 to between $30-40 billion per day in 2011 for the 5- and
10-year notes. Over the 2010-2011 period, inside bid-ask spreads for maturities of five years or less average
less than 1/100th of one percent. An average of over $300 million is available on the platform at the best
price on either side for the 2-year note, $80 million for the 3-year note and in the $30 million range for each
of the three remaining notes. There are even greater amounts available at the adjacent price tiers. Across the
whole book, there is about $2.4 billion on each side for the 2-year note, $700 million for the 3-year note, and
around $400 million for the 5- and 10-year notes.
Besides being the first to provide a comprehensive picture of a U.S. Treasury ECN, we make two further
contributions. First, while previous studies have assessed price impact using GovPX trade data (e.g. Fleming
(2003), Brandt and Kavajecz (2004), and Green (2004)), we examine the price impact of not only trades but
also of order book activities not previously available for the Treasury market. In fact, given the sheer amount
of limit order book activities in comparison to trades, there is a lot to be learned about how these activities
affect price dynamics. Furthermore, limit orders are often considered as supplying liquidity and market orders
consuming it. Accordingly, it is important to delineate the response of price to shocks in liquidity supply
from that to shocks in liquidity demand.
3This fact has also been documented for equity limit order markets (e.g., Biais et al. (1995)). 4
On-the-run securities are the most recently auctioned securities of a given maturity
We first calculate the permanent price impact of trades following the framework in Hasbrouck (1991a).
We then extend this model to include limit order flow, separately for the bid and ask sides. Our work builds
upon earlier studies of equity markets that incorporate order book information into the market impact function
(e.g., Engle and Patton (2004), and Mizrach (2008)). A recent paper by Hautsch and Huang (2012a) uses a
vector error correction model to analyze the dynamics of the limit order book for select NASDAQ stocks, and
compute the price impact of orders of different types, sizes, and levels of price aggressiveness. They show
that limit orders also have significant market impact.
We find that the price impact of trades on BrokerTec is quite small, but increases in maturity of the
securities considered, ranging from 0.006/256th for the 2-year note to 0.450/256th for the 30-year bond per
$1 million buyer-initiated volume. Equivalently, it takes about $182 million in signed trading volume to
move the price of the 2-year note by 1/256th of one percent of par, whereas the required volume is only $2.2
million to move the price of the 30-year bond by the same amount. Moreover, limit order activities affect
prices, and play an especially large role in the price dynamics of longer-dated maturities. Accounting for
the impact of limit order activities on trading activities and price dynamics, the price impact of trades is
about 9-14% lower for the 2-, 5-, 10-, and 30-year securities, and 26% and 40% lower for the 3- and 7-year
notes, respectively. Our analysis also shows that trades and especially limit orders have a larger price impact
immediately following Federal Open Market Committee (FOMC) rate decision announcements.
Another contribution lies in our analysis of hidden liquidity in the form of iceberg orders. The ability to
enter “iceberg” orders (partially hidden orders) on the BrokerTec platform allows analyses not heretofore
possible for Treasury securities.5 Hidden orders in equity markets have been examined by Harris (1996),
Aitken et al. (2001), Hasbrouck and Saar (2002), Anand and Weaver (2004), Tuttle (2006), De Winne and
D’Hondt (2007a), De Winne and D’Hondt (2007b), Bessembinder et al. (2009), Pardo and Pascual (2012),
and Hautsch and Huang (2012b), among others. We add to this literature by providing the first analysis of
iceberg orders in the trading of Treasury securities. In particular, we study traders’ order submission decision
and explore whether certain order characteristics as well as prevailing market conditions might help predict
the likelihood as well as the extent of hidden size of an iceberg order.
Several of our findings are consistent with the equity market evidence. For example, the use of hidden
depth increases with order size and the prevailing bid-ask spread, intuitively highlighting the benefit of hidden
5Iceberg orders are not used on eSpeed, the other electronic platform for trading U.S. Treasury securities, leaving BrokerTec the only venue to study traders’ choice with respect to such hidden orders.
orders as a mechanism to prevent information leakage and mitigate adverse selection risk. Additionally, when
there is lower prevailing depth or lower likelihood of future orders whose display size will take precedence
over the current hidden size, hidden orders tend to be used more often, as the cost of using them in terms of
execution probability is lower.
Perhaps more valuable is our contribution of findings that are novel to the U.S. Treasury market. We
find that iceberg orders are used much less often than in other markets examined in the literature. Typically
iceberg orders account for less than 2% of order flow in the Treasury market, compared to 18% for stocks on
Euronext-Paris (Bessembinder et al. (2009)), and 9% for 30 German blue chip stocks on Deutsche Borse’s
Xetra platform (Frey and Sandas (2012). Furthermore, contrary to the evidence documented in Bessembinder
et al. (2009) that traders are more likely to use iceberg orders when they select a more aggressive limit order
price, Treasury traders are generally less likely to do so for quote improving orders, except for the less liquid
7- and 30-year securities.
Another interesting finding of our work is that volatility and hidden order usage are negatively linked. At
first blush, the finding seems counter-intuitive, as it suggests that the more volatile the market, the less likely
that hidden orders will be used, precisely when traders need greater protection. However, if we place this
finding in the context of the Treasury market, in which there exists another mechanism for order exposure
management, namely the workup protocol, we can better understand how it could be the case for this market.
The workup protocol gives market participants the ability to workup order sizes if and when desired, whereas
iceberg orders can be adversely executed when the market is moving so fast that traders cannot cancel
soon enough. As documented in Fleming and Nguyen (2013), workups tend to be used more frequently in
more volatile times, undermining the popularity of iceberg orders. Likewise, hidden orders are used less
often around the release of key macroeconomic reports, FOMC rate decision announcements, and Treasury
auctions. These are moments when the market is eagerly waiting for and trading on the newly released
announcements, so priority in the order queues seems to be an important consideration.
Overall, our work highlights how the electronic market for trading in U.S. Treasury securities differs
from its voice-assisted precedent and from other markets studied in the literature. Comparing with the
voice-assisted trading system, the electronic market facilitates a much greater frequency and volume of trades
and limit order activities, resulting in greater competition for liquidity provision and thus lower bid-ask
spreads and market impact. Comparing with other market setups, the high level of market liquidity and the
presence of the more preferred protocol to manage order exposure in this market are likely related to the lower
usage of iceberg orders and the seemingly greater importance of execution probability in traders’ decisions.
The chapter proceeds as follows. Section 2.2 describes the structure of the interdealer Treasury market.
Section 2.3 describes the BrokerTec data, characterizing trading activity and liquidity in the market. Section
2.4 presents the VAR model of returns and trades, and discusses a number of specifications and the resulting
estimates of the price impact of trades. In Section 2.5, we add order book information to the model and
quantify the price impact of limit orders. Section 2.6 presents our analysis of hidden orders. Section 2.7
concludes.
2.2 Market Structure
The secondary market for U.S. Treasury securities is a multiple dealer, over-the-counter market. The
predominant market makers are the primary government securities dealers those dealers with a trading
relationship with the Federal Reserve Bank of New York. The dealers trade with the Fed, their customers,
and one another. The core of the market is the interdealer broker (IDB) market, which accounts for nearly all
interdealer trading. Trading in the IDB market takes place 22-23 hours per day during the week, although we
find that slightly over 90% of trading occurs during New York hours, roughly 07:00 to 17:30 Eastern time
(comparable with what Fleming (1997) finds using GovPX data).
Until 1999, nearly all trading in the IDB market for U.S. Treasury securities occurred over the phone via
voice-assisted brokers. Voice-assisted brokers provide dealers with proprietary electronic screens that post
the best bid and offer prices called in by the dealers, along with the associated quantities. Quotes are binding
until and unless withdrawn. Dealers execute trades by calling the brokers, who post the resulting trade price
and size on their screens. The brokers thus match buyers and sellers, while ensuring anonymity, even after a
trade. In compensation for their services, brokers charge a fee.
The migration from voice-assisted to fully electronic trading in the IDB market began in March 1999
when Cantor Fitzgerald introduced its eSpeed electronic trading platform. Cantor spun eSpeed off in a
December 1999 public offering. After many ownership changes, eSpeed merged with BGC Partners, an
offshoot of the original Cantor Fitzgerald. In 2013, eSpeed was purchased by NASDAQ OMX Group.
In June 2000, BrokerTec Global LLC, a rival electronic trading platform, began operations. BrokerTec
had been formed the previous year as a joint venture of seven large fixed income dealers. BrokerTec was
acquired in May 2003 by ICAP PLC. Mizrach and Neely (2006) describe the migration to electronic trading
in greater detail, and Mizrach and Neely (2011) provide a summary of the evolution of the microstructure in
the Treasury market.
2.2.1 The Electronic Platforms
BrokerTec and eSpeed are fully automated electronic trading platforms where buyers are matched to sellers
without human intervention. A comparison of BrokerTec trading activity with that of eSpeed reported in Luo
(2010) and Dungey et al. (2013) shows that BrokerTec accounts for around 60% of electronic interdealer
trading in the on-the-run 2-, 5-, and 10-year notes and slightly above 50% for the 30-year bond.
The brokers provide electronic screens which display the best bid and offer prices and associated
quantities. On BrokerTec, for example, a manual trader can see five price tiers and corresponding total size
for each tier on each side of the book, plus individual order sizes for the best 10 bids and offers. For
computer-based traders, the complete order book information is available. Traders enter limit orders or hit/take existing
orders electronically. As with the voice brokers, the electronic brokers ensure trader anonymity, even after a
trade, and charge a small fee for their services.
The BrokerTec platform operates as an electronic limit order market. Dealers send in orders that can be
aggressive (market orders) or passive (limit orders), but they must all be priced. The minimum order size is
$1 million par value. Dealers can enter aggressive orders at a price worse than the current best price. This is
typically the case when dealers need to trade a large quantity for which the limit order quantity at the best
price is not sufficient. The order will first exhaust all depth, both displayed and hidden, at better price levels
until it reaches the originally stated price. Therefore, large aggressive orders can be executed at multiple
prices. However, the incidence of market orders walking up or down the book is very small (below 0.5%).
This is likely due to the large amount of depth usually available at the best price tier, and the ability to work
up volume at a given price point.
The BrokerTec platform allows traders to enter iceberg orders, whereby a trader can choose to show
only part of the amount he is willing to trade. As trading takes away the displayed portion of an iceberg
order, the next installment of hidden depth equal to the pre-specified display size is then shown. This process
continues until trading completely exhausts the iceberg order. It is not possible to enter iceberg orders with
zero displayed quantity; that is, limit orders cannot be completely hidden.
The priority of execution of limit orders is based on price, display status and time. That is, limit orders
with better prices have higher priority of execution. Displayed limit orders in the same price queue are
executed on a first in, first out basis. Once all displayed depth at a particular price level is exhausted, hidden
depth at that same price – if there is any – is then shown and executed.
Beside iceberg orders, the electronic brokers have retained the workup feature similar to the expandable
limit order protocol of the voice-assisted brokers, but with some important modifications.6 On BrokerTec,
the most important change is that the right-of-first-refusal – previously given to the original parties to the
transaction – has been eliminated, giving all market participants immediate access to workups. All trades
consummated during a workup are assigned the same aggressive side as the original market order.7 For a
detailed analysis of workup activity in this market, see Fleming and Nguyen (2013).
2.2.2 The Voice-Assisted Brokers: GovPX
Most previous research on the microstructure of the Treasury market has used data from voice-assisted
brokers, as reported by GovPX, Inc. GovPX receives market information from IDBs and re-disseminates
the information in real time via the internet and data vendors. Information provided includes the best bid
and offer prices, the quantity available at those quotes, and trade prices and volumes. In addition to the
real-time data, GovPX sells historical tick data, which provides a record of the real-time data feed for use by
researchers and others.
When GovPX started operations in June 1991, five major IDBs provided it with data, but Cantor
Fitzgerald did not, so that GovPX covered about two-thirds of the interdealer market. Over time, the number
of brokers declined due to mergers, and a new non-contributing electronic broker (BrokerTec) was formed.
By the end of 2004, GovPX was receiving data from three voice-assisted brokers, but neither eSpeed nor
BrokerTec, even though nearly all trading of on-the-run securities had migrated to these fully electronic
brokers. After ICAP’s purchase of GovPX in January 2005, ICAP’s voice brokerage unit was the only
brokerage entity reporting through GovPX.
6Boni and Leach (2004) provided a thorough explanation of this feature in the voice-assisted trading system. This feature allows a Treasury market trader whose order has been executed to have the right-of-first-refusal to trade additional volume at the same price. As a result, the trader might be able to have his market order fulfilled even though the original quoted depth is not sufficient. That is, the quoted depth is expandable.
7For a detailed description of the workup process on the BrokerTec platform, see “System and Method for Providing Workup Trading without Exclusive Trading Privileges”, U.S. Patent number US8,005,745B1, dated August 23, 2011.
2.3 Data
Our analysis is based on tick data from the BrokerTec platform. The database provides a comprehensive
record of every trade and order book change over the BrokerTec system for the on-the-run 2-, 3-, 5-,
7-and 10-year Treasury notes as well as the 30-year Treasury bond. We choose to focus on the period from
January 2, 2010 to December 31, 2011. This is the most recent period for which we have available data. It is
a sufficiently long sample period for a microstructure study, and relatively distanced from the 2007-2009
financial crisis, so that our analysis can provide an up-to-date characterization of the market’s microstructure
in a typical trading environment. For market dynamics during the crisis period, see Engle et al. (2012c).
2.3.1 Data Processing
From BrokerTec’s detailed record of every trade and order book change, time-stamped to the millisecond, we
process the data into two main parts: the trade data and the order book data. The trade data include price,
quantity, and whether a trade was seller-initiated (a “hit”) or buyer-initiated (a “take”). It should be noted that
BrokerTec records the execution of a market order against multiple limit orders, as well as further matches
during workups, as separate trade records. We aggregate these multiple trade records that belong to the same
workup as one market transaction for the following reasons. First, treating the individual trade records as
separate and distinct trades would artificially inflate the serial correlation in both trade initiation and signed
trade flow and might compromise econometric modeling and inferences. Furthermore, our aggregation
permits a more precise analysis of market order submission and the price impact of market orders, the size
of which is better measured by the total volume exchanged during a trade and its associated workup. Our
treatment is in line with BrokerTec’s workup patent document which states that a workup is conceptually a
“single deal extended in time”. Nevertheless, the aggregation is not without cost in that it will sometimes
overestimate the market order size.
The second part of the data concerns the limit order book, which we recreate from order book changes
on a tick-by-tick basis, saving as much of the richness of the data as is practical. Each order book change
record specifies the price, quantity change, shown and total quantities for that order, whether the order is a
bid or an ask, and the reason for the change. The book can be changed as a result of limit order submission,
modification, cancellation or execution against market orders. The order book data provide a view of the
Treasury market far more detailed than that provided by GovPX data. In particular, our processed dataset
not only tells us the best bid and offer and associated sizes at any given time, but also the depth available
outside of the first tier. Moreover, we see the number of individual orders comprising the quantities available
at particular prices. In addition, we are able to discern what quantities were visible to market participants at
the time and what quantities were hidden.
Over our sample of 500 trading days in 2010 and 2011, BrokerTec intermediated almost $63 trillion in
trading of on-the-run coupon securities, or $125.6 billion per day. The activity involved nearly 6 million
transactions (each comprised of one or more trades), or almost 12,000 per day. Moreover, there were roughly
2.4 billion order book changes at the first five price tiers alone for these securities over our sample period,
amounting to over 4.7 million order book ticks per day.
2.3.2 Trends in Trading Activity
To provide a historical perspective of trading activity on the BrokerTec platform since its beginning in the
early 2000’s, Figure 2.1 plots the average daily trading volume by year for the respective on-the-run coupon
securities. As can be observed from the figure, there has been a sharp increase in trading activity over time,
especially in the first seven years of the platform’s history before the financial crisis intensified in late 2008.
For the 10-year note, for example, average daily trading volume grew from $2.9 billion in 2001 to a level
over ten times larger in 2007 and, except for 2009, has remained above $30 billion since. Another interesting
observation is that the 2-year note – which used to be the most actively traded security with an average daily
trading volume of nearly $50 billion in 2008 – has seen lower activity since the crisis as the short rate has
stayed at the zero bound. This contrasts with the post-crisis recovery observed in other securities. In 2010
and 2011, the 5-year note is the most actively traded, closely followed by the 10-year note. Trading in the
other on-the-run securities is far below the level of the 2-, 5- and 10-year notes, although trading in the 3-year
note rose quickly between late 2008 and 2011.
Focusing on the most recent years of 2010 and 2011, Table 2.1 reports average daily trading volume,
trading frequency and trade size for each security. The table shows that trading in the 5- and 10-year notes is
most frequent, with over 3,000 transactions per day, on average. The 5-year note is the most actively traded in
terms of volume, with a daily trading volume exceeding $36 billion. The 30-year bond is also quite frequently
traded with nearly 2,000 transactions per day, but each trade is of much smaller size than that of the other
securities, so that its total daily trading volume of nearly $6 billion is far below the others. On the other hand,
the 2-year note has the lowest trading intensity, but the largest average trade size, nearly ten times larger than
that of the 30-year bond.
2.3.3 Liquidity Around the Clock
Figure 2.2 plots average BrokerTec trading volume by half-hour interval over the round-the-clock trading day
for our six notes and bonds. To make the intraday patterns comparable across securities, we standardize the
half-hour volume figures by the total daily volume of the relevant security. The findings are very consistent
with what Fleming (1997) finds using GovPX data from 1994, and the patterns are strikingly similar across
the six securities. Trading activity is extremely low during Tokyo trading hours (roughly 18:30 or 19:30
the previous day to 03:00 Eastern time), then picks up somewhat during morning trading hours in London.
Trading then rises sharply during morning trading hours in New York, peaking between 08:30 and 09:00,
and then peaking locally between 10:00 and 10:30. Trading reaches a final local peak between 14:30 and
15:00 and then tapers off by 17:30. This pattern is probably largely explained by scheduled macroeconomic
announcements (most of which are made at 08:30 and 10:00), the hours of open outcry Treasury futures
trading (08:20 to 15:00), and the pricing of fixed income indices at 15:00.
2.3.4 Spreads
The most basic measure of the bid-ask spread is the quoted spread. The inside quoted spread,st, is defined as
the gap between the best (lowest) ask price,pat, and the best (highest) bid price,pbt, i.e.:
st=pat −pbt.
The middle column of Table 2.2 shows the average inside bid-ask spread in multiples of tick size of the
relevant security.8Spread is generally increasing in maturity, from 1.03 128ths (2.06 256ths) at the 2-year
maturity to 2.66 64ths (10.64 256ths) at the 30-year maturity. The 10-year note, however, has a narrower
spread than the 7-year note. An interesting feature of the BrokerTec spreads is that they are quite close to the
tick size for all of the notes (but not the 30-year bond), suggesting that the minimum tick increment may
be constraining. Comparing to earlier studies using GovPX data, BrokerTec spreads are generally narrower.
8
The tick size for the 2-, 3-, and 5-year securities is 1/128thof one percent of par and that for the 7-, 10- and 30-year securities is 1/64thof one percent of par.
Fleming (2003), for example, reports average bid-ask spreads of 0.39 32nds (3.12 256ths) for the 5-year note
and 0.78 32nds (6.24 256ths) for the 10-year note, whereas the corresponding BrokerTec spreads are 1.18
128ths (2.36 256ths) and 1.15 64ths (4.60 256ths) respectively for these securities.9
Providing new information on how market depth is spaced along the price dimension beyond the inside
tier, Table 2.2 shows the average price distance between adjacent price levels up to the fifth level in the book.
All of the securities except for the 30-year bond have tightly populated order books at the first five price
levels: adjacent depths are roughly one tick apart, although they get slightly wider further away from the
inside tier.
To supplement the information provided in Table 2, we show in Figure 2.3 the frequency distributions of
inside spreads for the six securities. Immediately apparent from the figure is the high degree of clustering of
inside spreads at one tick, except for the 30-year bond whose distribution is more spread out at wider spread
levels and peaks at two ticks. In particular, nearly 97% of inside spreads for the 2-year note are 2/256ths,
another 3% are 4/256ths, and the negligible remainder is split between 0/256ths and above 4/256ths. Zero
spreads, or “locked” markets, are possible, albeit infrequent, because prices exclude the brokerage fee, and
because passive limit orders at the same price are not automatically executed against one another.
2.3.5 Market Depth
As a limit order market, liquidity on BrokerTec is supplied by limit orders submitted by market participants.
Table 2.3 reports the total visible quantity of limit orders available on average at the best price level, the best
five price levels, and across all price levels on each side of the market. Market depth is generally declining
in maturity, greatest at the 2-year and lowest at the 30-year segment. At the inside price tier, there is about
$300 million available on either side for trading in the 2-year note. It is interesting to observe that while
being the most actively traded, the 5- and 10-year notes’ market depth is on the lower end, averaging $26-31
million, suggesting a higher replenishment rate of liquidity to meet the high trading activity level. The inside
depths reported here greatly exceed average depths on GovPX reported by earlier studies. For the 2-year note,
for example, Fleming (2003) reports average depth on GovPX at the first tier of just $25 million (averaging
across the bid and ask side).
9Note that the prices in both databases do not reflect brokerage fees. Such fees are proprietary, and can vary by customer and with volume, but are unquestionably lower for the electronic brokers than the voice-assisted brokers.
In addition, earlier studies using GovPX data are limited to the inside tier, leaving market liquidity
beyond the first tier unknown. As Table 2.3 shows, market liquidity away from the first tier is substantial,
several orders of magnitude larger than that available at the inside tier. Collectively across the best five tiers
on each side, there is over $1.5 billion market depth for the 2-year note, about $470 million for the 3-year
note, in the range of $210-280 million for each of the 5-, 7- and 10-year note, and $28 million for the 30-year
bond. The first five tiers account for about 55-79% of total market depth for the notes and 47% of total market
depth for the bond. That is, the first five tiers collect a disproportionally large amount of depth, given that
there are typically around 16-18 price tiers on each side (slightly higher for the 5- and 10-year notes). The
maximum number of price levels on one side during our sample ranges from 43 for the 30-year bond (on the
bid side) to 101 for the 2-year note (on the ask side).
While depth in the book concentrates among the best five tiers, the inside tier is not the one with the
greatest depth. To learn more about the depth distribution in the book away from the inside tier, we display a
depth histogram of the order book in Figure 2.4. The figure illustrates again that order book depth outside the
first tier is considerable. A notable feature of the depth distribution patterns is that there is consistently more
quantity available at the second and third price tiers (and even fourth and fifth for some securities) than the
first. The available quantity generally peaks at the second tier on both the bid and ask sides for the notes, and
at the third tier for the bond. Depth then declines monotonically as one moves further away from the inside
quotes. Biais et al. (1995) also find depth lower at the first tier than the second tier, but find similar depths at
the second through fifth tiers.
2.3.6 Hidden Depth
In addition to information on visible depth at the best five tiers, Figure 2.4 also shows information on hidden
depth. Hidden depth is only a small share of total depth at each price tier on average. The first tier has
proportionally more hidden depth than other tiers. Among the securities, the 30-year bond has a greater share
of depth that is hidden from view.
Next, we examine more closely the extent of hidden depth at the inside tier as well as across all tiers, and
report the results in Table 2.4. The column “Full Sample” shows the percentage of hidden depth calculated
across all five-minute snapshots over the whole sample period, representing an unconditional estimate of the
extent of hidden depth. We then compute the percentages over only those snapshots when there is positive
hidden depth (column “Hidden>0”). The percentages of those snapshots with positive hidden depth are
reported in column “% of Obs.”. These numbers indicate the probability of having hidden depth in the order
book at any given time.
Since the results are quite similar between the bid and the ask side (although the numbers on the ask side
are slightly lower), we discuss the findings for the bid side only. We find that on the bid side, hidden depth as
a share of total depth at the inside tier is roughly in the vicinity of 10% for the 2-, 3-, 5-, and 10-year notes.
The extent of hidden depth is particularly low at the 7-year maturity (just under 4%). In contrast, the share of
hidden depth for the 30-year bond is far larger, about 23%. In terms of how likely it is for the inside tier to
have hidden depth, the 2-year note is at the top with a 45% probability, followed by a nearly 25% probability
for the 3-year. When there is hidden depth, the percentage hidden can be quite high, and in the extreme case
of the 30-year bond, the average percentage reaches nearly 70%. The 7-year remains at the lower extreme in
terms of both the extent and the likelihood of having hidden depth. When analyzing the overall percentages
of hidden depth across the whole book, the numbers are much smaller, indicating that depth outside the first
tier contains relatively less hidden depth. This finding is consistent with the belief that there is a greater need
to hide exposure of orders closer to the market.
2.4 Price Impact of Trades
In this section, we quantify the price impact of trades as the long run cumulative response of price to a unit
shock in trades, following Hasbrouck (1991a). This framework allows us to approximate the permanent price
impact of trades that incorporates any delayed response and that is not contaminated by transitory effects.
Accordingly, it provides a measure for the informational content of trades in this market.
Specifically, we estimate a structural VAR model with five lags for a vector of endogenous variables that
consist of return and trade-related variables. We measure returns as changes in the best bid-ask midpoint, i.e.,
rt=mt−mt−1, wheretindexes transaction time, andmtis the midpoint prevailing at the end of thetth
transaction. We letXtdenote trade-related variables (Xtcan be a vector), so that the general structural VAR
model is:
B0
rt
Xt
=
5 X
j=1
Bj
rt−j
Xt−j
+
ur,t
uX,t
,
whereutis the structural innovation vector. The matrixB0captures the comtemporaneous effects within
the endogenous variable vector. We will explain the chosen direction of contemporaneous effects when we
present specific model estimates in subsequent subsections. The model is estimated by Seemingly Unrelated
Regressions (SUR).
Based on the estimated dynamics of return and trade-related variables, we then compute the impulse
response function (IRF) to a unitary shock in trade, that is,
∂rt+h
∂Xt
.
We compute the IRF out to 50 transactions after the shock (h = 50).10 The permanent price impact is
approximated by the cumulative return over this horizon.
We consider a number of specifications so as to gain a deeper understanding of how trading affects
price dynamics, such as the extent to which trade direction contributes to price impact, both by itself and in
conjunction with trade size. We present each specification and the corresponding price impact estimates in
turn below.
2.4.1 Baseline Specification
We begin the estimation of market impact with a bivariate VAR of return and order flowqt. We consider two
alternative measures of order flow. The first is the direction of trade initiationxtwith a buy order signed +1
and a sell order signed -1. Trade initiation is recorded in the BrokerTec dataset, so all trades are classified
properly. The second is the signed volumextVtwhereVtis the actual volume of thetthtransaction.
In an ECN like BrokerTec, we can be sure that transactions, as well as the sequence of events associated
with each transaction, are recorded in the proper order. That is, a market order arrives, executes against
available limit orders on the opposite side, and the order book subsequently updates to reflect the transaction
just taking place. This supports the identifying assumption that order flow contemporaneously affects return,
but not vice versa. Accordingly, the model specification is:
1 −α1,2
0 1
rt
qt
=
5 X
j=1
Bj
rt−j
qt−j
+
ur,t
uq,t
, (2.1)
10
Visual inspection of the IRF indicates that the 50-tick horizon is sufficiently long for the IRF to stabilize.
whereBj are (2×2) matrices. We estimate model (2.1) separately forqt=xtandqt=xtVt.
The permanent price impact estimates from model (2.1) are reported in Table 2.5. Under the column
titled “Trade Direction” is the price response across maturities to a buyer-initiated trade (i.e., computed
from the specification with trade initiation), while the column “Signed Trade Volume” shows the response
to a $1 million shock in buyer-initiated trade flow (i.e., computed from the specification with signed trade
volume). The price impact rises with maturity, except for the 7-year note which has a higher price impact
than the 10-year note in the model using signed trade volume. A buy market order results in a permanent
price increase, ranging from 0.357/256th for the 2-year note to 2.921/256th for the 30-year bond.
Since transaction size varies across maturities, a better cross securities comparison may be obtained by
looking at the price impact per $1 million shock in the order flow of the respective securities. A $1 million
increase in buyer-initiated trade flow moves the 2-year note’s price by 0.006/256th, or alternatively, it takes
about $363 million increase in buyer-initiated transaction volume to move the price by one tick (or 2/256th).
The 30-year bond is much less liquid: a $1 million shock in the buyer-initiated order flow permanently
increases the price by 0.450/256th, or equivalently, only $8.9 million is needed to move the price by one tick
(or 4/256th).
2.4.2 Separate Effects of Trade Direction and Size
In the spirit of Hasbrouck (1991a), we also estimate a specification that incorporates both trade direction and
size in order to explore their respective market impact:
1 −α1,2 −α1,3
0 1 0
0 0 1
rt
xt
xVt
= 5 X
j=1
Bj
rt−j
xt−j
xVt−j
+
ur,t
ux,t
uxV,t
. (2.2)
Based on the model estimates, we compute the permanent price impact of trade direction and the marginal
market impact of trade size beyond the minimum size.
We report the results in Table 2.6. The first column shows the price impact of a minimum-sized trade ($1
million), which ranges from 0.271/256th for the 2-year note to 2.378/256th for the 30-year bond. From here,
price impact increases directly with trade size. Essentially, this specification disentangles the price impact of
trade into two separate components: a “fixed” component due to trade initiation and a “variable” component
that scales directly with the volume of the trade. For example, for a $100 million buyer-initiated transaction
in the 10-year note, the buy direction increases price by 1.033/256th, and the $99 million increment in trade
size from the $1 million minimum increases price by an additional 3.265/256th, for a total price impact of
4.298/256th.
To entertain the possibility that the price impact of trade size does not increase linearly in trade size
beyond the minimum size, we explore a further specification that allows for the non-linearity of trade size by
incorporating signed trade volume squared in the system, as in Hasbrouck (1991a). Specifically,
1 −α1,2 −α1,3 −α1,4
0 1 0 0
0 0 1 0
0 0 0 1
rt xt xVt V2 t = 5 X j=1 Bj rt−j xt−j xVt−j V2 t−j + ur,t ux,t uxV,t
uV2,t
. (2.3)
We plot the permanent price impact calculated from this model for varying trade sizes in Figure 2.5. It is
clear from the figure that price impact is increasing in trade size. The concavity of the price impact function
of the notes is quite mild, almost visually indistinguishable from linearity for the notes, especially the 2-year
note whose price impact is already very small. Only the 30-year bond demonstrates a pronounced concavity
in the price impact function. Parameter estimates (not shown) reveal that the squared trade size variable
has a significant and negative contemporaneous effect on mid-quote return for all notes and bonds, but the
magnitude is overwhelmed by the positive effects of trade direction and size. This suggests that a very large
trade size is required for the concavity effect of price impact to kick in. We are able to see the concavity of
the price impact function for the 30-year bond as trade size in this bond is typically very small ($3 million).
2.4.3 Asymmetric Effects of Buys and Sells
We extend the baseline specification in equation (2.1) to explore if there is any asymmetry in the price impact
between buyer-initiated and seller-initiated trades. Saar (2001), for example, motivates theoretically an
asymmetric response to buyer- and seller-initiated block trades. The model we estimate is:
1 −α1,2 −α1,3
0 1 0
0 0 1
rt
V Bt
V St
= 5 X j=1 Bj rt−j
V Bt−j
V St−j
+ ur,t
uV B,t
uV S,t