University of Kansas School of Medicine, Kansas City, KS; University of North Carolina at Chapel Hill, Chapel Hill; Durham Veterans Affairs Medical Center; and Duke University Medical Center, Durham, NC Corresponding author: Shellie Ellis, MA, PhD, Mail Stop 3044, 3901 Rainbow Blvd, Kansas City, KS 66160; e-mail:sellis4@ kumc.edu.
Disclosures provided by the authors are available with this article at
jop.ascopubs.org.
DOI:10.1200/JOP.2015.007344; published online ahead of print at
jop.ascopubs.orgon March 8, 2016.
Are Small Reimbursement Changes Enough to Change Cancer
Care? Reimbursement Variation in Prostate Cancer Treatment
Shellie D. Ellis, MA, PhD, Ronald C. Chen, MD, MPH, Stacie B. Dusetzina, PhD, Stephanie B. Wheeler, MPH, PhD, George L. Jackson, PhD, MHA, Matthew E. Nielsen, MD, MS, William R. Carpenter, PhD, and Morris Weinberger, PhD
QUESTION ASKED: Centers for Medicare and Medicaid Services (CMS) is making small adjustments to physician reimbursement to improve the value of care delivered to Medicare beneficiaries under fee-for-service. Using localized prostate cancer as a model, we examined whether these small reimbursement changes were enough to increase the value of cancer care.
SUMMARY ANSWER: Small variations in fee-for-service reimbursement for costly physician-administered prostate cancer drugs in the early 2000s did not reduce low-value care, suggesting that small payment changes may not be enough to motivate improvements in care quality. Moreover, patient clinical characteristics and practice organization were associated with low-value care (Table 3).
METHODS: We conducted a natural experiment exploiting unintended differences in regional Medicare carriers’payment of Part B drug claims. Using data from SEER registries that are linked to Medicare claims, we conducted multilevel analysis to assess whether the reimbursement variation affected urologists’inappropriate use of gonadotropin-releasing hormone (GnRH) agonists. These drugs are often used, and misused, in prostate cancer treatment.
BIAS, CONFOUNDING FACTOR(S), DRAWBACKS: We conducted our study among
urologists. Much of cancer care is delivered by medical and radiation oncologists and our results may not be generalizable to these providers. Future studies should address these groups specifically to compare how reimbursement changes, both small and large, affect prescribing of GnRH agonists to complete our understanding of the clinical and practice contexts in which reimbursement does or does not change clinical decision making.
REAL-LIFE IMPLICATIONS: CMS’efforts to align reimbursement with high quality care should continue. However, our findings suggest that small adjustments to reimbursement on the order of 2% to 3% may be insufficient to improve the value of care delivered by urologists treating localized prostate cancer. Other efforts may also be needed to change physicians’behavior, such as CMS’identification of low-performing practices through publication of quality ratings and targeted, physician-centered interventions to support health care providers who are not adherent to guidelines.
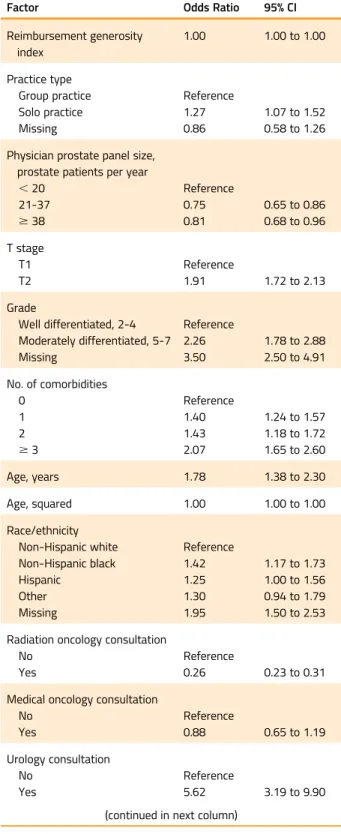
Table 3.Multilevel Regression Predicting Primary GnRH Agonist Use
Factor Odds Ratio 95% CI
Reimbursement generosity index
1.00 1.00 to 1.00
Practice type
Group practice Reference
Solo practice 1.27 1.07 to 1.52
Missing 0.86 0.58 to 1.26
Physician prostate panel size, prostate patients per year
,20 Reference
21-37 0.75 0.65 to 0.86
$38 0.81 0.68 to 0.96
T stage
T1 Reference
T2 1.91 1.72 to 2.13
Grade
Well differentiated, 2-4 Reference
Moderately differentiated, 5-7 2.26 1.78 to 2.88
Missing 3.50 2.50 to 4.91
No. of comorbidities
0 Reference
1 1.40 1.24 to 1.57
2 1.43 1.18 to 1.72
$3 2.07 1.65 to 2.60
Age, years 1.78 1.38 to 2.30
Age, squared 1.00 1.00 to 1.00
Race/ethnicity
Non-Hispanic white Reference
Non-Hispanic black 1.42 1.17 to 1.73
Hispanic 1.25 1.00 to 1.56
Other 1.30 0.94 to 1.79
Missing 1.95 1.50 to 2.53
Radiation oncology consultation
No Reference
Yes 0.26 0.23 to 0.31
Medical oncology consultation
No Reference
Yes 0.88 0.65 to 1.19
Urology consultation
No Reference
Yes 5.62 3.19 to 9.90
(continued in next column)
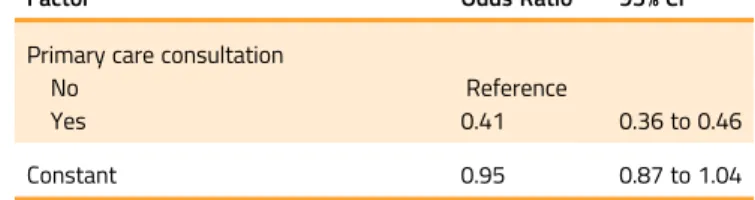
Table 3.Multilevel Regression Predicting Primary GnRH Agonist Use (continued)
Factor Odds Ratio 95% CI
Primary care consultation
No Reference
Yes 0.41 0.36 to 0.46
Constant 0.95 0.87 to 1.04
NOTE. Sample includes only patients (n = 15,128) of urologists who prescribed GnRH agonists. The model also adjusts for urologists’length of time in practice, sex, training location, board certification status, medical school affiliation, proportion of minority patients in practice, patients’ marital status, rural residence, community educational attainment, community income, prior primary care use, year treated, and SEER region.
University of Kansas School of Medicine, Kansas City, KS; University of North Carolina at Chapel Hill, Chapel Hill; Durham Veterans Affairs Medical Center; and Duke University Medical Center, Durham, NC
ASSOCIATED CONTENT
Appendix DOI: 10.1200/JOP.2015. 007344
DOI:10.1200/JOP.2015.007344; published online ahead of print at
jop.ascopubs.orgon March 8, 2016.
Are Small Reimbursement Changes
Enough to Change Cancer Care?
Reimbursement Variation in
Prostate Cancer Treatment
Shellie D. Ellis, MA, PhD, Ronald C. Chen, MD, MPH, Stacie B. Dusetzina, PhD, Stephanie B. Wheeler, MPH, PhD, George L. Jackson, PhD, MHA,
Matthew E. Nielsen, MD, MS, William R. Carpenter, PhD, and Morris Weinberger, PhD
Abstract
Purpose
The Centers for Medicare and Medicaid Services recently initiated small reimbursement adjustments to improve the value of care delivered under fee-for-service. To estimate the degree to which reimbursement influences physician decision making, we examined utilization of gonadotropin-releasing hormone (GnRH) agonists among urologists as Part B drug reimbursement varied in a fee-for-service environment.
Methods
We analyzed treatment patterns of urologists treating 15,128 men included in SEER-linked Medicare claims who were diagnosed with localized prostate cancer between January 1, 2000, and December 31, 2003. We calculated a reimbursement generosity index to measure differences in GnRH agonist reimbursement among regional Medicare carriers and over time. We used multilevel analysis to control for patient and provider characteristics.
Results
Among urologists treating early-stage and lower grade prostate cancer, variation in reimbursement was not associated with overuse of GnRH agonists from 2000 to 2003, a period of guideline stability (odds ratio, 1.00; 95% CI, 0.99 to 1.00).
Conclusion
Small differences in androgen-deprivation therapy reimbursement generosity were not associated with differential use. Fee-for-service reimbursement changes currently being implemented to improve quality in fee-for-service Medicare may not affect patterns of cancer care.
INTRODUCTION
Numerous payment policies and incen-tives have been implemented to increase the value of cancer services in the United States.1,2Although recent attention has focused on alternative payment models,3 the majority of oncology care continues
reimbursement to disincentivize poor-quality and high-cost care.3,5
These plans were likely informed by prior evidence of the impact of reimbursement reductions on prostate cancer care delivery in the past decade. Before 2005, when Medicare had a generous reimbursement policy for gonadotropin-releasing hormone (GnRH) agonists and other physician-administered drugs reimbursed through the Part B medical benefit, this form of androgen-deprivation therapy (ADT) was widely used as primary treatment of localized prostate cancer,6-10despite the lack of recommendation by published guidelines for patients with early prostate cancer.11,12 A sharp decline in GnRH use occurred after 2005, when the Medicare Modernization Act (MMA) of 2003 changed the pricing benchmark used in the reimbursement formula from an average wholesale price set by the manufacturers to average sales price on the basis of national sales, reducing reimbursement for GnRH agonists by 65%.7,8,13,14 These studies suggest quality may be improved by limiting reimbursement of inappropriate treatment options. How-ever, no prior study has evaluated the effect of more modest reimbursement variation on clinical decision making, similar to the 0.5% to 1% reductions in payments currently in place to transform fee-for-service.15
Between January 2000 and December 2003, there were unintentional differences in physician reimbursement for GnRH agonists delivered through the Medicare Part B drug benefit,16which resulted in reimbursement variations of up to 10.5%, or $59 per administration, across providers. Taking advantage of this natural experiment, we examine the association between modest reimbursement variation and GnRH agonist use during a period in which there was stability in guidelines (primary ADT recommended for high-risk, but not low- or intermediate-risk, patients) and the potential harms of ADT were largely unknown. We hypothesize that practicing under more generous drug reimbursement conditions is associated with greater use of ADT.
METHODS
We conducted a retrospective analysis to examine the asso-ciation of reimbursement and primary GnRH agonist use among patients with clinically localized prostate cancer. The study was approved by the University of North Carolina at Chapel Hill Institutional Review Board.
Data Sources
We linked SEER-Medicare data to the American Medical Association (AMA) Masterfile. SEER records patient demographics, tumor morphology, and stage at diagnosis for a population-based sample of US residents diagnosed with cancer.17 Medicare administrative claims include hospital services, physician services, and physician-administered drug therapy. We used Medicare Provider Analysis and Review, Outpatient, Durable Medical Equipment, and Carrier files for sample selection, initial treatment ascertainment, and treating provider identification; we used carrier files alone to evaluate response to reimbursement because other files do not identify physicians and/or reimbursement.18 AMA Masterfile data include individual and practice characteristics from approximately 800,000 US physicians. Data originate from training records collected annually (96% to 98% response rates) and are supplemented by physician survey.19
Cohort Definitions
Patients
We identified patients with an incident diagnosis of prostate adenocarcinoma as their first and only cancer. Of men receiving initial treatment between January 1, 2000, and December 31, 2003, we excluded those # 66 years old at diagnosis because we could not ascertain their comorbidities. We also excluded patients whose initial treatment could not be fully ascertained because they were diagnosed at autopsy, by death certificate, or at a nursing/convalescent facility; died within 12 months of diagnosis; were not continuously enrolled in fee-for-service Medicare for 12 months before and after diagnosis; or had no treatment claims. This study focused on patients with early prostate cancer, so we restricted the cohort to men who lacked evidence of nodal or metastatic involvement and who had no greater than stage T2 tumors and WHO grade 1 or 2 disease.8We also excluded men with an actuarial life expectancy of less than 5 years because national guidelines permitted primary ADT use for these patients.6,11
Urologists
urologists who did not prescribe GnRH agonists because we could not compute their reimbursement generosity index (RGI; see Measures).
Measures
Dependent variable
Primary GnRH agonist use is defined as any claim for goserelin acetate (GA) implants, leuprolide acetate (LA) injections, LA implants, or triptorelin pamoate injections administered within 1 year after diagnosis, unless orchiectomy, radical prostatectomy, brachytherapy, chemotherapy, or cryotherapy was also administered within that time (codes used listed in AppendixTable A1, online only).
Explanatory variables
Part B claims are paid by local carriers, which lack uniform reimbursement policies.22From 1997 to 2002, carriers were responsible for translating Part B drug Healthcare Common Procedure Coding System (HCPCS) claims into National Drug Code (NDC) indices.18Although some HCPCS codes had only one equivalent NDC, others had $10 matches, resulting in substantial reimbursement variation.16 In addi-tion to variability among carriers, reimbursements changed at different rates over time as a result of changes in average wholesale prices for specific NDCs.18
Thus, for each urologist, we created an RGI, a weighted average difference in reimbursement indicating reimbursement above or below the national average.18First, we calculated the difference between the reimbursement the physician re-ceived for each ADT modality and the average national reimbursement amount for that same product during that time period. Next, we weighted these differences by the proportion of spending on that drug among spending on all GnRH agonists used by each urologist in that year (Appendix, online only). Differences in RGI reflect reimbursement var-iation specific to each carrier and over time, as well as changes in the mix of drugs prescribed by each physician in any year. An RGI greater than 0 indicates excess reimbursement (greater than the national average).
The following example demonstrates our calculation of RGI. A physician started five patients on ADT in 2001, using LA injections one time and GA implants four times. During that year, he was reimbursed for LA at $592.60 per monthly dose. He was reimbursed for GA at $446.49 per monthly dose all four times. Thus, in 2001, his average reimbursement for LA was $592.60 and his average reimbursement for GA was $446.49.
However, across all SEER regions, the average reimbursement in 2001 for LA was $487.92 and the average reimbursement for GA was $434.70. Thus, he was reimbursed $104.68 more than the SEER national average for LA and $11.79 more than the SEER national average for GA. In 2001, LA spending was 43% of spending on all initial use of primary ADT and GA was 55% of all spending on initial use of primary ADT. This doctor’s reimbursement generosity was proportional to only the two drugs he used. Over 2001, this physician’s RGI is equal to:
ð592:602487:92Þ þ ð446:492434:70Þ0:545 0:434þ0:545 ¼52:9
Thus, for this physician in 2001, his reimbursement per monthly dose was $53 more generous than the national average for the mix of GnRH agonists he used.
Control variables
We controlled for patient, urologist, and practice variables (see Appendix, online only) known to be associated with prostate treat-ment decisions, quality of care, or responsiveness to incentives.
Statistical and Sensitivity Analyses
As a result of high intraclass correlation among patients treated by the same urologist23 and to exploit both increases and decreases in reimbursement as well as reimbursement var-iation both within physicians and between physicians, we used multilevel mixed effects logistic regression models to control for clustering. Statistical significance was evaluated ata= .05 using Stata/SE 12.1 (StataCorp, College Station, TX).24
We varied definitions of the primary dependent (GnRH agonist use) and independent variables (treating provider) to assess robustness of our findings. Because reimbursement may affect adjuvant GnRH agonist use, we created a second dependent variable that captured both primary GnRH agonist use (potentially inappropriate) and adjuvant GnRH agonist use (potentially appropriate). Further sensitivity analysis used the SEER average reimbursement for urologists who did not prescribe any GnRH agonists to assess the effect of excluding nonprescribing urologists.
RESULTS
2003. Twenty four percent of patients (3,653 of 15,128 patients) received primary ADT.
GA implants (3.6 mg) and LA injections (7.5 mg) composed more than 94% of ADT use. Monthly median reimbursement for GA implants (3.6 mg), which had one equivalent NDC, fluctuated little from 2000 to 2003, increasing from $193 to $199. Reimbursement for LA injections (7.5 mg), which had multiple NDCs, had greater variation; the median reimbursement per monthly dose was $207 in 2000, $214 in 2001, $190 in 2002, and $223 in 2003.
The average RGI over the study period was 2.93 (standard deviation [SD], 69.63), indicating that, on average, urologists treating patients with primary GnRH agonists were reim-bursed $2.93 more generously for the drugs they used relative to the national average reimbursement. However, RGI fluctuated by treatment year; the average RGI decreased from 2.92 in 2000 to 1.88 in 2001, increased to 3.89 in 2002, and decreased to 2.87 in 2003, with the average RGI ranging from $18.89 less than the average reimbursement at the 25th percentile to $15.03 more than average at the 75th percentile. However, variation between urologists (SD, $73.63) was greater than variation among individual urologists over time (SD, $43.54).
Primary GnRH agonist use grew from 21.9% of patients in 2000 to 29.2% in 2002 and then decreased to 23.1% in 2003 (Table 1). Patients of physicians who were reimbursed for GnRH agonists at levels above the national average differed from those of physicians who were reimbursed at or below the national average on most clinical, demographic, care-seeking, and geographic indicators (Table 1). However, at the physician level, 30% of patients treated by physicians practicing in areas where GnRH agonist reimbursement is at or below national average received primary ADT; this proportion is identical for physicians reimbursed above the national average (30%; P= .56;Table 2).
After controlling for patient, urologist, and practice characteristics, excess GnRH agonist reimbursement was not associated with primary GnRH agonist use among patients with T1 and T2 well-differentiated or moderately differ-entiated prostate cancer (odds ratio [OR], 1.00; 95% CI, 1.00 to 1.00; Table 3). Solo practitioners were more likely to use primary ADT than urologists in group practice or with missing practice status, all else being equal (OR, 1.27; 95% CI, 1.07 to 1.52). Larger panel sizes and seeing a primary care provider between diagnosis and treatment were protective against primary GnRH agonist use.
Sensitivity Analyses
Results for all models were substantively similar when we also included adjuvant GnRH agonist use in the outcome (data not shown). When considering all urologists (2,213 urologists and 16,789 patients) and assuming nonprescribers were reim-bursed at the SEER national average, excessive reimbursement had a small negative effect on GnRH agonist overuse, although the upper CI rounded to 1 (OR, 0.99; 95% CI, 0.99 to 1.00).
DISCUSSION
We evaluated the potential association between small reimbursement variation and use of primary ADT for patients with early prostate cancer during a period when there was widespread variation in reimbursement across different regions of the United States. Contrary to our hypothesis, we found no association between variation in reimbursement and primary GnRH agonist use, suggesting that small incentives or disincentives may have little impact on urologists’ prescribing practices.
Table 1.Patient Characteristics According to Reimbursement Generosity Index of Urologists Prescribing GnRH Agonists
Characteristic Overall (N = 15,128)
GnRH Agonist Reimbursement Less Than or Equal to National Average (n = 5,932)
GnRH Agonist Reimbursement Greater Than National Average (n = 9,196) P
GnRH agonist overuse 3,653 (24.1) 1,356 (22.9) 2,297 (25.0) .003
Reimbursement generosity index, mean (SD) 2.9 (69.6) 248.0 (65.6) 35.8 (49.5) ,.001
Year treated ,.001
2000 3,317 (21.9) 1,332 (22.5) 1.985 (21.6)
2001 3,894 (25.7) 1,618 (27.3) 2,276 (24.7)
2002 4,421 (29.2) 1,890 (31.9) 2,531 (27.5)
2003 3,496 (23.1) 1,092 (18.4) 2,404 (26.1)
T stage .08
T1 6,296 (41.6) 2,417 (40.7) 3,879 (42.2)
T2 8,832 (58.4) 3,515 (59.3) 5,317 (57.8)
Grade ,.001
Well differentiated, 2-4 759 (5.0) 333 (5.6) 426 (4.6)
Moderately differentiated, 5-7 13,867 (91.7) 5,439 (91.7) 8,428 (91.6)
Missing 502 (3.3) 160 (2.7) 342 (3.7)
No. of comorbidities ,.001
0 10,245 (67.7) 4,129 (69.6) 6,116 (66.5)
1 3,298 (21.8) 1,240 (20.9) 2,058 (22.4)
2 998 (6.6) 354 (6.0) 644 (7.0)
$3 587 (3.9) 209 (3.5) 378 (4.1)
Age, years, mean (SD) 73.9 (5.5) 73.7 (5.5) 73.9 (5.5) .03
Race/ethnicity ,.001
Non-Hispanic white 12,008 (79.4) 4,878 (82.2) 7,130 (77.5)
Non-Hispanic black 1,175 (7.8) 303 (5.1) 872 (9.5)
Hispanic 925 (6.1) 352 (5.9) 573 (6.2)
Other 550 (3.6) 249 (4.2) 301 (3.3)
Missing 470 (3.1) 150 (2.5) 320 (3.5)
Marital status .01
Not married 2,767 (18.3) 1,022 (17.2) 1,745 (19.0)
Married 10,231 (67.6) 4,086 (68.9) 6,145 (66.8)
Missing 824 (14.1) 5,923 (13.9) 9,196 (14.2)
Pretreatment primary care use .19
0-2 visits in prior year 2,991 (19.8) 1,135 (19.1) 1,856 (20.2)
3-5 visits in prior year 6,753 (44.6) 2,693 (45.4) 4.060 (44.1)
$6 visits in prior year 5,384 (35.6) 2,104 (35.5) 3,280 (35.7)
Primary care consultation .21
No 7,104 (47.0) 2,823 (47.6) 4,281 (46.6)
Yes 8,024 (53.0) 3,109 (52.4) 4,915 (53.4)
Radiation oncology consultation .008
No 10,805 (71.4) 4,309 (72.6) 6,496 (70.6)
Yes 4,323 (28.6) 1,623 (27.4) 2,700 (29.4)
study to minimize the contribution from these potentially confounding factors and exploited a natural variation in reimbursement that occurred both within and between urologists as a result of the inconsistent Medicare reim-bursement policy.
A second reason our findings may differ from earlier studies is because the size and consistency of the reimbursement change differed between the study periods. Studies noting large changes in treatment patterns examined a consistent treatment-level reimbursement decrease of 65% over a 2-year
Table 1.Patient Characteristics According to Reimbursement Generosity Index of Urologists Prescribing GnRH Agonists (continued)
Characteristic Overall (N = 15,128)
GnRH Agonist Reimbursement Less Than or Equal to National Average (n = 5,932)
GnRH Agonist Reimbursement Greater Than National Average (n = 9,196) P
Medical oncology consultation .04
No 14,603 (96.5) 5,703 (96.1) 8,900 (96.8)
Yes 525 (3.5) 229 (3.9) 296 (3.2)
Urology consultation .008
No 156 (1.0) 45 (0.8) 111 (1.2)
Yes 14,972 (99) 5,887 (99.2) 9,085 (98.8)
Rural residence ,.001
No 14,835 (98.1) 5,768 (97.2) 9,067 (98.6)
Yes 293 (1.9) 164 (2.8) 129 (1.4)
SEER region ,.001
Seattle 751 (5.0) 644 (10.9) 107 (1.2)
Connecticut 1,037 (6.9) 477 (8.0) 560 (6.1)
Detroit 1,270 (8.4) 108 (1.8) 1,162 (12.6)
Hawaii 163 (1.1) 105 (1.8) 58 (0.6)
Iowa 1,133 (7.5) 439 (7.4) 694 (7.5)
New Mexico 368 (2.4) 51 (0.9) 317 (3.4)
California 4,498 (29.7) 1,982 (33.4) 2,516 (27.4)
Utah 678 (4.5) 631 (10.6) 47 (0.5)
Georgia 332 (2.2) 27 (0.5) 305 (3.3)
Kentucky 1,212 (8.0) 670 (11.3) 542 (5.9)
Louisiana 1,233 (8.2) 340 (5.7) 893 (9.7)
New Jersey 2,453 (16.2) 458 (7.7) 1,995 (21.7)
Median income of patients’communities, dollars ,.001
2,506-35,031 3,574 (23.6) 1,495 (25.2) 2,079 (22.6)
35,051-46,079 3,817 (25.2) 1,660 (28.0) 2,157 (23.5)
46,084-60,668 3,563 (23.6) 1,351 (22.8) 2,212 (24.1)
60,669-200,008 3,596 (23.8) 1,205 (20.3) 2,391 (26.0)
Missing 578 (3.8) 221 (3.7) 357 (3.9)
Proportion of patient’s community without high school education, %
.002
0-9.7 3,615 (23.9) 1,499 (25.3) 2,116 (23.0)
9.7-15.5 3,720 (24.6) 1,469 (24.8) 2,251 (24.5)
15.5-25.2 3,569 (23.6) 1,313 (22.1) 2,256 (24.5)
25.2-100 3,653 (24.1) 1,431 (24.1) 2,222 (24.2)
Missing 571 (3.8) 220 (3.7) 351 (3.8)
NOTE. Data are presented as No. (%) unless otherwise indicated. Reimbursement generosity index indicates GnRH agonist reimbursement relative to the national average.Pvalues calculated withttest for continuous variables andx2test for binary/categorical variables.
period. In our study, although average annual SEER-wide drug reimbursements fluctuated as much as 17% for one of the drugs, at the individual physician level, reimbursement changes were more modest. Most physicians experienced little change in their reimbursement on an annual basis. Of the urologists who used the therapy consistently, 75% experienced RGI changes—positive or negative—of less than 2.6% in any
given year. Still, we did not have access to the cost of GnRH agonists used by the urologists. Because physicians would have been responding to marginal costs (difference between cost and reimbursement) rather than reimbursement alone, we assumed that physicians with similar practice characteristics and size might receive similar kinds of discounts and rebates from pharmaceutical manufacturers or have similar access to
Table 2.Characteristics of Urologists Prescribing Primary GnRH Agonists
Characteristic
Overall (N = 1,800)
GnRH Agonist Reimbursement Less than or Equal to National Average (n = 701)
GnRH Agonist Reimbursement Greater Than National Average
(n = 1,099) P
Proportion of patients in practice receiving unnecessary GnRH agonist, mean (SD)
0.3 (0.3) 0.3 (0.3) 0.3 (0.3) .56
Reimbursement generosity index, mean (SD) 2.9 (73.6) 237.0 (62.2) 28.4 (68.9) ,.001
Years in practice .42
,20 686 (38.1) 259 (36.9) 427 (38.9)
$20 1,114 (61.9) 442 (63.1) 672 (61.1)
Sex .41
Male 1,763 (97.9) 689 (98.3) 1,074 (97.7)
Female 37 (2.1) 12 (1.7) 25 (2.3)
US trained .29
No 298 (16.6) 108 (15.4) 190 (17.3)
Yes 593 (83.4) 593 (84.6) 909 (82.7)
Board certified .55
No 113 (6.3) 41 (5.8) 72 (6.6)
Yes 1,687 (93.7) 660 (94.2) 1,027 (93.4)
Medical school affiliation ,.001
None 903 (50.2) 391 (55.8) 512 (46.6)
Some 854 (47.4) 294 (41.9) 560 (51.0)
Missing 43 (2.4) 16 (2.3) 27 (2.5)
Physician prostate panel size, prostate patients per year .45
0-20 1,195 (66.4) 474 (67.6) 721 (65.6)
21-37 454 (25.2) 175 (25.0) 279 (25.4)
$38 151 (8.4) 52 (7.4) 99 (9.0)
Practice type .03
Group practice 1,274 (70.8) 471 (67.2) 803 (73.1)
Solo practice 442 (24.6) 193 (27.5) 249 (22.7)
Missing 84 (4.7) 37 (5.3) 47 (4.3)
Proportion of minority patients, % ,.001
,6.1 668 (37.1) 295 (42.1) 373 (33.9)
6.2-19.5 522 (29.0) 211 (30.1) 311 (28.3)
$20 610 (33.9) 195 (27.8) 415 (37.8)
NOTE. Data are presented as No. (%) unless otherwise indicated.Pvalues determined byttest for continuous variables andx2test for binary/categorical
variables.
third-party suppliers who could negotiate lower drug costs29,37and controlled our model accordingly. Nonetheless, whether reimbursement shifted significantly enough to affect marginal costs during our study period is unknown, although none of the prior observational studies suggesting a strong effect of reimbursement on GnRH agonist use measured marginal costs either.7,8 Better efforts to capture marginal costs are needed in future studies. To place our findings in the context of the unfolding Medicare value initiatives, the global payment changes incurred by the CMS initiative to align fee-for-service payments with higher quality and greater value (the Physician Feedback Program/Value-Based Payment Modifier) resulted in payment cuts of 0.5% to 1% and bonuses of up to 2%.38Our study demonstrates that reimbursement variation more than twice the current CMS penalties did not seem to deter potentially inappropriate prescribing. Thus, if small physician-level reimbursement changes have little effect on shaping desired patterns of care, it may be more efficient for CMS to expand alternative payment models (eg, episode-based payments) than to further tweak the current fee-for-service schedule.
However, there are differences in the way reimbursement cuts were experienced in our study compared with the CMS Physician Feedback Program. In localized prostate cancer, any decrease in reimbursement was coupled with the individual administration of the drug. CMS penalties are global, accrue to the practice, and have been widely publicized. Whether and how quickly a physician receives negative feedback for a specific behavior—an important component of effective behavior change—would be mediated by practice manage-ment’s ability to link the behavior to the consequence and to
Table 3.Multilevel Regression Predicting Primary GnRH Agonist Use
Factor Odds Ratio 95% CI
Reimbursement generosity index 1.00 1.00 to 1.00
Practice type
Group practice Reference
Solo practice 1.27 1.07 to 1.52
Missing 0.86 0.58 to 1.26
Physician prostate panel size, prostate patients per year
,20 Reference
21-37 0.75 0.65 to 0.86
$38 0.81 0.68 to 0.96
T stage
T1 Reference
T2 1.91 1.72 to 2.13
Grade
Well differentiated, 2-4 Reference
Moderately differentiated, 5-7 2.26 1.78 to 2.88
Missing 3.50 2.50 to 4.91
No. of comorbidities
0 Reference
1 1.40 1.24 to 1.57
2 1.43 1.18 to 1.72
$3 2.07 1.65 to 2.60
Age, years 1.78 1.38 to 2.30
Age, squared 1.00 1.00 to 1.00
Race/ethnicity
Non-Hispanic white Reference
Non-Hispanic black 1.42 1.17 to 1.73
Hispanic 1.25 1.00 to 1.56
Other 1.30 0.94 to 1.79
Missing 1.95 1.50 to 2.53
Radiation oncology consultation
No Reference
Yes 0.26 0.23 to 0.31
Medical oncology consultation
No Reference
Yes 0.88 0.65 to 1.19
Urology consultation
No Reference
Yes 5.62 3.19 to 9.90
(continued in next column)
Table 3.Multilevel Regression Predicting Primary GnRH Agonist Use (continued)
Factor Odds Ratio 95% CI
Primary care consultation
No Reference
Yes 0.41 0.36 to 0.46
Constant 0.95 0.87 to 1.04
NOTE. Sample includes only patients (n = 15,128) of urologists who pre-scribed GnRH agonists. The model also adjusts for urologists’length of time in practice, sex, training location, board certification status, medical school affiliation, proportion of minority patients in practice, patients’marital status, rural residence, community educational attainment, community income, prior primary care use, year treated, and SEER region.
implement effective remediation. We cannot assess the mediating effect of practice management, and this should be the subject of future studies that seek to understand how global payment adjustments work effectively. Future research should also isolate the effects of the timing of the reimbursement penalties. CMS penalties lag performance by 2 years. We presume reimbursement cuts were realized more quickly in our study, but time to payment can vary on the basis of practice and carrier factors that were not measured in our admin-istrative claims. Finally, we do not know the degree to which social influences facilitate behavior change in a global payment cut. Although 2015 CMS penalties were equivalent to less than $345 per physician,38 they accrued to the practice, and the ways practices identify and manage outliers are unknown.
Our study has limitations. First, we were unable to control for the proportion of a physician’s patients who were in fee-for service Medicare. However, few urology practices treat high proportions of Medicare patients, and urologists maintained stable portions of Medicare patients during this time.32-34 Second, we conducted our study among urologists. Much of cancer care is delivered by medical and radiation oncologists, and our results may not be generalizable to these providers. Future studies should address these groups specifically to compare how reimbursement changes, both small and large, affected their prescribing of GnRH agonists to complete our understanding of the clinical and practice contexts in which reimbursement does or does not change clinical decision making. Last, although rates of GnRH agonist use in our study mirror trends reported elsewhere,7,8our study is limited to Medicare patients older than 66 years who were treated by urologists.
Although policymakers and payers may view reimburse-ment change as a promising strategy to reduce overuse,39this was not necessarily the case for urologists experiencing average treatment-level variations in GnRH agonist reimbursement of 2.6% in our large, national sample of men with localized prostate cancer. Multiple sensitivity analyses supported our finding that reimbursement changes were not associated with practice patterns. Policy changes being implemented in 2015 also result in small reimbursement cuts to physicians.40Our findings suggest these changes may not influence patterns of care; however, additional research to identify the potentially nuanced way in which physicians respond to reimbursement changes is needed to further inform policy decisions.
Acknowledgment
Supported by National Cancer Institute (NCI) Grant No. R25CA116339 and a University of North Carolina (UNC) Lineberger Comprehensive Cancer Center Dissertation Completion Award (S.D.E.); American Cancer Society Grant No. MRSG-13-154-01-CPPB and a Urology Care Foundation/Astellas Rising Stars in Urology Research Award (M.E.N.); National Institutes of Health Building Interdisciplinary Research Careers in Women’s Health K12 Program and North Carolina Translational and Clinical Sciences Institute Grant No. UL1TR001111 (S.B.D.); and Senior Research Career Scientist Award No. 91-408 from the US Department of Veterans Affairs, Veterans Health Administration, Health Services Research and Development Service (M.W.). Views expressed are solely those of the authors and do not reflect the opinions of the Veterans Administration or the US government. Work on this study was supported by the Integrated Cancer Information and Surveillance System, UNC Lineberger Comprehensive Cancer Center with funding provided by the University Cancer Research Fund via the State of North Carolina. The American Medical Association is the source for the raw physician data. The NCI provided the SEER-Medicare linked data and reviewed the article for potential privacy violations. The collection of the California cancer incidence data used in this study was supported by the California Department of Public Health as part of the statewide cancer reporting program mandated by California Health and Safety Code Section 103885, the NCI’s SEER Program under Contract No. N01-PC-35136 awarded to the Northern California Cancer Center, Contract No. N01-PC-35139 awarded to the University of Southern California, and Contract No. N02-PC-15105 awarded to the Public Health Institute, and the Centers for Disease Control and Prevention’s National Program of Cancer Registries, under Agreement No. U55/ CCR921930-02 awarded to the Public Health Institute. The statistics, tables, ideas, and opinions expressed herein are those of the authors, and endorsement by the American Medical Association, State of California, Department of Public Health, NCI, and Centers for Disease Control and Prevention or their contractors and subcontractors is not intended and should not be inferred. The authors acknowledge the efforts of the Applied Research Program, NCI, Office of Research, Development, and Information, CMS, Information Management Services, and SEER Program tumor registries in the creation of the SEER-Medicare database.
Authors’Disclosures of Potential Conflicts of Interest
Disclosures provided by the authors are available with this article at
jop.ascopubs.org.
Author Contributions
Conception and design:Shellie D. Ellis, Stephanie B. Wheeler, George L. Jackson, William R. Carpenter, Morris Weinberger
Administrative support:William R. Carpenter
Collection and assembly of data:Shellie D. Ellis, William R. Carpenter
Data analysis and interpretation:Shellie D. Ellis, Ronald C. Chen, Stacie B. Dusetzina, Stephanie B. Wheeler, George L. Jackson, Matthew E. Nielsen, William R. Carpenter, Morris Weinberger
Manuscript writing:All authors
Final approval of manuscript:All authors
Corresponding author: Shellie Ellis, MA, PhD, Mail Stop 3044, 3901 Rainbow Blvd, Kansas City, KS 66160; e-mail:[email protected].
References
1.Centers for Medicare and Medicaid Services: Oncology Care Model. Baltimore, MD, Centers for Medicare and Medicaid Services, 2015
2.Newcomer LN: Innovative payment models and measurement for cancer therapy. J Oncol Pract 10:187-189, 2014
3.Rajkumar R, Conway PH, Tavenner M: CMS: Engaging multiple payers in payment reform. JAMA 311:1967-1968, 2014
5.Burwell SM: Setting value-based payment goals: HHS efforts to improve U.S. health care. N Engl J Med 372:897-899, 2015
6.Ellis SD, Nielsen ME, Carpenter WR, et al: Gonadotropin-releasing hormone agonist overuse: Urologists’ response to reimbursement and characteristics associated with persistent overuse. Prostate Cancer Prostatic Dis 18:173-181, 2015
7.Shahinian VB, Kuo YF, Gilbert SM: Reimbursement policy and androgen-deprivation therapy for prostate cancer. N Engl J Med 363:1822-1832, 2010
8.Elliott SP, Jarosek SL, Wilt TJ, et al: Reduction in physician reimbursement and use of hormone therapy in prostate cancer. J Natl Cancer Inst 102:1826-1834, 2010
9.Dinan MA, Robinson TJ, Zagar TM, et al: Changes in initial treatment for prostate cancer among Medicare beneficiaries, 1999-2007. Int J Radiat Oncol Biol Phys 82: e781-e786, 2012
10.Kuykendal AR, Hendrix LH, Salloum RG, et al: Guideline-discordant androgen deprivation therapy in localized prostate cancer: Patterns of use in the Medicare population and cost implications. Ann Oncol 24:1338-1343, 2013
11.Bahnson RR, Hanks GE, Huben RP, et al; National Comprehensive Cancer Network: NCCN practice guidelines for prostate cancer. Oncology (Williston Park) 14:111-119, 2000
12.National Comprehensive Cancer Network: Prostate cancer, in: NCCN Practice Guidelines in Oncology (ed v.1.2004). Fort Washington, PA, National Comprehensive Cancer Network, 2004
13.Weight CJ, Klein EA, Jones JS: Androgen deprivation falls as orchiectomy rates rise after changes in reimbursement in the U.S. Medicare population. Cancer 112: 2195-2201, 2008
14.Polite BN, Ward JC, Cox JV, et al: Payment for oncolytics in the United States: A history of buy and bill and proposals for reform. J Oncol Pract 10:357-362, 2014
15.Gilied S, Haninger K: Medicare Part B reimbursement of prescription drugs, in: Assistant Secretary for Planning and Evaluation Issue Brief. Washington, DC, Office of the Assistant Secretary for Planning and Evaluation, Office of Science and Data Policy, Department of Health and Human Services, 2014
16.Office of Inspector General: Medicare Reimbursement of Prescription Drugs. Philadelphia, PA, Office of Evaluation and Inspection’s Philadelphia Regional Office, 2001
17.Warren JL, Klabunde CN, Schrag D, et al: Overview of the SEER-Medicare data: content, research applications, and generalizability to the United States elderly population. Med Care 40:IV-3-18, 2002
18.Jacobson M, O’Malley AJ, Earle CC, et al: Does reimbursement influence chemotherapy treatment for cancer patients? Health Aff (Millwood) 25:437-443, 2006
19.Baldwin LM, Adamache W, Klabunde CN, et al: Linking physician characteristics and Medicare claims data: Issues in data availability, quality, and measurement. Med Care 40:IV-82-IV-95, 2002 (Suppl 8)
20.Gilbert SM, Kuo YF, Shahinian VB: Prevalent and incident use of androgen deprivation therapy among men with prostate cancer in the United States. Urol Oncol 29:647-653, 2011
21.Mehrotra A, Reid RO, Adams JL, et al: Physicians with the least experience have higher cost profiles than do physicians with the most experience. Health Aff (Millwood) 31:2453-2463, 2012
22.Foote SB, Wholey D, Halpern R: Rules for medical markets: The impact of Medicare contractors on coverage policies. Health Serv Res 41:721-742, 2006
23.Shahinian VB, Kuo YF, Freeman JL, et al: Determinants of androgen deprivation therapy use for prostate cancer: Role of the urologist. J Natl Cancer Inst 98:839-845, 2006
24.StataCorp LP: Stata/IC 12.1 for Windows. College Station, TX, StataCorp LP, 2013
25.Chang SL, Liao JC, Shinghal R: Decreasing use of luteinizing hormone-releasing hormone agonists in the United States is independent of reimbursement changes: A Medicare and Veterans Health Administration claims analysis. J Urol 182:255-260, 2009
26.Krahn M, Bremner KE, Tomlinson G, et al: Androgen deprivation therapy in prostate cancer: Are rising concerns leading to falling use? BJU Int 108:1588-1596, 2011
27.O’Shaughnessy MJ, Jarosek SL, Virnig BA, et al: Factors associated with reduction in use of neoadjuvant androgen suppression therapy before radical prostatectomy. Urology 81:745-751, 2013
28.Ehdaie B, Atoria CL, Gupta A, et al: Androgen deprivation and thromboembolic events in men with prostate cancer. Cancer 118:3397-3406, 2012
29.McKoy JM, Lyons EA, Obadina E, et al: Caveat medicus: Consequences of federal investigations of marketing activities of pharmaceutical suppliers of prostate cancer drugs. J Clin Oncol 23:8894-8905, 2005
30.Mitchell JM: Urologists’self-referral for pathology of biopsy specimens linked to increased use and lower prostate cancer detection. Health Aff (Millwood) 31: 741-749, 2012
31.Falit BP, Gross CP, Roberts KB: Integrated prostate cancer centers and over-utilization of IMRT: A close look at fee-for-service medicine in radiation oncology. Int J Radiat Oncol Biol Phys 76:1285-1288, 2010
32.Cunningham P, Staiti A, Ginsburg PB: Physician acceptance of new Medicare patients stabilizes in 2004-05. Track Rep 12:1-4, 2006
33.O’Leary MP, Baum NH, Blizzard R, et al; Health Policy Survey and Research Committee: 2001 American Urological Association gallup survey: Changes in physician practice patterns, satisfaction with urology, and treatment of prostate cancer and erectile dysfunction. J Urol 168:649-652, 2002
34.O’Leary MP, Baum NH, Bohnert WW, et al: 2003 American Urological Asso-ciation gallup survey: Physician practice patterns, cryosurgery/brachytherapy, male infertility, female urology and insurance/professional liability. J Urol 171:2363-2365, 2004
35.Shahinian VB, Kuo YF: Reimbursement cuts and changes in urologist use of androgen deprivation therapy for prostate cancer. BMC Urol 15:25, 2015
36.O’Shaughnessy MJ, Jarosek SL, Virnig BA, et al: Factors associated with reduction in use of neoadjuvant androgen suppression therapy before radical prostatectomy. Urology 81:745-751, 2013
37.Jacobson M, Earle CC, Price M, et al: How Medicare’s payment cuts for cancer chemotherapy drugs changed patterns of treatment. Health Aff (Millwood) 29: 1391-1399, 2010
38.Centers for Medicare and Medicaid Services: 2015 Value Modifier Results. Baltimore, MD, Centers for Medicare and Medicaid Services, 2015
39.Flodgren G, Eccles MP, Shepperd S, et al: An overview of reviews evaluating the effectiveness offinancial incentives in changing healthcare professional behaviours and patient outcomes. Cochrane Database Syst Rev 7:CD009255, 2011
AUTHORS’DISCLOSURES OF POTENTIAL CONFLICTS OF INTEREST
Are Small Reimbursement Changes Enough to Change Cancer Care? Reimbursement Variation in Prostate Cancer Treatment
The following represents disclosure information provided by authors of this manuscript. All relationships are considered compensated. Relationships are self-held unless noted. I = Immediate Family Member, Inst = My Institution. Relationships may not relate to the subject matter of this manuscript. For more information about ASCO’s conflict of interest policy, please refer towww.asco.org/rwcorjop.ascopubs.org/site/misc/ifc.xhtml.
Shellie D. Ellis
No relationship to disclose
Ronald C. Chen
Research Funding:Accuray
Stacie B. Dusetzina
No relationship to disclose
Stephanie B. Wheeler
No relationship to disclose
George L. Jackson Honoraria:Hayes
Matthew E. Nielsen
Consulting or Advisory Role:Grand Rounds
William R. Carpenter
No relationship to disclose
Morris Weinberger
Appendix
Reimbursement Generosity Calculation
The reimbursement generosity index was calculated as follows:
Rit ¼
å
g2gði;tÞPitg2PtgWtg
å
g2gði;tÞWtgwherePitgis the average reimbursement for patients receiving GnRH agonistgprescribed by provideriin yeart, andPtgis the SEER
average reimbursement of GnRH agonistgin yeart.Wtg, the weight for GnRH agonistg, is the ratio of SEER-wide spending on that regimen to total spending on all GnRH agonists. Each GnRH agonist regimen was dose standardized by converting each instance of GnRH agonist in use on separate days to a monthly dosing regimen. Intended duration was determined from the unit designation of the“carrier miles/time/ units/serv count”field in carrier claims or the“revenue center unit count”field in outpatient claims. Claims for 12-month implant were assumed to represent 12 months of therapy regardless of unit designation. The alternate RGIs considered in the sensitivity analyses treated all prostate cancer treatments combined (surgery, radiation, and surveillance) as a single treatment modality. In analyses including urologists who did not prescribe GnRH agonists, we considered the RGI to be equal to 0.
Control Variables Patient-level factors
Disease severity included tumor stage and grade, categorized as low (Gleason score 2 to 4) or intermediate (Gleason score 5 to 7). Comorbidities were measured by the National Cancer Institute Comorbidity Index (Klabunde CN, et al: Ann Epidemiol 17:584-590, 2007).8 Patient demographics included age, race/ethnicity, and marital status (married/living with partnervsingle, widowed, or divorced, or missing). Health care use included prior primary care use (any claim in the 12 months before diagnosis), (Feldstein PJ: Health Policy Issues: An Economic Perspective [4th ed], 2007) specialist consultation (three binary variables indicating more than one prostate-related claim filed by a radiation oncologist, urologist, or medical oncologist between diagnosis and the earliest of first treatment date or 12 months, Jang TL, et al: Arch Intern Med 170:440-450, 2010), and primary care consultation (more than one visit to the same primary care physician occurring in both the 12 months before diagnosis and the window between diagnosis and treatment, Jang TL, et al: Arch Intern Med 170:440-450, 2010). We also controlled for SEER region, collapsed by state, rurality of patient’s residence (urbanvrural), and community deprivation (quartiles of median income and proportion of adults with,12 years of education in the patients’ZIP code of residence, Fiscella K, et al: Med Care 39:8-14, 2001).
Provider-level factors
No prior cancer (n = 134,802)
Missing or invalid date of diagnosis (n = 489)
Reported at autopsy, death, or nursing home
(n = 174) < 66 years of age
at diagnosis (n = 46,631)
Without continuous Parts A and B Medicare
(n = 8,039)
Likely to have complete claims
(n = 55,829) With HMO
coverage (n = 23,640)
With multiple cancers
(n = 82) With invalid death date
(n = 4)
Missing stage (n = 1,491) Died within 12 months
of diagnosis (n = 2,514)
Treatment can be ascertained
(n = 51,738)
With low- or intermediate-risk cancer
(n = 36,242)
Had nonphysician treating provider
(n = 225) Less than 5 years life expectancy (n = 857)
Had no treatment claims (n = 3,432)
Treated by other specialty (n = 2,070)
Non-ADT using urologists (n = 323) Treated by
radiation oncologists (n = 12,868)
Missing data (n = 1)
Matched treating physician
(n = 31,728)
Patients (n = 16,789) treated by urologists (n = 2,213)
Patients (n = 15,128) treated by urologists (n = 1,800)
Men with adenocarcinoma of the
prostate diagnosed in 2000-2003 (N = 159,435)
Table A1.Treatment Claims
Treatment ICD-9 Codes CPT/HCPCS Codes
Androgen deprivation therapy (GnRH agonist)
J0128, J1950, J9202, J9217, J9218, J9219, J9225, J9226, J3315, C9216, C9430, or S0165
Nonsurveillance prostate treatment
60, 60.1, 60.21, 60.29, 60.3, 60.4, 60.5, 60.61-60.69, 62.3, 62.4, 62.41, 62.42, 92.2, 92.21, 92.22, 92.23, 92.24, 92.25, 92.26, 92.27, 92.28, 92.29, 99.25, V58.0, V58.1x, V66.1, V66.2, V67.1, V67.2
00865, 54520, 54522, 54530, 54535, 54690, 55801, 55810, 55812, 55815, 55821, 55831, 55840, 55842, 55845, 55860, 55866, 55873, 55875, 55876, 76873, 77301, 77305, 77310, 77315, 77321, 77326, 77327, 77328, 77338, 77371, 77372, 77373, 77380, 77381, 77402, 77403, 77404, 77406, 77407, 77408, 77409, 77411, 77412, 77413, 77414, 77416, 77418, 77423, 77432, 77435, 77520, 77522, 77523, 77525, 77750-77760, 77761, 77762, 77763, 77774, 77775, 77776, 77777, 77778, 77779, 77780, 77781, 77782, 77783, 77784, 77785, 77786, 77787, 77789, 77790, 77791-77798, 77799, G0356, J1675, J9000-J9164, 0073T, 0082T, 0083T, 0182T, 4164F, A9527, C1715, C1716, C1717, C1719, C1728, C2634, C2635, C2636, C2637, C2638, C2639, C2640, C2641, C2642, C2643, C2698, C2699, C9725, G0174, G0178, G0251, G0339, G0340, J1050, J1051, J9165, J9166-J9201, J9203-J9216, J9220-J9224, J9227- J9998, J9999, Q0083-Q0085, Q3001, S0175, S9560, C2616