*For correspondence:cpartch@ ucsc.edu (CLP); [email protected] (FHY)
Present address:†Department of Chemistry, University of North Carolina, Chapel Hill, United States
Competing interests:The authors declare that no competing interests exist.
Funding:See page 20
Received:19 February 2017 Accepted:31 July 2017 Published:01 August 2017
Reviewing editor: Dianne K Newman, Howard Hughes Medical Institute, California Institute of Technology, United States
Copyright Fong et al. This article is distributed under the terms of theCreative Commons Attribution License,which permits unrestricted use and redistribution provided that the original author and source are credited.
Structural dynamics of RbmA governs
plasticity of
Vibrio cholerae
biofilms
Jiunn CN Fong
1, Andrew Rogers
1, Alicia K Michael
2, Nicole C Parsley
2†,
William-Cole Cornell
3, Yu-Cheng Lin
3, Praveen K Singh
4, Raimo Hartmann
4,
Knut Drescher
4, Evgeny Vinogradov
5, Lars EP Dietrich
3, Carrie L Partch
2*,
Fitnat H Yildiz
1*
1
Department of Microbiology and Environmental Toxicology, University of
California, Santa Cruz, Santa Cruz, United States;
2Department of Chemistry and
Biochemistry, University of California, Santa Cruz, Santa Cruz, United States;
3Department of Biological Sciences, Columbia University, New York, United States;
4
Max Planck Institute for Terrestrial Microbiology, Marburg, Germany;
5National
Research Council, Ottawa, Canada
Abstract
Biofilm formation is critical for the infection cycle ofVibrio cholerae. Vibrioexopolysaccharides (VPS) and the matrix proteins RbmA, Bap1 and RbmC are required for the development of biofilm architecture. We demonstrate that RbmA binds VPS directly and uses a binary structural switch within its first fibronectin type III (FnIII-1) domain to control RbmA structural dynamics and the formation of VPS-dependent higher-order structures. The structural switch in FnIII-1 regulates interactions in trans with the FnIII-2 domain, leading to open (monomeric) or closed (dimeric) interfaces. The ability of RbmA to switch between open and closed states is important forV. choleraebiofilm formation, as RbmA variants with switches that are locked in
either of the two states lead to biofilms with altered architecture and structural integrity. DOI: https://doi.org/10.7554/eLife.26163.001
Introduction
In nature, microorganisms are predominantly found in biofilms, embedded within a matrix composed of exopolysaccharides, proteins, lipids and nucleic acids. Matrix components provide structural integrity, facilitate cell-cell and cell-surface attachment and enhance population fitness (Flemming and Wingender, 2010; Nadell et al., 2016). The molecular underpinnings of matrix assembly, however, is not fully understood.
We previously determined the crystal structure of RbmA, which showed that RbmA is composed of tandem fibronectin type III (FnIII) domains (Giglio et al., 2013). However, we do not yet under-stand the molecular mechanisms by which RbmA contributes to biofilm formation. To determine howV. cholerae biofilm matrix is built and how biofilms attain their structural integrity, we further characterized RbmA structure and analyzed the RbmA-VPS interaction. Here, we show that RbmA binds VPS directly to control the VPS-dependent formation of higher-order structures that modulate biofilm architecture and thatV. choleraebiofilms can be fine-tuned by RbmA structural dynamics.
Results
RbmA undergoes a binary structural switch
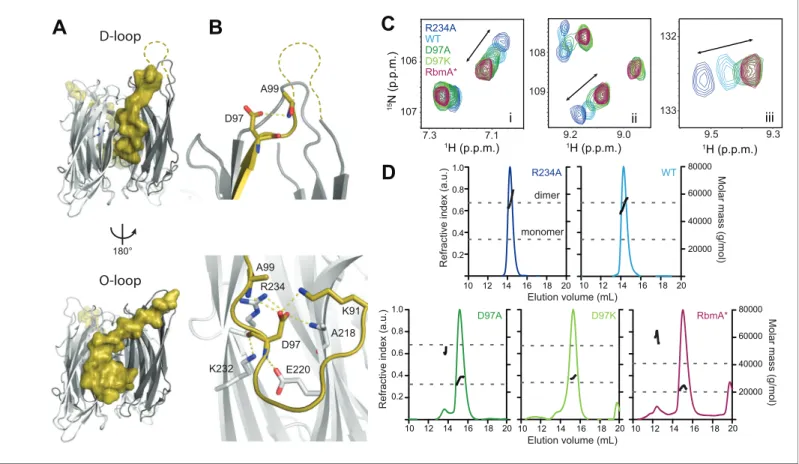
Structural analysis of RbmA revealed that two tandem FnIII domains (FnIII-1 and FnIII-2), which are connected by a short linker and interact in trans in an antiparallel orientation to form a stable dimer (Giglio et al., 2013;Maestre-Reyna et al., 2013). The native RbmA dimer is characterized by two distinct structures at the dimer interface in multiple crystal forms, where residues 91 to 108 of FnIII-1 adopt so-called disordered-loop (D-loop,Figure 1A, top) or ordered-loop (O-loop,Figure 1A, bot-tom) conformations (Giglio et al., 2013;Maestre-Reyna et al., 2013). In the O-loop conformation, thebc strand of the FnIII-1 domain is largely unfolded to facilitate a network of interactions between residue D97 and the FnIII-1 and FnIII-2 domains to stabilize the closed dimer interface, whereas these interactions are abolished in the D-loop conformation (Figure 1BandFigure 1—figure sup-plement 1). One key residue interacting with D97 in the O-loop conformation is FnIII-2 residue R234. We previously showed that the R234A mutant disrupted biofilm formation (Giglio et al., 2013), suggesting that regulation of this dimer interface might be important for RbmA function.
To explore how these two discrete conformations at the dimer interface impact RbmA structure and thereby biofilm formation, we first generated RbmA variants carrying a D97A or D97K mutation with the goal of disrupting O-loop interactions. We then compared 15N-1H TROSY-HSQC NMR spectra of uniformly 15N-labeled D97 mutants to wild-type (WT) and R234A RbmA. The overlaid spectra revealed several residues in the FnIII-2 domain, which were distal from any mutation sites that exhibited collinear chemical shifts reporting on a two-state equilibrium in fast exchange, with populations of the two states tuned by different mutations (Figure 1CandFigure 1—figure supple-ment 2). The endpoints of this two-state equilibrium are punctuated by the R234A and D97A or D97K mutants, suggesting that they represent discrete structural states of the switch. Each peak for the WT protein was located approximately halfway between the two endpoints, consistent with observations that the protein natively populates both states (Giglio et al., 2013; Maestre-Reyna et al., 2013).
To identify which of the two endpoints correspond to the O-loop and D-loop states, we also ana-lyzed the truncated, recombinant RbmA* protein, which corresponds to the predicted product of a regulated proteolytic event in vivo that disrupts the FnIII-1 domain (Smith et al., 2015). Comparing the15N-1H TROSY-HSQC spectrum of15N RbmA* to the full-length variants, we observed a striking similarity of the chemical shifts for the full-length D97 mutants and those of RbmA*, indicating that mutations at D97 lock RbmA into the open, D-loop conformation (Figure 1CandFigure 1—figure supplement 2). Based on the two states consistently observed in RbmA crystal structures (Giglio et al., 2013;Maestre-Reyna et al., 2013), this implies that the R234A mutation locks RbmA into the more closed O-loop conformation.
To further explore how the FnIII-1 switch regulates global structural differences in RbmA, we per-formed limited proteolysis on R234A (O-loop conformation), WT (O-loop and D-loop), and D97A (D-loop conformation) to probe for differential sensitivity to trypsin. We reasoned that the two locked
D97 A99
A
B
180° D97 E220 K232 K91 A99 R234 A218D
R234A WT10 12 14 16 18 20 10 12 14 16 18 20
0.2 0.4 0.6 0.8 1.0 R e fr a c ti v e i n d e x (a .u .) monomer dimer 20000 40000 60000 80000 M o la r ma ss (g /mo l) 0.2 0.4 0.6 0.8 1.0 R e fr a c ti v e i n d e x (a .u .)
Elution volume (mL)
D97A D97K RbmA*
20 20 20
10 12 14 16 18 10 12 14 16 18 10 12 14 16 18
Elution volume (mL)
20000 40000 60000 80000 M o la r ma ss (g /mo l)
C
R234A D97A RbmA* D97K WT iii ii i 106 107 108 109 132 133 9.5 9.3 9.2 9.0 7.3 7.1 1 5N (p .p .m. )1H (p.p.m.) 1H (p.p.m.)
1H (p.p.m.) D-loop
O-loop
Figure 1.RbmA binary switch regulates dimerization. (A) Two views of the RbmA dimer structure (PDB: 4KKP) with the FnIII-1 domain binary switch depicted in its two states (D-loop, O-loop) via surface representation (olive). Dashed line, backbone density missing in crystal structure. (B) Zoomed-in view of residue D97 in the two states of the switch. Residues that make polar contacts to D97 are highlighted. (C) Selected regions of overlaid1H-15N
TROSY-HSQC spectra of full-length15N RbmA proteins illustrating changes in the two-state equilibrium between wild-type (WT) and mutant proteins.
Panels i-iii represent portions of the TROSY-HSQC spectra; FnIII-2 domain residues exhibiting collinear shifts are as follows: (i) T180, (ii) G163, and (iii) S225. More information can be found inFigure 1—figure supplement 2. (D) Analysis of RbmA dimerization state by SEC-MALS. Dashed lines, calculated masses for monomer and dimer masses as indicated.
DOI: https://doi.org/10.7554/eLife.26163.002
The following figure supplements are available for figure 1:
Figure supplement 1.Larger view ofbc switch region. DOI: https://doi.org/10.7554/eLife.26163.003
Figure supplement 2.Mutations at D97 and R234 influence populations of the binary switch in RbmA. DOI: https://doi.org/10.7554/eLife.26163.004
Table 1.Size exclusion chromatography in-line with multi-angle light scattering (SEC-MALS) analysis.
Construct Calculated MW (kDa) (monomer: dimer) Observed MW (kDa)
WT 26.9: 53.8 1 peak; 51.8±0.5%
R234A 26.9: 53.8 1 peak; 55.2±0.8%
D97A 26.9: 53.8 1 peaks; 33.8±1.2%, 46.6±8.4%
D97K 26.9: 53.8 1 peak; 30.6±7.9%
RbmA* 22.0: 44.0 2 peaks; 25.7±7.9%, 59.8±20.8%
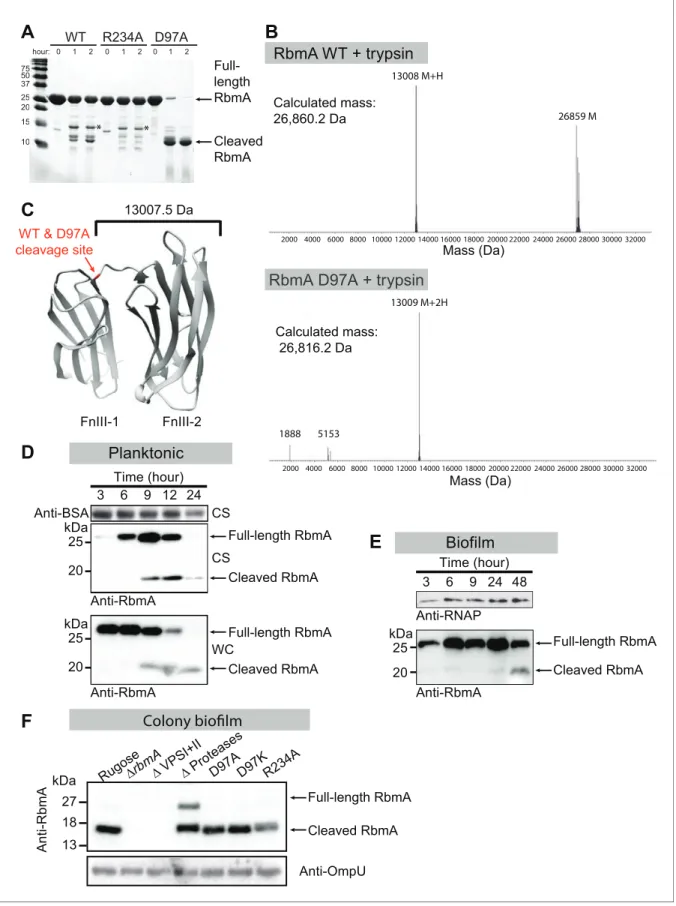
mutants (R234A and D97A) might have signature proteolytic sensitivities that would both be present in the WT protein due to its sampling of the two discrete states. The monomeric D97A mutant was rapidly proteolyzed down to a stable 13 kDa fragment comprising the FnIII-2 domain that was also observed to a lesser degree in the WT protein, but not in the R234A mutant (Figure 2A–C). The dimeric WT and R234A proteins both remained relatively stable to proteolysis and shared a higher molecular weight tryptic fragment. The relative protease-resistance of the R234A mutant in vitro is further evidence in that it adopts a closed conformation relative to the D97A/D97K mutants.
RbmA undergoes a proteolytic cleavage in vivo (Berk et al., 2012;Smith et al., 2015). We found that RbmA was readily cleaved in vivo in both planktonic and biofilm cultures (Figure 2D and E). To determine how changes to this binary switch in the FnIII-1 domain might influence RbmA proteolytic cleavage, we analyzed in vivo proteolysis of RbmA in the D97A, D97K and R234A variants and found that they produced the expected proteolytic products (Figure 2F). As a control, we included a strain lacking all three proteases (HapA, PrtV and IvaP) reported to cleave RbmA and showed that RbmA proteolysis is markedly decreased in this strain. In a strain lacking VPS, RbmA is completely degraded. As expected, RbmA proteolysis is decreased in the rugose variant (Figure 2D), which is characterized by increased VPS production relative to the wild-type smooth strain (Figure 2—figure supplement 1). As expected, RbmA proteolysis is decreased in rugose variant (Figure 2D), which are characterized by high VPS production, relative to wild-type smooth strain (Figure 2—figure sup-plement 1). Collectively, these data support a model in which RbmA natively samples both the O-loop and D-loop states to regulate dimer interfaces and protease accessibility in vivo.
RbmA uses a binary structural switch to govern biofilm architecture
To analyze consequences of this binary switch on regulation of biofilm formation by RbmA, we gen-erated mutated versions ofrbmA(D97A, D97K or R234A) in the chromosome. For these studies, we used a rugose variant of a clinicalV. choleraeO1 El Tor strain, as this strain produces ample matrix components (Yildiz and Schoolnik, 1999; Yildiz et al., 2014). Production and secretion of RbmA harboring the mutations was similar to that of the parental strain (Figure 3—figure supplement 1).To analyze overall biofilm architecture, we first compared structures of biofilms formed at solid-air interfaces by examining differences in corrugation patterns of colony biofilms. Strains harboring the D97A and D97K mutations retained the colony corrugation pattern of the rugose parental strain, while strains lacking RbmA (DrbmA) or harboring the R234A mutation exhibited a marked decrease in colony corrugation (Figure 3A). The strains also varied in the colony corrugation development as a function of time, withDrbmAand R234A showing uniform spreading, D97A and D97K showing irregular spreading, and the parental rugose strain showing an intermediate spreading phenotype (Figure 3B,Figure 3—figure supplement 2F, andVideo 1). In dark-field colony images of thin sec-tions prepared at 48 hr, the rugose, D97A, and D97K strains all showed similar vertical wave-like fea-tures of biomass distribution. In contrast, the internal colony strucfea-tures of the DrbmA and R234A strains were more uniform (Figure 3B). Although colony heights were similar among all of the strains tested (Figure 3—figure supplement 2E), colony outgrowth of D97 mutants was reduced when compared to the parental rugose strain. Thus, colony biofilms of the rugose parental strain exhibit features observed in mutants representative of both the O-loop and D-loop states of RbmA, with uniform outgrowth akin to that observed for the locked O-loop mutant (R234A) and internal features reminiscent of those observed in the locked D-loop mutants (D97A, D97K).
We then analyzed micro-colony and mature biofilm formation at the solid-liquid interface using flow-cells. BothDrbmAand R234A strains formed micro-colonies with edges that are more smooth and regularly-shaped as opposed to the irregularly-shaped micro-colonies observed in the parental strain (Figure 3C). Quantitative and microscopic analysis of mature biofilms formed byDrbmAand R234A revealed that they were less structured and exhibited a decrease in biomass and thickness; the biofilm properties of D97A/D97K mutants more closely resembled that of the parental strain (Figure 3D and Figure 3—figure supplement 2A–C). Biofilms of R234A and DrbmA strains also exhibited increased cell detachment, resulting in higher colony forming units (CFU) per effluent vol-ume when compared to the parental strain and D97A/D97K mutants (Figure 3—figure supplement 2D).
25 20 kDa
C
FnIII-1 FnIII-2 13007.5 DaWT & D97A cleavage site
A
10 15 20 25 37 50 75WT R234A D97A
1 2 1 2 1 2
hour: 0 0 0
Full-length RbmA Cleaved RbmA * *
D
Anti-BSA CS3 6 9 12 24
Planktonic
CS
Anti-RbmA Time (hour)
B
2000 4000 6000 8000 10000 12000 14000 16000 18000 20000 22000 24000 26000 28000 30000 32000 Mass (Da)
26859 M 13008 M+H
Calculated mass: 26,860.2 Da
RbmA WT + trypsin
13009 M+2H
5153 1888
2000 4000 6000 8000 10000 12000 14000 16000 18000 20000 22000 24000 26000 28000 30000 32000 Mass (Da)
Calculated mass: 26,816.2 Da
RbmA D97A + trypsin
Full-length RbmA Cleaved RbmA Anti-RbmA WC Full-length RbmA Cleaved RbmA
Biofilm
E
Time (hour)3 6 9 24 48
Anti-RNAP Anti-RbmA Full-length RbmA Cleaved RbmA 25 20 kDa 25 20 kDa
F
Colony biofilm
27 18 kDa Full-length RbmA Anti-OmpU 13 Rugo se
∆ Pro
teas es
∆rb
mA
D97AD97KR234 A A n ti -R b m A
∆ VP
SI+I I
Cleaved RbmA
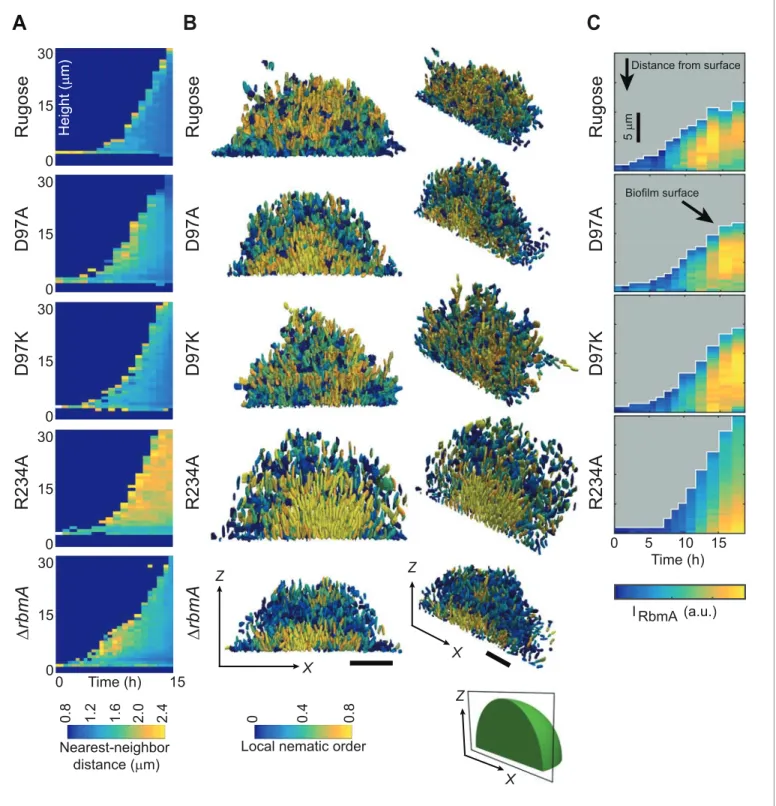
following order: rugose, D97K, D97A,DrbmA, R234A. Examination of internal cell arrangements in the biofilm revealed that cells in direct contact with the glass substratum are vertically oriented in the R234A mutant (Figure 4BandFigure 4—figure supplement 1). Such vertical orientation of cells in contact with the substratum is also displayed by theDrbmA strain, albeit to a lesser extent. By contrast, cells of the rugose strain that are in contact with the substratum are mostly radially aligned and horizontal. The D97 mutant strains seem to broadly have similar cell orientations, which are dif-ferent from both the rugose and the R234A strains. With respect to local nematic order, a measure of the degree of local alignment of the cells (see definition in the Materials and Methods), R234A exhibits a nearly crystal-like cellular alignment in the center and at the bottom of the biofilm (Figure 4B). By contrast, decreased nematic order with the D-loop locked mutants and wild-type RbmA strain suggests that sampling the O-loop conformation leads to decreases in local cell alignment.
To determine if the differences in biofilm architectural properties of strains with RbmA variants are due to alterations in localization of RbmA, we determined the RbmA distribution during biofilm formation. For rugose, D97A, and D97K strains, the RbmA localization was similar, where RbmA is distributed between the surface of the biofilm and the center of the biofilm (Figure 4C). In contrast, in the R234A strain, RbmA abundance was high at the center of the biofilm, and decreased towards the surface.
Collectively, these data demonstrate that changes in the conformation and/or dimerization state of RbmA alter biofilm architectural properties. Locking RbmA in the closed, O-loop dimer state with the R234A mutation severely affects biofilm formation, while the locked, monomer D-loop state (D97A/D97K) more closely resembles the native role of RbmA in biofilm regulation and that differen-ces in biofilm architecture could be due to changes in RbmA localization.
RbmA binds VPS via FnIII-2 domain and forms higher-order structures
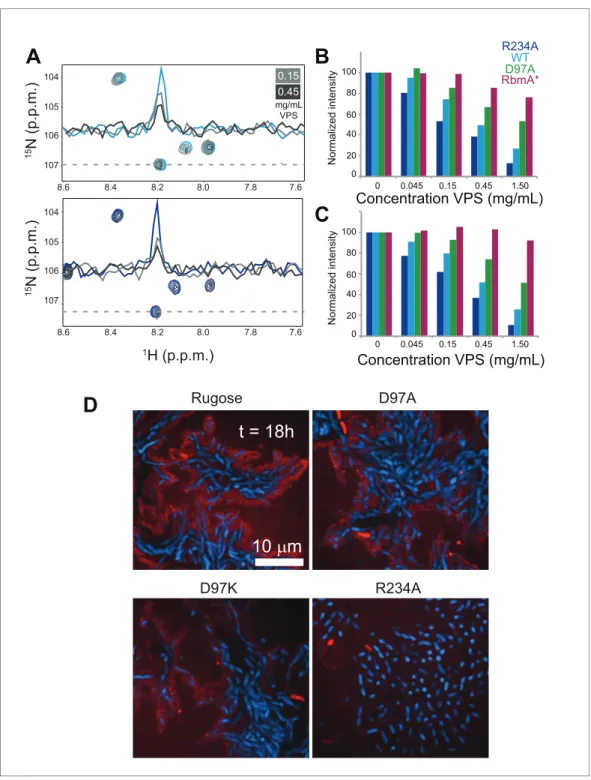
Based on the extensive role of RbmA in biofilm structure and function and noted requirement of VPS for accumulation of RbmA in the biofilm matrix (Berk et al., 2012; Nadell et al., 2015), we hypothesized that RbmA might govern biofilm structural and functional properties by interacting with VPS. To first explore RbmA-VPS interactions, we collected15N-1H TROSY-HSQC spectra in the presence of increasing concentrations of native VPS isolated fromV. choleraeand monitored chemi-cal shift perturbations in full-length15N RbmA. We found that addition of VPS induced uniform peak broadening in 15N RbmA spectra, consistent with formation of higher-order soluble oligomers (Figure 5A). Similar changes in peak intensity were also observed in VPS binding experiments with 15N RbmA R234A, suggesting that remarkable functional differences between WT and R234A RbmA might not lie in its ability to bind VPS. To determine if perturbation of the FnIII-1 switch influenced formation of higher-order soluble aggregates with VPS, we collected 1D 1H NMR spectra of full-length WT, R234A, D97A, and the truncated RbmA* protein in the presence of increasing VPS. Inte-grating peak intensity from either the amide region (11 to 5.5 p.p.m.) (Figure 5BandFigure 5—fig-ure supplement 1) or side chain region (2.5 to 1 p.p.m.) (Figure 5C and Figure 5—figure supplement 1) of the1H spectra demonstrated that the extent of peak broadening correlates with formation of the locked species. Based on these data, we suggest that binding to VPS by RbmA results in the formation of higher-order RbmA-VPS structures that are governed by the structural dynamics of the binary switch in RbmA.
Figure 2 continued
spectrometry for tryptic digests of WT and D97A proteins, showing the predominant cleaved species in RbmA WT (~13 kDa and~26.8 kDa fragments) and D97A (~13 kDa fragment). (C) Location of the cleavage site (red) conserved between WT and D97A proteins mapped onto the RbmA dimer structure (PDB: 4KKP). Western blot analysis of RbmA stability in (D) rugose planktonic and (E) flowcell biofilm cells at various growth phases, and (F) colony biofilm cells after 24 hr of growth. Antibodies against bovine serum albumin (anti-BSA), RNA polymerase (anti-RNAP) and outer membrane protein U (anti-OmpU) were used as additional loading controls. Culture supernatant (CS) fraction fractions were spiked with BSA. WC, whole-cell fraction.
DOI: https://doi.org/10.7554/eLife.26163.006
The following figure supplement is available for figure 2:
B
R
u
g
o
s
e
∆
rb
m
A
D
9
7
K
D
9
7
A
R
2
3
4
A
R
2
3
4
A
D
9
7
A
D
9
7
K
R
u
g
o
s
e
∆
rb
m
A
A
Rugose
∆
rbmA
D97A
D97K
R234A
C
D
R
2
3
4
A
D
9
7
A
D
9
7
K
R
u
g
o
s
e
∆
rb
m
A
Figure 3.RbmA loop conformational transitions impacts biofilm architecture. (A) Colony corrugation phenotypes and (B) darkfield images of thin-sectioned paraffin-embedded spot colonies after 5 and 2 days of growth, respectively, at 25
˚
C. Scale bars, 0.5 mm (inA), 1 mm (inB). (C) Cell-packing and (D) mature biofilm phenotypes of rugose strain,DrbmAand various mutant strains at 6 hr and 24 hr, respectively. Scale bars, 10mm (inC), 40mm (inD).
To investigate how VPS is organized in biofilms of rugose, D97A, D97K, and R234A strains, we analyzed VPS localization with FITC-conjugated wheat-germ agglutinin (WGA) and concanavalin A (ConA). We found that VPS is localized around cell clusters in the rugose, D97A and D97K strains (Figure 5D). However, in the R234A strain, VPS localization was diffuse and reduced. These findings suggest that structural properties of RbmA affects VPS localization in biofilms.
To begin to explore molecular basis of VPS binding by RbmA, we first studied the isolated15 N-labeled FnIII domains and RbmA* by NMR spectroscopy. We observed that the full-length protein can undergo spontaneous cleavage in the FnIII-1 domain near the interdomain linker (Figure 6Aand Figure 6—figure supplement 1A–C), resulting in a highly stable 13 kDa protein. Importantly, the 15
N-1H HSQC spectrum of the cleaved form closely resembles the RbmA* variant, although it lacked the poorly dispersed peaks in the center of the spectrum (8.0–8.5 p.p.m.) that correspond to the unfolded FnIII-1 fragment remaining in RbmA* (Figure 6—figure supplement 1D–I). Well-resolved peaks in the RbmA* spectrum also exhibited marked similarity to the isolated15N FnIII-2 domain. An 15
N-1H HSQC spectrum of the isolated15N FnIII-1 domain exhibited poor chemical shift dispersion and a tendency to form soluble aggregates, indicating that this domain is not stably folded in isola-tion. Altogether, these data suggest that the FnIII-2 domain is the stable core domain of RbmA and its natively processed form, RbmA*, possibly regulates the structural integrity of the FnIII-1 domain through formation of the dimer.
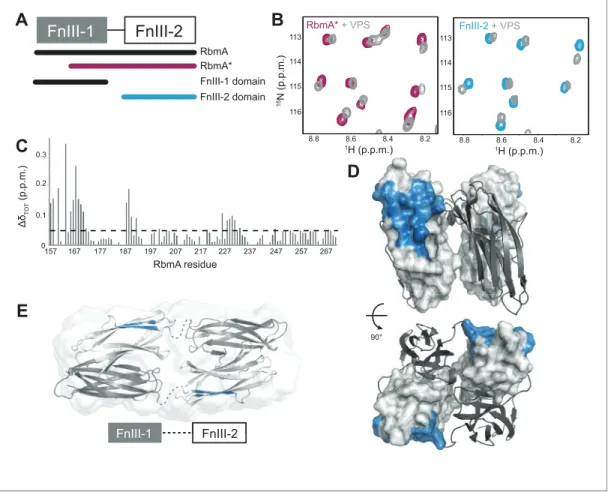
Because RbmA* largely retains RbmA function and has been reported to bind to VPS-containing cells in vivo (Smith et al., 2015), we examined whether this truncated form binds VPS directly. We collected 15N-1H HSQC spectra of 15N RbmA* in the presence and absence of VPS, observing a number of dose-dependent chemical shift perturbations consistent with VPS binding; the same chemical shifts were also found upon titration of VPS into the isolated 15N FnIII-2 domain (Figure 6B). Chemical shift assignment of the isolated FnIII-2 domain allowed us to identify residues throughout the domain with significant VPS-dependent chemical shift perturbations (Figure 6C). When mapped onto the crystal structure of the RbmA dimer, these residues form one contiguous patch on the exposed outer surface of the FnIII-2 domain that likely constitutes the VPS binding site (Figure 6D). This interface is distinct from that used to form the RbmA dimer through interaction with the FnIII-1 domain. The presence of two such motifs on each RbmA dimer therefore suggests the possibility for multivalent binding to VPS. Moreover, solution studies of RbmA have demon-strated that the two halves of the dimer, separated by flexible interdomain linkers, can open to form an extended conformation (Figure 6E), suggesting that the VPS-binding interface could regulate RbmA function by possibly contributing to the formation of different conformations in solution.
To determine if R234 plays a direct role in VPS binding, we carried out NMR studies using the iso-lated15N FnIII-2 domain harboring the R234A mutation. Introduction of the mutation induces chemi-cal shift perturbations that are lochemi-calized primarily
at the mutation site on the side of the FnIII-2 domain, which does not overlap with the puta-tive VPS binding site (Figure 6—figure supple-ment 2). Correspondingly, we found minimal effect of the R234A mutation on VPS binding by the full-length proteins in our NMR titration studies (Figure 5A–C), indicating that R234 does not appear to directly influence VPS binding. Figure 3 continued
DOI: https://doi.org/10.7554/eLife.26163.008
The following figure supplements are available for figure 3:
Figure supplement 1.Analysis of RbmA production and degradation. DOI: https://doi.org/10.7554/eLife.26163.009
Figure supplement 2.Quantitative analysis of (A) biofilm biomass, (B) average biofilm thickness, (C) maximum biofilm thickness, and (D) colony counts (CFU/mL) in the effluent of the biofilms formed by the rugose strain,DrbmAand various mutant strains at 24 hr post-inoculation as determined by COMSTAT and dilution plating analysis.
DOI: https://doi.org/10.7554/eLife.26163.010
Video 1.Time lapse movie of colony biofilm
0 30 15
∆
rb
m
A
∆
rb
m
A
B
Z X Z X0 0.4 0.8
Local nematic order
C
A
0.8 1.2 1.6 2.0 2.4
Nearest-neighbor distance (µm) 0 30 15 H e ig h t ( µ m) 15 0 Time (h)
R
2
3
4
A
0 30 15R
2
3
4
A
R
u
g
o
s
e
0 30 15D
9
7
A
D
9
7
A
0 30 15D
9
7
K
D
9
7
K
R
u
g
o
s
e
R
2
3
4
A
D
9
7
A
D
9
7
K
R
u
g
o
s
e
0 5 10 15 Time (h)
I (a.u.)RbmA
Distance from surface
Biofilm surface 5 µ m Z X
Figure 4.Biofilm development at single-cell resolution. (A) Average nearest-neighbor distance between individual cells, measured as a function of time and height of a biofilm colony. At each time point in this heatmap, the spatial variation of the nearest-neighbor distance inside the biofilm colony is represented as a single column, which shows the distribution of the nearest-neighbor distance between cells as a function of height in the biofilm. (B) Reconstructions of biofilms containing approximately 1500 cells, looking at thex-z-plane that cuts through the center of the biofilm colony. Each cell is color-coded according to the local nematic order in its vicinity. Scale bars, 10mm. (C) RbmA localization within biofilms of rugose, D97A, D97K and R234A strains as a function of time. At each time point in the heatmap, the spatial variation of the intensity of the RbmA immunofluorescence (IRbmA) is
represented as a single column, which represents the RbmA abundance as a function of distance from the outer surface of the biofilm. DOI: https://doi.org/10.7554/eLife.26163.012
Because we observed that the FnIII-2 domain interacts directly with VPS, we analyzed the contri-bution of individual FnIII domains and RbmA* in colony biofilm formation. To this end, we expressed the coding regions of wild-type RbmA, isolated FnIII domains, or RbmA* in trans and examined abil-ity of these proteins to complement a defect in colony biofilm phenotypes of the DrbmA strain.
DrbmAstrains harboring various expression plasmids phenocopied theDrbmAstrain carrying vector when grown in the absence of inducer (Figure 6—figure supplement 3). Expression of the FnIII-2 domain in any form (prbmA, prbmA*, pFnIII-2) partially complemented the colony biofilm pheno-type, indicating that FnIII-2 domain alone can contribute to biofilm architecture. Expression of FnIII-1 domain alone in theDrbmAstrain increased colony compactness when compared toDrbmA harbor-ing the vector, albeit to smaller extent, suggestharbor-ing that the FnIII-1 domain alone, at least in part, may also contribute to biofilm development.
Discussion
The importance of matrix proteins for assembly and structural integrity of biofilms is well docu-mented in several microbial species. InPseudomonas aeruginosa, CdrA adhesin directly binds to the Psl polysaccharide and facilitates cell-cell aggregation and biofilm maturation (Borlee et al., 2010). In Bacillus subtilis, amyloid-like fiber-producing protein TasA, bacterial hydrophobin BslA, and an exopolysaccharide are required for formation of mature biofilm architecture and development of a hydrophobic layer on the surface of biofilms. It is proposed that TasA, BslA, and exopolysaccharide interact to facilitate matrix assembly (Branda et al., 2006;Ostrowski et al., 2011;Kobayashi and Iwano, 2012;Hobley et al., 2013). InV. cholerae, biofilm formation relies on polysaccharides (VPS) and the matrix proteins RbmA, RbmC, and Bap1. The molecular interactions between matrix compo-nents and the mechanisms by which bacteria achieve spatial segregation of exopolysaccharides and proteins within the biofilm are poorly understood. This study demonstrates that a patch on the exposed outer surface of the FnIII-2 domain of RbmA binds to VPS and that RbmA has a bistable switch that influences dimerization and the formation of higher-order oligomers of RbmA with VPS. Regulation of RbmA structure by structural dynamics plays a critical role in its ability to modulate biofilm architecture (Figure 7).
We speculate that during initial stages of biofilm formation, when concentrations of secreted VPS are low, full-length RbmA is best able to capture cell surface-localized VPS with high avidity due to the presence of two FnIII-2 domains in the dimer. Since the binary switch in RbmA is inherently dynamic, the O-loop and D-loop states that are
present at FnIII-1:FnIII-2 dimer interfaces there-fore have the potential to regulate the formation of distinct higher-order RbmA-VPS structures. We observed that locking both of the FnIII-1: FnIII-2 interfaces into the closed, O-loop state with the R234A mutation enhanced the forma-tion of VPS-dependent higher-order structures, leading to the formation of biofilm with reduced corrugation, increased cell-cell distance, and altered RbmA localization. Additionally, VPS staining in R234A strain is reduced, which could be a result from decreased accessibility of lectin targets due to strong interaction of RbmA-R234A to VPS. By contrast, the D97A/K muta-tions that open the protein to a monomeric state more closely resemble the native cellular Figure 4 continued
The following figure supplement is available for figure 4:
Figure supplement 1.Nearest-neighbor distance, vertical orientation, radial orientation and volume of individual cell in the biofilms formed by rugose parental strain and various mutants, analyzed at single-cell resolution.
DOI: https://doi.org/10.7554/eLife.26163.013
Video 2.Reconstructions of 3D biofilm containing approximately 1500 cells of rugose strain and various rbmAmutants. Color code depicts average distance to the nearest neighbor.
A
B
N
o
rm
a
liz
e
d
i
n
te
n
s
it
y
Concentration VPS (mg/mL) 100
80
60
40
20
0
N
o
rm
a
liz
e
d
i
n
te
n
s
it
y 100
80
60
40
20
0
C
104105
106
107
104
105
106
107
8.6 8.4 8.2 8.0 7.8 7.6
8.6 8.4 8.2 8.0 7.8 7.6
1
5N
(p.p.m.)
1
5N
(p.p.m.)
1H (p.p.m.)
0 0.045 0.15 0.45 1.50
Concentration VPS (mg/mL) 0 0.045 0.15 0.45 1.50
mg/mL VPS
0.15 0.45
R234A
D97A RbmA*
WT
D
R234A D97A
D97K Rugose
t = 18h
10
µ
m
Figure 5.VPS binding induces formation of higher order structures in full-length RbmA dimers. (A) Selected regions of overlaid1H-15N TROSY-HSQC spectra of full-length15N RbmA WT (top) and R234A (bottom). Dashed
line represents horizontal trace for peak intensity analysis shown above. Blue, spectra of protein alone; Grays, addition of VPS as indicated. (B) Normalized peak intensities for amide and (C) side chain regions of1H spectra of
full-length15N RbmA proteins in the presence of increasing concentrations of VPS. (D) VPS localization within
biofilms of rugose, D97A, D97K and R234A strains at 18 hr post-inoculation. Cells were pseudo-colored blue, while VPS was pseudo-colored red.
DOI: https://doi.org/10.7554/eLife.26163.015
The following figure supplement is available for figure 5:
organization in the biofilm. Therefore, it appears that the ability of RbmA to take on an open, D-loop state is apparently critical for governing biofilm architecture.
Enhanced interaction of RbmA with VPS could affect a network of interactions between VPS and other matrix proteins. Our earlier work showed that sustained incorporation of VPS throughout bio-films requires RbmC and that in the absence of RbmA, distribution of Bap1 and RbmC around the cluster envelope is altered (Berk et al., 2012). It is likely that localization of RbmC and VPS is altered in R234A strain, leading to altered biofilm architecture and stability. RbmA has also been shown to bind to glycans found inV. choleraelipopolysaccharide (Maestre-Reyna et al., 2013). Thus, it is also possible that interaction of RbmA with other cell surface polysaccharides or biofilm matrix proteins may be governed by conformational dynamics to regulate cell-spacing and biofilm architecture.
As biofilm formation progresses, RbmA undergoes a regulated proteolytic event that shifts the entire population of RbmA to the monomeric, open D-loop state that we observed with the RbmA*
B
15N
(p
.p
.m.
)
1H (p.p.m.)
113
114
115
116
113
114
115
116
8.8 8.6 8.4 8.2
1H (p.p.m.)
8.8 8.6 8.4 8.2
RbmA* + VPS FnIII-2 + VPS
1H (p.p.m.) 1H (p.p.m.)
D
90°
C
Δδ
T
O
T
(p
.p
.m.
)
RbmA residue
157 0 0.1 0.2 0.3
167 177 187 197 207 217 227 237 247 257 267
E
FnIII-1 FnIII-2
FnIII-1 FnIII-2
A
RbmA* RbmA
FnIII-1 domain
FnIII-1
FnIII-2
FnIII-2 domain
Figure 6.RbmA FnIII-2 domain binds VPS. (A) Schematic representation of RbmA structure. (B) Zoomed-in regions of1H-15N HSQC spectra of15N RbmA proteins in the absence (RbmA*, magenta; FnIII-2 domain, blue) and presence (gray) of 4.5 mg/mL VPS. (C) Total backbone chemical shift perturbations (DdTOT) of15N RbmA FnIII-2 domain upon addition of 4.5 mg/mL VPS. Dashed line,DdTOTsignificance cutoff of 0.05 p.p.m. (D) FnIII-2
domain residues with significantly perturbed chemical shifts (blue) mapped onto RbmA dimer crystal structure (PDB: 4KKP). FnIII-1 domain shown in cartoon representation (gray), and the FnIII-2 domain shown in surface representation (white). (E) VPS-binding site mapped in blue on dimeric RbmA in its low-resolution solution envelope (Giglio et al., 2013) (same domain coloring as above).
DOI: https://doi.org/10.7554/eLife.26163.017
The following figure supplements are available for figure 6:
Figure supplement 1.Domain mapping and characterization of RbmA FnIII domains. DOI: https://doi.org/10.7554/eLife.26163.018
Figure supplement 2.NMR analysis of the FnIII-2 domain R234A mutation. DOI: https://doi.org/10.7554/eLife.26163.019
VPS
VPS
R234A
VPS
VPS
WT
VPS D97A/D97K
VPS RbmA*
VPS FnIII-2
A
R234A Rugose D97A D97K
B
RugoseD97A D97K
R234A R234A
RbmA VPS
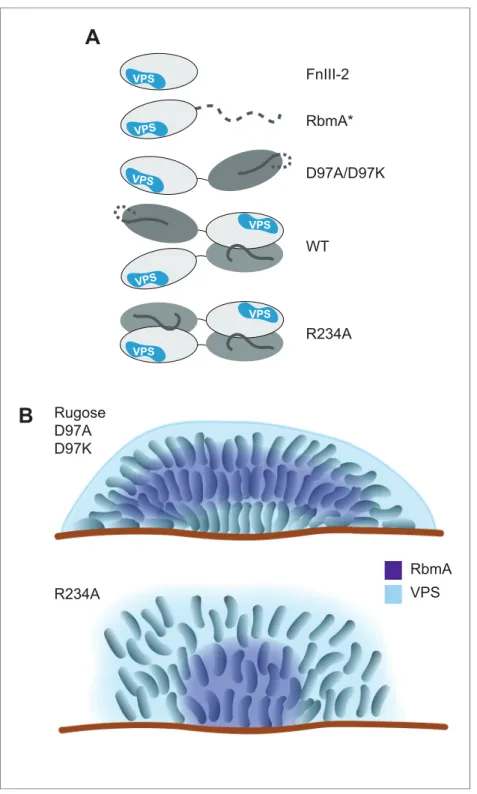
Figure 7.Models of various RbmA variants and their involvement in biofilm formation. (A) Cartoon models representing the various RbmA oligomerization and switch states. The VPS binding is indicated in blue on the FnIII-2 domain (white); dashed line indicates flexible or unfolded protein. The binary switch is represented exclusively in the open state (D-loop conformation) in the D97A/D97K mutants, and at partial occupancy in the WT protein, while the R234A mutant depicts the binary switch in its closed state (O-loop conformation). Dimeric forms of RbmA (WT, R234A) are drawn in their elongated form, as supported by small angle x-ray scattering studies in solution (Giglio et al., 2013). (B) Cell organization and RbmA localization in the biofilms of rugose,DrbmAand variousrbmAmutants. RbmA, represented in purple, is distributed between the surface and the center of the biofilms in rugose and D97 mutants; while in R234A mutant, RbmA localizes at the center of the biofilm with decrease abundance towards the surface. VPS represented in blue and enhanced VPS localization around the biofilm cluster is represented as a thick blue line.
variant. We determined that RbmA FnIII-2 domain is sufficient for VPS binding in vitro and that expression of FnIII-2 domain or RbmA* alone is able to confer colony corrugation, suggesting that the FnIII-2 domain and RbmA* can cross link VPS polymers. RbmA* might be expected to exhibit reduced affinity for VPS, due to the presence of only one FnIII-2 domain in the monomer. However, at this stage of biofilm formation, increased production and accumulation of VPS in the biofilm could possibly compensate for this reduced affinity. Interestingly, it has been reported that while full-length RbmA only binds VPS-producing cells, RbmA* binds both VPS-producing and non-producing cells suggesting a mechanism by which proteolytic regulation of RbmA may help recruit cells that have not yet initiated VPS production (Smith et al., 2015). While we know that RbmA proteolysis occurs when cells are entering early stationary growth phase due to production of HapA, PrtV and IvaP proteases (Smith et al., 2015;Hatzios et al., 2016), where RbmA proteolysis is taking place within the biofilm during its formation and the complete consequences of proteolytic processing of RbmA remain to be determined.
Our study revealed how behavior of an individual biofilm matrix component contributes to biofilm architecture. Shifting the structural dynamics of RbmA appears to be an important mechanism regu-lating biofilm formation and shaping biofilm architecture. A patch on the exposed outer surface of the FnIII-2 domain constitutes the VPS binding site and binding of VPS to the outer surface of the RbmA dimer is a likely key step in mediating cell-cell adhesion inV. choleraebiofilms. Future studies will elucidate which components of VPS are important for interactions with RbmA, as well as defining the VPS binding site on the protein at high resolution to provide a complete picture of how RbmA interacts with VPS and contribute to the construction of biofilm matrix.
Materials and methods
Bacterial strains, plasmids, and culture conditions
The bacterial strains and plasmids used in this study are listed inTable 2. TheV. choleraerugose var-iant was used as a parent strain (Yildiz and Schoolnik, 1999). Mutants were generated in the rugose genetic background. V. choleraeand Escherichia colistrains were grown aerobically, at 30
˚
C and 37˚
C, respectively, unless otherwise noted. Cultures were grown in Luria-Bertani (LB) broth (10 g/L tryptone, 5 g/L yeast extract, 10 g/L NaCl), pH 7.5, unless otherwise noted. LB agar medium con-tains 1.5% (w/v) granulated agar (BD Biosciences, Franklin Lakes, NJ). Concentrations of antibiotics and inducer used, when appropriate, were as follows: ampicillin (Ap), 100mg/mL; rifampicin (Rif), 100mg/mL; gentamicin (Gm), 50mg/mL and isopropylb-D-1-thiogalactopyranoside (IPTG), 0.1 to 0.5 mM. In-frame deletion, point mutation and GFP-tagged strains were generated according to proto-cols previously published (Fong et al., 2006;Fong et al., 2010;Giglio et al., 2013).Recombinant DNA techniques
DNA manipulations were carried out by standard molecular techniques according to manufacturer’s instructions. Gibson Assembly master mix, restriction and DNA modification enzymes were pur-chased from New England Biolabs (NEB, Ipswich, MA). Polymerase chain reactions (PCR) were car-ried out using primers purchased from Integrated DNA Technologies (IDT, San Diego, CA) and the Phusion High-Fidelity PCR kit (NEB, Ipswich, MA), unless otherwise noted. Primers used in the pres-ent study are listed inSupplementary file 1. Constructs were verified by DNA sequencing (UC Ber-keley DNA Sequencing Facility, BerBer-keley, CA). The coding regions of wild-typerbmA, D97A, D97K, and R234A (residues E31 to K271),rbmA*(residues K75 to K271), FnIII-1 (residues E31 to D154) and FnIII-2 (residues E160 to K271) were cloned into the expression vectors (pGEX-6P-2 or pHisGST) by Gibson Assembly or conventional restriction cloning. For complementation,rbmA*(residues K75 to K271), FnIII-1 (residues E31 to D154) and FnIII-2 (residues E160 to K271) were cloned into pMMB67EH, with the addition of a start codon (ATG) and theV. choleraeRTX type I secretion signal at the 5’ and 3’ ends, respectively. Chromosomal Myc tagging ofrbmAwere carried out by allelic exchange according to previous published protocol (Berk et al., 2012).
Figure 7 continued
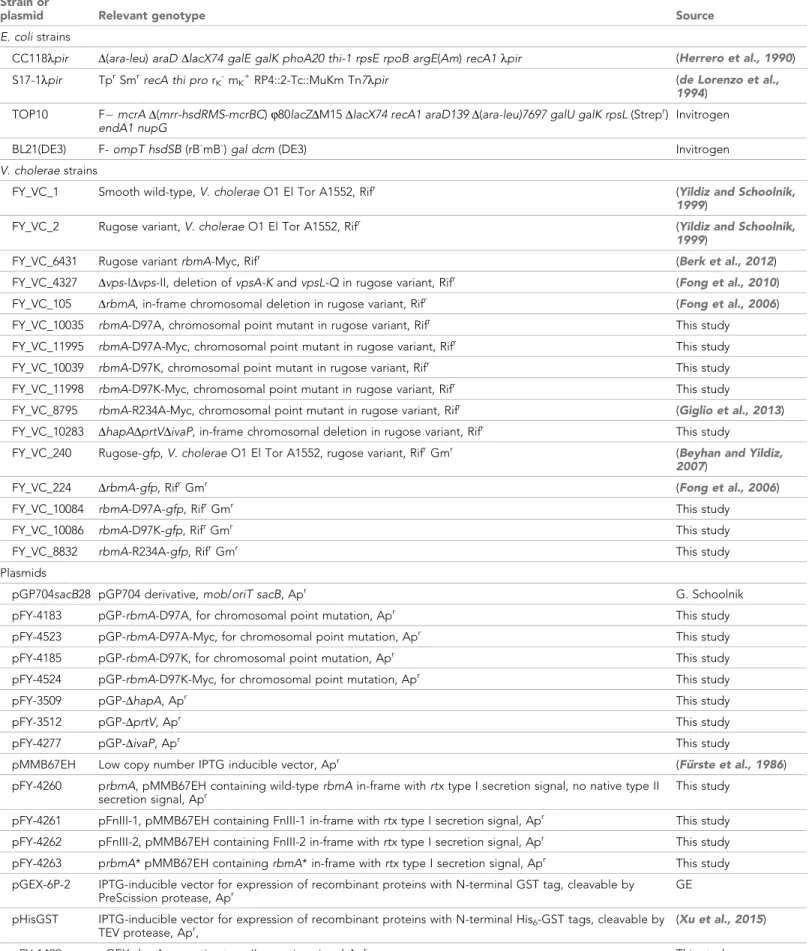
Table 2.Bacterial strains and plasmids used in this study.
Strain or
plasmid Relevant genotype Source
E. colistrains
CC118lpir D(ara-leu)araDDlacX74 galE galK phoA20 thi-1 rpsE rpoB argE(Am)recA1lpir (Herrero et al., 1990)
S17-1lpir TprSmrrecA thi prorK-mK+RP4::2-Tc::MuKm Tn7lpir (de Lorenzo et al., 1994)
TOP10 F mcrAD(mrr-hsdRMS-mcrBC)j80lacZDM15DlacX74 recA1 araD139D(ara-leu)7697 galU galK rpsL(Strepr) endA1 nupG
Invitrogen
BL21(DE3) F-ompT hsdSB(rB-mB-)gal dcm(DE3) Invitrogen
V. choleraestrains
FY_VC_1 Smooth wild-type,V. choleraeO1 El Tor A1552, Rifr (Yildiz and Schoolnik,
1999)
FY_VC_2 Rugose variant,V. choleraeO1 El Tor A1552, Rifr (Yildiz and Schoolnik,
1999)
FY_VC_6431 Rugose variantrbmA-Myc, Rifr (Berk et al., 2012)
FY_VC_4327 Dvps-IDvps-II, deletion ofvpsA-KandvpsL-Qin rugose variant, Rifr (Fong et al., 2010)
FY_VC_105 DrbmA, in-frame chromosomal deletion in rugose variant, Rifr (Fong et al., 2006)
FY_VC_10035 rbmA-D97A, chromosomal point mutant in rugose variant, Rifr This study
FY_VC_11995 rbmA-D97A-Myc, chromosomal point mutant in rugose variant, Rifr This study
FY_VC_10039 rbmA-D97K, chromosomal point mutant in rugose variant, Rifr This study
FY_VC_11998 rbmA-D97K-Myc, chromosomal point mutant in rugose variant, Rifr This study
FY_VC_8795 rbmA-R234A-Myc, chromosomal point mutant in rugose variant, Rifr (Giglio et al., 2013)
FY_VC_10283 DhapADprtVDivaP, in-frame chromosomal deletion in rugose variant, Rifr This study
FY_VC_240 Rugose-gfp,V. choleraeO1 El Tor A1552, rugose variant, RifrGmr (Beyhan and Yildiz, 2007)
FY_VC_224 DrbmA-gfp, RifrGmr (Fong et al., 2006)
FY_VC_10084 rbmA-D97A-gfp, RifrGmr This study
FY_VC_10086 rbmA-D97K-gfp, RifrGmr This study
FY_VC_8832 rbmA-R234A-gfp, RifrGmr This study
Plasmids
pGP704sacB28 pGP704 derivative,mob/oriT sacB, Apr G. Schoolnik
pFY-4183 pGP-rbmA-D97A, for chromosomal point mutation, Apr This study
pFY-4523 pGP-rbmA-D97A-Myc, for chromosomal point mutation, Apr This study
pFY-4185 pGP-rbmA-D97K, for chromosomal point mutation, Apr This study
pFY-4524 pGP-rbmA-D97K-Myc, for chromosomal point mutation, Apr This study
pFY-3509 pGP-DhapA, Apr This study
pFY-3512 pGP-DprtV, Apr This study
pFY-4277 pGP-DivaP, Apr This study
pMMB67EH Low copy number IPTG inducible vector, Apr (Fu¨rste et al., 1986)
pFY-4260 prbmA, pMMB67EH containing wild-typerbmAin-frame withrtxtype I secretion signal, no native type II
secretion signal, Apr This study
pFY-4261 pFnIII-1, pMMB67EH containing FnIII-1 in-frame withrtxtype I secretion signal, Apr This study
pFY-4262 pFnIII-2, pMMB67EH containing FnIII-2 in-frame withrtxtype I secretion signal, Apr This study
pFY-4263 prbmA* pMMB67EH containingrbmA* in-frame withrtxtype I secretion signal, Apr This study
pGEX-6P-2 IPTG-inducible vector for expression of recombinant proteins with N-terminal GST tag, cleavable by
PreScission protease, Apr GE
pHisGST IPTG-inducible vector for expression of recombinant proteins with N-terminal His6-GST tags, cleavable by
TEV protease, Apr, (Xu et al., 2015)
pFY-1429 pGEX-rbmA, no native type II secretion signal Apr This study
VPS and protein purification
Purification of VPS fromV. choleraerugose strain was carried out using a previously published proto-col (Yildiz et al., 2014). For protein purification, recombinant E. coli BL21 (DE3) cells carrying expression plasmids were grown at 37
˚
C in M9 minimal medium (6 g/L Na2HPO4, 3 g/L KH2PO4, 0.5 g/L NaCl, 0.1 mM CaCl2, 1 mM MgSO4, 3 g/L glucose, 1 g/L15NH4Cl) supplemented with MEM vita-min solution (Sigma, St. Louis, MO) until optical density at 600 nm (OD600) reached 0.6 to 0.8. Induc-tion was carry out by adding IPTG to a final concentraInduc-tion of 0.5 mM and the cultures were grown overnight (16 to 18 hr) at 18˚
C. To produce uniformly labeled 13C,15N FnIII-2 domain for chemical shift assignments, 3 g/L of13C-glucose was used in place of glucose in the M9 medium. Cells were harvested by centrifugation and lysed in buffer containing 50 mM Tris (pH 8.0), 1 M NaCl, 0.5% (v/v) Tween-20 and Complete Protease Inhibitor (Roche, Indianapolis, IN) via sonication. Proteins were purified with Fast Protein Liquid Chromatography (FPLC) using a GSTPrep FF 16/10 column contain-ing glutathione sepharose (GE Healthcare Bio-Sciences, Marlborough, MA) and a BioLogic DuoFlow FPLC system (Bio-Rad, Hercules, CA). The column was first washed with buffer containing 50 mM Tris (pH 8.0), 0.25 M NaCl, 0.05% (v/v) Tween-20 and 0.5 mM DTT, followed by another wash with buffer containing 50 mM Tris (pH 8.0), 0.25 M NaCl, and 0.5 mM DTT. Elution was carried out with buffer containing 50 mM Tris (pH 8.0), 0.25 M NaCl, and 3 g/L glutathione. Buffer exchange was car-ried out with the eluted protein and the digestion buffer using Amicon Ultra-15 centrifugal filter units (Millipore) and subsequent proteolysis of the protein tag was carried out overnight at 4˚
C with either PreScission protease (for recombinant proteins expressed from pGEX-6P-2) or tobacco etch virus (TEV) protease (for recombinant proteins expressed from pHisGST). The digestion buffer for PreSci-ssion protease contains 50 mM Tris (pH 7.5) and 0.15 M NaCl, while the digestion buffer for TEV protease contains 50 mM Tris (pH 8.0), 0.5 mM EDTA (pH 8.0) and 1 mM DTT. After proteolysis, cleaved tag and the protease were remove by another round of FPLC using either the GSTPrep FF 16/10 column (for recombinant proteins expressed from pGEX-6P-2) or HisPrep FF 16/10 containing nickel sepharose (for recombinant proteins expressed from pHisGST). Untagged protein was concen-trated using Amicon Ultra-15 centrifugal filter units and further purified using size-exclusion chroma-tography on Superdex 75 16/600 (GE Healthcare Bio-Sciences, Marlborough, MA) in NMR buffer (10 mM HEPES, pH 7.0, and 100 mM NaCl).Analysis of biofilm formation
Colony biofilm analysis were carried out as described previously (Fong et al., 2010). Images of colo-nies were acquired after 2–5 days of growth at 25
˚
C using a Zeiss Stemi 2000-C microscope equipped with Zeiss AxioCam ERc 5 s Microscope Camera. When needed ampicillin (100mg/mL) and IPTG (100mM) were added. Experiments were repeated with 2 biological replicates.Strain or
plasmid Relevant genotype Source
pFY-4194 pHisGST-noSP-rbmA-D97A, no native type II secretion signal, Apr This study
pFY-4196 pHisGST-noSP-rbmA-D97K, no native type II secretion signal, Apr This study
pFY-3491 pGEX-noSP-rbmA-R234A, no native type II secretion signal, Apr This study
pFY-4219 pHisGST-noSP-rbmA* no native type II secretion signal, Apr This study
pFY-3551 pHisGST-FnIII-1, Apr This study
pFY-3066 pHisGST-FnIII-2, Apr This study
pFY-3435 pHisGST-FnIII-2-R234A, Apr This study
pUX-BF13 oriR6K helper plasmid,mob/oriT, provides Tn7transposition function in trans, Apr (Bao et al., 1991)
pMCM11 pGP704::mTn7-gfp, GmrApr M. Miller and G.
Schoolnik
pNUT542 Ptac_sfgfpexpression plasmid, Gmr This study
pNUT1029 Ptac_mRubyexpression plasmid, Gmr This study
For time-lapse and thin section microscopy studies, two LB agar layers (pH 7.5; with 20mg/mL Congo red) were poured to depths of 4.5 mm (bottom) and 1.5 mm (top). Overnight cultures were diluted 1:200 in fresh LB, then 3 mL were spotted onto the top agar layer and the bacteria were allowed to grow for 2 to 5 days (dark; 25
˚
C; >95% humidity). For thin sectioning, the bacterial colo-nies were imaged using a Keyence VHX 1000 digital microscope before they were covered by an additional 1.5 mm agar layer. Colonies sandwiched between two 1.5 mm agar layers were lifted from the bottom layer and soaked for 4 hr in 50 mM L-lysine in phosphate buffered saline (PBS) (pH 7.4) at 4˚
C, then fixed in 4% paraformaldehyde, 50 mM L-lysine, PBS (pH 7.4) for 4 hr at 4˚
C, then overnight at 37˚
C. Fixed samples were washed twice in PBS and dehydrated through a series of eth-anol washes (25%, 50%, 70%, 95%, 3100%) for 60 min each. Samples were cleared via three 60min incubations in Histoclear-II (National Diagnostics), and then infiltrated for 4 hr at 55
˚
C with 100% paraffin wax (Paraplast Xtra), which polymerized overnight at 4˚
C. Trimmed blocks were sectioned (10mm-thick sections perpendicular to the plane of the bacterial colony spots), floated onto water at 45˚
C, and collected onto slides. Slides were air-dried overnight, heat-fixed on a hotplate for 1 hr at 52˚
C, and rehydrated in the reverse order of processing. Rehydrated samples were immediately mounted in TRIS-buffered DAPI:Fluorogel (Electron Microscopy Sciences). Time-lapse and thin sec-tion microscopy studies were carried out with three biological replicates.For flow-cell biofilm studies, Ibidim-Slide VI0.4 (Ibidi 80601, Ibidi LLC, Verona, WI) flow-cell cham-bers were inoculated with 100 mL of overnight-grown cultures, normalized to an OD600 of 0.02. Flow-cell chambers were incubated at room temperature for 1 hr, then flow of diluted LB (0.2 g/L tryptone, 0.1 g/L yeast extract, 10 g/L NaCl, pH 7.5) was initiated at a rate of 20 mL/h and continued for up to 24 hr. Confocal images were obtained on a Zeiss LSM 5 Pascal laser scanning confocal microscope (Zeiss, Dublin, CA). Images were obtained with a 40 dry objective and were processed using Imaris software (Biplane, South Windsor, CT). Confocal laser scanning microscopy (CLSM) were carried out with at least two biological replicates. Colony forming units (CFU) from the effluent of flow-cells in the CLSM experiments were quantified by dilution plating and were repeated with two biological replicates.
For single-cell resolution microscopy of biofilms, GFP-expression plasmid pNUT542 was intro-duced into the relevant strains, which conferred a gentamycin resistance. The strains were grown in M9 minimal medium, supplemented with 0.5% (w/v) glucose and 30 mg/mL gentamycin, to mid-exponential growth phase, before introducing into microfluidic channels, which consisted of a trench in a polydimethylsiloxane block that was O2-plasma-bonded to a glass coverslip. The resulting flow chambers had a width of 500mm, height of 100 mm, and length of 7 mm. After the cultures were introduced into the channels, the channels were incubated at 24
˚
C for 1 hr without any flow, to allow cells to attach to the bottom glass surface of the channels. The flow was then set to 1mL/min, corre-sponding to an average flow speed of 330mm/s in the channel, for the remainder of the experiment. While the medium was flown through the channel, the biofilm architecture of the different strains was imaged every 30–60 min for approximately 20 hr. Images were acquired with an Olympus 100x objective with numerical aperture of 1.35, using a Yokogawa spinning disk confocal scanner and laser excitation at 488 nm. Images were acquired at spatial resolution of 63 nm in thexyplane and 400 nm along thezdirection.nearest neighbor were calculated for each cell based on cell-centroid coordinates. Single-cell resolu-tion microscopy was performed on biofilm colonies with three biological replicates per strain.
For localization of RbmA and VPS during biofilm growth, cells expressed the red fluorescent pro-tein mRuby from the plasmid pNUT1029, driven by a constitutively active Ptacpromoter. For RbmA localization, biofilms were grown in M9 medium containing 1mg/mL of c-Myc tag monoclonal anti-body (9E10) conjugated to Alexa Flour 488 (Thermo Scientific) and 1 mg/mL of filter-sterilized bovine serum albumin (BSA). For VPS localization, biofilms were grown in M9 medium containing 20
mg/mL wheat-germ agglutinin (WGA) conjugated to FITC and 20mg/mL Concanavalin A conjugated to FITC (Sigma), and 1 mg/mL of filter-sterilized BSA.
Nuclear magnetic resonance (NMR) spectroscopy
All NMR experiments were conducted at 35
˚
C on either a Varian 600 MHz spectrometer equipped with a 5 mm1H,13C,15N cryoprobe or a Bruker 900 MHz spectrometer equipped with a 5 mm CP TCI (1H, 13C, 15N, 2H) cryoprobe. All NMR data were processed using NMRPipe/NMRDraw (Delaglio et al., 1995). Chemical shift assignments were made with NMRViewJ RunAbout (John-son, 2004) using data obtained from the following 3D triple resonance experiments acquired on 300mM13C/15N labeled FnIII-2 domain: HNCO, HNCACB, CBCA(CO)NH, and C(CO)NH-TOCSY spectra. 93% of the total non-proline residues were assigned, including 99% of the non-proline residues origi-nating from the FnIII-2 domain itself. Chemical shifts are available at the BMRB database (BMRB 27130). Chemical shift assignments were validated by comparing secondary structure predictions from TALOS+ (Shen et al., 2009) to existing crystal structures (Giglio et al., 2013). Chemical shift assignments for 15N R234A FnIII-2 domain were made by re-assignment from WT FnIII-2 domain using the Minimal Chemical Shift Analysis function in NMRViewJ. Purified, lyophilized VPS (Yildiz et al., 2014) was resuspended to 50 mg/mL in NMR buffer (10 mM HEPES, pH 7.0, and 100 mM NaCl) with 3–5 short pulses of a benchtop vortexer to promote solubilization. VPS titration experiments were performed by collecting1H-15N HSQC spectra at 35
˚
C on either a 600 MHz with 100mM15N FnIII-2 domain (WT or R234A) or1H-15N TROSY-HSQC or 1D1H spectra at 900 MHz on 100mM15N full-length RbmA proteins (WT, R234A, D97A, and RbmA*) in the presence of increasing concentrations of VPS. Samples were brought up to 300mL with NMR buffer and adjusted with D2O to a final concentration of 10% (v/v). All HSQC titration data were visualized and analyzed with NMRViewJ. Chemical shift perturbations defined by the equationDdTOT= [(Dd1H)2+ (c(Dd15N)2]½ and normalized with the scaling factorc = 0.5 (Johnson, 2004). TROSY-HSQC spectra were proc-essed with 48 Hz shifts in both15N and1H dimensions to align HSQC and TROSY-HSQC spectra. 1D 1H NMR data were processed and analyzed with MestReNova. A decrease in peak intensity (i.e. broadening) can arise from several different phenomena, including formation of high molecular weight species with poor relaxation properties or chemical exchange between two or more species on an intermediate timescale; these properties and considerations for the interpretation of NMR data are explained in more detail in the reviews on NMR spectroscopy (Kleckner and Foster, 2011; Kwan et al., 2011).
SEC-MALS
All experiments were performed on a Superdex S75 10/300 GL column (GE Healthcare) with a sam-ple injection volume of 250mL and a flow rate of 0.5 mL/min at 4
˚
C. The volume of the sample loop was 100mL. Molecular weight markers used to calibrate the column were: albumin (67 kDa), ovalbu-min (43 kDa), chymotrypsinogen A (25 kDa), and ribonuclease A (13.7 kDa) from the Low Molecular Weight Gel-filtration Calibration kit (GE Healthcare). Absolute molecular weight calculations were obtained by static light scattering in line with size exclusion chromatography using the Wyatt Optilab T-rEX refractometer and miniDAWN Treos multiangle light scattering system at 4˚
C. Protein concen-trations were monitored by the refractometer and light scattering unit directly after the gel filtration column. Absolute molecular weights were determined using ASTRA version 6.0 (Wyatt Technologies).Limited proteolysis and mass spectrometry
mass (w/w) ratios. Reactions were quenched with addition of an equal volume of 2X SDS Laemmli buffer (Bio-Rad) and samples were boiled at 95
˚
C for 5 min. Digested fragments were resolved by 18% SDS-PAGE and detected by Coomassie stain. For mass determination, proteolysis reactions were quenched in parallel by addition of formic acid to a final concentration of 1% (v/v). Samples were desalted and separated by HPLC (Surveyor; Thermo Finnegan) on a Proto 300 C4 reverse-phase column with a 100 mm x 2.1 mm inner diameter and 5mm particle size (Higgins Analytical, Inc.) using a mobile phase consisting of solvent A (0.1% formic acid in HPLC grade water) and sol-vent B (0.1% formic acid in acetonitrile). Samples were then analyzed on an LTQ Orbitrap linear ion mass spectrometer system (Thermo Finnegan). Proteins were detected by full-scan MS mode (over an m/z of 300–2000) in positive mode with the electrospray voltage set to 5 kV. Mass measurements of deconvoluted electrospray ionization mass spectra of the reversed-phase peaks were generated by Magtran software.Western blot analysis
Total proteins (10mg) extracted from whole-cell (WC) or precipitated from culture supernatant (CS) were separated on 10% SDS-PAGE and transferred to PVDF for Western blot analysis, following pre-viously described protocol (Giglio et al., 2013). For planktonic cells, overnight cultures were diluted 1:200 and grown at 30
˚
C in LB medium with shaking at 200 rpm for the indicated amount of time. Culture supernatant was separated from the cells by centrifugation at 5000 xg. Whole-cell samples were prepared by resuspending the cell pellets in 2% (w/v) SDS. The culture supernatant fractions were collected and filtered through 0.22mm filters to remove any residual cells. Bovine serum albu-min (BSA) (700mg) was added to 20 mL of each culture supernatant fractions as an additional load-ing control. Total protein in the culture supernatant was precipitated with 13% (v/v) trichloroacetic acid (TCA) at 4˚
C overnight, followed by centrifugation at 45,000 x gfor 1 hr. The protein pellets from the culture supernatant were washed with 2 mL ice-cold acetone and resuspended in 1x PBS. For biofilm cells, overnight cultures were diluted to OD600 of 0.02 with diluted LB medium, inocu-lated into Ibidim-Slide and grown as described for CLSM experiments. Biofilms cells were pelleted via centrifugation after harvesting from the chambers, resuspended in 2% (w/v) SDS and 5mg of total proteins were separated on 12% SDS-PAGE and transferred to PVDF for Western blot analysis. Pro-tein concentrations were estimated using a Pierce BCA proPro-tein assay kit (Thermo Fisher Scientific, Waltham, MA) and BSA as standard. Polyclonal rabbit anti-RbmA serum, generated against purified RbmA protein (Berk et al., 2012), was used at a dilution of 1:1500 to detect RbmA. Additional load-ing controls where appropriate were used, BSA in the culture supernatant samples and RNA poly-merase in the whole-cell samples were detected using 1:500-diluted polyclonal rabbit anti-BSA antibody (Thermo Fisher Scientific) and 1:2000-diluted monoclonal mouse anti-RNAP (BioLegend Neoclone, San Diego, CA), respectively. Anti-RNAP was also used to verify that the culture superna-tant samples were not contaminated with whole-cell proteins. For samples harvested from colony biofilms, rabbit OmpU polyclonal antiserum was used as a loading control. Secondary goat anti-rabbit and anti-mouse IgG conjugated to horseradish peroxidase (Santa Cruz Biotechnology, Paso Robles, CA) was used at a dilution of 1:2500. The SuperSignal West Pico chemiluminescent substrate (Thermo Fisher Scientific) and a Bio-Rad ChemiDoc MP imaging system were used for detection and capturing of the Western blot signals. Western blot analysis was carried out with two biological replicatesQuantitative and statistical analyses
Biomass, average and maximum biofilm thicknesses were calculated from at least five biofilm images using COMSTAT software package (Heydorn et al., 2000). Statistical significance was determined using Student’sttest (two-tailed, unpaired).
Acknowledgements
the 900 MHz QB3 NMR spectrometer was funded by NIH grant GM68933. We thank Kassidy Hebert for help with RbmA purification and RbmA quantification experiments. This work was supported by NIH grants R01 AI103369 (L.E.P.D), R01 GM107069 (C.L.P.) and R01 AI055987 (F.H.Y.), as well as Human Frontier Science Program grant CDA00084/2015 C and the Max Planck Society (K.D.). A.K. M. was supported by NIH fellowship F31 CA189660.
Additional information
Funding
Funder Grant reference number Author National Institute of Allergy
and Infectious Diseases
RO1AI055987 Fitnat H Yildiz
National Institute of General Medical Sciences
GM107069 Carrie L Partch
Human Frontier Science Pro-gram
CDA00084/2015-C Knut Drescher
National Institute of General Medical Sciences
CA189660 Alicia K Michael
National Institute of Allergy and Infectious Diseases
R01 AI103369 Lars EP Dietrich
The funders had no role in study design, data collection and interpretation, or the decision to submit the work for publication.
Author contributions
Jiunn CN Fong, Conceptualization, Resources, Supervision, Validation, Investigation, Visualization, Methodology, Writing—original draft, Project administration, Writing—review and editing; Andrew Rogers, Conceptualization, Validation, Investigation, Visualization, Methodology, Writing—original draft; Alicia K Michael, Nicole C Parsley, William-Cole Cornell, Yu-Cheng Lin, Praveen K Singh, Inves-tigation, Methodology; Raimo Hartmann, Software, InvesInves-tigation, Methodology; Knut Drescher, Software, Formal analysis, Supervision, Funding acquisition, Investigation, Methodology, Writing— original draft, Project administration, Writing—review and editing; Evgeny Vinogradov, Resources; Lars EP Dietrich, Resources, Formal analysis, Supervision, Funding acquisition, Methodology, Project administration; Carrie L Partch, Conceptualization, Formal analysis, Supervision, Funding acquisition, Validation, Investigation, Visualization, Methodology, Writing—original draft, Project administration; Fitnat H Yildiz, Conceptualization, Resources, Formal analysis, Supervision, Funding acquisition, Vali-dation, Investigation, Visualization, Methodology, Writing—original draft, Project administration, Writing—review and editing
Author ORCIDs
Jiunn CN Fong, http://orcid.org/0000-0003-3933-7885 William-Cole Cornell, http://orcid.org/0000-0002-8927-1813 Praveen K Singh, http://orcid.org/0000-0002-0254-7400 Raimo Hartmann, http://orcid.org/0000-0002-4924-6402 Lars EP Dietrich, http://orcid.org/0000-0003-2049-1137 Carrie L Partch, http://orcid.org/0000-0002-4677-2861 Fitnat H Yildiz, http://orcid.org/0000-0002-6384-7167
Decision letter and Author response
Additional files
Supplementary files.Supplementary file 1. List of primers used in this study for generating various strains and plasmids. DOI: https://doi.org/10.7554/eLife.26163.023
.Transparent reporting form
DOI: https://doi.org/10.7554/eLife.26163.024
References
Absalon C, Van Dellen K, Watnick PI. 2011. A communal bacterial adhesin anchors biofilm and bystander cells to surfaces.PLoS Pathogens7:e1002210.DOI: https://doi.org/10.1371/journal.ppat.1002210,PMID: 21901100
Bao Y, Lies DP, Fu H, Roberts GP. 1991. An improved Tn7-based system for the single-copy insertion of cloned genes into chromosomes of gram-negative bacteria.Gene109:167–168.DOI: https://doi.org/10.1016/0378-1119(91)90604-A,PMID: 1661697
Berk V, Fong JC, Dempsey GT, Develioglu ON, Zhuang X, Liphardt J, Yildiz FH, Chu S. 2012. Molecular architecture and assembly principles ofVibrio choleraebiofilms.Science337:236–239.DOI: https://doi.org/10. 1126/science.1222981,PMID: 22798614
Beyhan S, Yildiz FH. 2007. Smooth to rugose phase variation in Vibrio cholerae can be mediated by a single nucleotide change that targets c-di-GMP signalling pathway.Molecular Microbiology63:995–1007. DOI: https://doi.org/10.1111/j.1365-2958.2006.05568.x,PMID: 17233827
Borlee BR, Goldman AD, Murakami K, Samudrala R, Wozniak DJ, Parsek MR. 2010. Pseudomonas aeruginosa uses a cyclic-di-GMP-regulated adhesin to reinforce the biofilm extracellular matrix.Molecular Microbiology75: 827–842.DOI: https://doi.org/10.1111/j.1365-2958.2009.06991.x,PMID: 20088866
Branda SS, Chu F, Kearns DB, Losick R, Kolter R. 2006. A major protein component of the Bacillus subtilis biofilm matrix.Molecular Microbiology59:1229–1238.DOI: https://doi.org/10.1111/j.1365-2958.2005.05020.x, PMID: 16430696
de Lorenzo V, Timmis KN. 1994. Analysis and construction of stable phenotypes in gram-negative bacteria with Tn5- and Tn10-derived minitransposons.Methods in enzymology235:386–405.DOI: https://doi.org/10.1016/ 0076-6879(94)35157-0,PMID: 8057911
Delaglio F, Grzesiek S, Vuister GW, Zhu G, Pfeifer J, Bax A. 1995. NMRPipe: a multidimensional spectral processing system based on UNIX pipes.Journal of Biomolecular NMR6:277–293.DOI: https://doi.org/10. 1007/BF00197809,PMID: 8520220
Drescher K, Dunkel J, Nadell CD, van Teeffelen S, Grnja I, Wingreen NS, Stone HA, Bassler BL. 2016. Architectural transitions inVibrio choleraebiofilms at single-cell resolution.PNAS113:E2066–E2072. DOI: https://doi.org/10.1073/pnas.1601702113,PMID: 26933214
Faruque SM, Biswas K, Udden SM, Ahmad QS, Sack DA, Nair GB, Mekalanos JJ. 2006. Transmissibility of cholera: in vivo-formed biofilms and their relationship to infectivity and persistence in the environment.PNAS 103:6350–6355.DOI: https://doi.org/10.1073/pnas.0601277103,PMID: 16601099
Flemming HC, Wingender J. 2010. The biofilm matrix.Nature Reviews Microbiology8:623–633.DOI: https://doi. org/10.1038/nrmicro2415,PMID: 20676145
Fong JC, Karplus K, Schoolnik GK, Yildiz FH. 2006. Identification and characterization of RbmA, a novel protein required for the development of rugose colony morphology and biofilm structure inVibrio cholerae.Journal of Bacteriology188:1049–1059.DOI: https://doi.org/10.1128/JB.188.3.1049-1059.2006,PMID: 16428409
Fong JC, Syed KA, Klose KE, Yildiz FH. 2010. Role of Vibrio polysaccharide (vps) genes in VPS production, biofilm formation and Vibrio cholerae pathogenesis.Microbiology156:2757–2769.DOI: https://doi.org/10. 1099/mic.0.040196-0,PMID: 20466768
Fong JC, Yildiz FH. 2007. The rbmBCDEF gene cluster modulates development of rugose colony morphology and biofilm formation in Vibrio cholerae.Journal of Bacteriology189:2319–2330.DOI: https://doi.org/10.1128/ JB.01569-06,PMID: 17220218
Fu¨rste JP, Pansegrau W, Frank R, Blo¨cker H, Scholz P, Bagdasarian M, Lanka E. 1986. Molecular cloning of the plasmid RP4 primase region in a multi-host-range tacP expression vector.Gene48:119–131.DOI: https://doi. org/10.1016/0378-1119(86)90358-6,PMID: 3549457
Giglio KM, Fong JC, Yildiz FH, Sondermann H. 2013. Structural basis for biofilm formation via theVibrio cholerae matrix protein RbmA.Journal of Bacteriology195:3277–3286.DOI: https://doi.org/10.1128/JB.00374-13, PMID: 23687270
Hartmann R. 2017.AnalyzeSingleCells.GitHub.https://github.com/raimoh/single-cell-analysis
Hatzios SK, Abel S, Martell J, Hubbard T, Sasabe J, Munera D, Clark L, Bachovchin DA, Qadri F, Ryan ET, Davis BM, Weerapana E, Waldor MK. 2016. Chemoproteomic profiling of host and pathogen enzymes active in cholera.Nature Chemical Biology12:268–274.DOI: https://doi.org/10.1038/nchembio.2025,PMID: 26900865