1
The Relationship Between Perceived Stress and
Depressive Symptoms Among Dutch University
Students
Moderated by Personality traits
?Sanne de Heer – 1260537 Supervisor: dr. L.A.W. Jans
Universiteit Leiden, Institute of Psychology Clinical Psychology
2
Table of Contents
Abstract ... 3
1. Introduction ... 4
2. Methods ... 10
2.1 Design and participants ... 10
2.2 Measures ... 11
2.2.1 Perceived stress ... 11
2.2.2 Student Perceived Stress ... 11
2.2.3 Personality traits ... 12
2.2.4 Symptoms of depression ... 12
2.3 Procedure ... 12
2.4 Statistical Analysis ... 13
3.1 Demographics ... 13
3.2 Factor Analysis ... 14
3.3 Student stress and depression ... 18
3.4 Moderation analysis ... 19
4. Discussion ... 24
4.1 Conclusion and implications ... 28
3 Abstract
Background. Perceived stress among students can be caused by different sources, such as
4
1. Introduction
According to the Central Bureau of Statistics in the Netherlands, this year, 261.176 students attended university in the Netherlands, spread over nineteen different universities. Every year, this number grows. Between 2000 and 2010, the student population has grown with 46% (VSNU, 2012). Over the last years, the rules and requirements regarding studying are becoming stricter. For example, students are receiving a smaller scholarship. The
governmental contribution per student has decreased with almost 5000 euro within ten years, from 19 thousand to 15 thousand, between 2000 and 2010 (VSNU, 2012). Thereby, since 2014, the scholarship is abolished for all Dutch students. Research found that higher student loans are associated with worse mental health (Walsemann, Gee and Gentile, 2015). This is alarming, given that it is expected that student loans in the Netherlands will increase even further in the future, because of the abolishment of the scholarships (OCW Studentenmonitor, 2015). Besides finances, the binding study advice (BSA) also puts extra pressure on students as well. Since three years, Dutch universities require from their students a certain amount of credits in order to be able to continue their study. This is an extra burden for students. About 40% of the students experience the study pressure to be high to very high, 50% experienced this pressure as normal, and 10% experienced the study pressure as being (too) low (OCW Studentenmonitor, 2015). This pressure comes from pressure to perform, meaning that students experience high expectations by themselves or others (ISO, 2015). This pressure can result in experiencing study stress, with symptoms as performance anxiety, worsened sleep patterns, deferral behavior or ruminating (Opinie UT, 2012). It is not surprising that students experience stress, when taking into account the binding study advice, the decreasing funding and the pressure to perform well.
5 used different themes, dividing stressors in the categories relationships, lack of resources, expectations, academics, environment, diversity, and transition (Hurst, Baranik & Daniel, 2013). Bergin and Pakenham (2014) brought it back to only four categories: academic demands, career pressure, social isolation, and study/life imbalance. Since all studies used a variety of categories, the results are difficult to compare.
Several studies attempted to examine the role of these stressors for students. Some studies found that academic-related stressors are most influential for students, meaning that this stressor was mentioned most as an extreme or moderate source of concern among the sample (Beiter et al., 2015). This stressor includes meeting grade requirements, taking tests, the amount of material to be studied and time-management. The second most important stressor in the study of Beiter and colleagues (2015) was pressure to succeed, followed by post-graduation plans and finances. This top four is directly related to college life. According to this study, that shows that for students, stressors linked to studying have a bigger impact on their stress levels than stressors related to relationships or health for example. This finding is underlined by different other studies. It was found that preparing for exams, having too much work, the desire to do well, and essays and projects are mentioned most as sources of stress (Abouserie, 1994). Another study also mentioned exams, classes, coursework and tests as important sources to elicit stress among students (Dusselier et al., 2010). According to Bergin and Pakenham (2014), who examined the sources of stress among law students, academic stress elicits the highest levels of stress as well. This type of stress includes the amount and difficulty of the material to be learned and having enough time to catch up with it. The above-mentioned studies seem to point out that academic-related factors, such as time-management, taking tests, having much work to do and difficult study material can be a major source of stress.
In contrast to those studies, some studies found interpersonal stressors instead of academic stressors to be most responsible for stress in students (Ross, Niebling and Heckert, 1999). Those stressors include changes in social activities or conflicts with roommates, parents or boyfriend/girlfriend. Second and third were intrapersonal stressors (changes in sleeping patterns and eating habits, gaining more responsibility, financial problems, etc.) and academic stressors (increased workload, future perspectives and graduation anticipation). In a
6 Students indicated that they were stressed about missing loved ones, worrying about their health, managing difficult relationships or feeling pressure from their family to succeed. This finding is more in line with the previous study (Ross, Niebling and Heckert, 1999). The second most important source of stress was found to be ‘lack of resources’, including lack of time, money, support, skills, technology and sleep. Students indicated having trouble with time-management, or work-life balance. Expectations about self or others was mentioned thirdly, since trying to meet those expectations could result in stress. Perfectionism was sometimes mentioned in this context. This stressor was followed by academics, specifically including general academics (coursework, or not further specified), exams, classes and studying. Environment, other (career, health), diversity and transitions (a new way of living, Levens, Elrahal, & Sagui, 2016) were also mentioned in this article.
Based on the literature, it is not easy to state which stressors are most common among students. Different types of stress were measured in different studies, and in addition, most studies used a study sample with medical, nursing or physical students. More important is to note that a lot of different types of stressors are present in students, which could have
numerous negative consequences for students. For example, it is found that being stressed is associated with a lower Grade Point Average (Leppink et al., 2016; Struthers, Perry and Menec, 2000). Furthermore, perceived stress was related to poorer physical health (Leppink et al., 2016). This includes sickness, but also lesser activity and exercising. Students
experiencing higher levels of stress were more involved in unhealthy behaviors, which means that they eat more junk-food, drink more soda, eat less fruit and vegetables (Hudd et al., 2000). Students reporting higher levels of perceived stress also reported poorer physical activity and health. Some studies also found that stressed students are more frequent alcohol users (Dusselier et al., 2010).
7 based on self-report measures in 24 studies examining depression among university students in different countries (Ibrahim et al., 2012). There has not been much research in comparing students with their peers on this subject. Some studies conclude that students are at higher risk of depression than age-matched non-students (Royal College of Psychiatrists London, 2011), whereas other studies found no differences between those two groups (Blanco et al., 2008).
Positive associations has been found between perceived stress and levels of depression (Leppink et al., 2016; Saleh, Camart, & Romo, 2017). Reasonably, students differ in to what extent they are prone to develop depressive symptoms. For example, there seems to be an increase in depressive symptoms along study years (Siminc-Vukomanovic et al., 2016) and depression scores were almost twice at high at the end of a three-year study (Bewick et al., 2014). This could mean that students studying longer are at higher risk for depression (Simic-Vukomanovic et al., 2016). In addition, students with financial struggles reported more depressive symptoms (Eisenberg et al., 2007). Furthermore, demographic factors say
something about the susceptibility for depression. Being a woman, having a younger age or a worse social-economic position, but also cognitive factors, such as little self-esteem or negative attributional styles could contribute to vulnerability (Hammen, 2007).
Developing depressive symptoms seems to be dependent of one’s vulnerability. Dealing with stress ineffectively, seems to be a strong predictor of depression in students (Felsten, 2004). This finding is underlined by different studies (Avison & McAlpine, 1992;
Mikolajczuk et al., 2008). This fits well with existing theories about stress and mental health. According to the vulnerability-stress model (or diathesis-stress model), a predisposition for a certain disorder exists within the individual, meaning that some individuals are more
vulnerable to that disorder than others. This vulnerability could lead to that disorder in
8 students experience more minor stressors than major stressors, so according to this theory, they could be more predisposed for psychopathology (Kanner et al., 1981).
Another factor making someone more vulnerable for depression is personality. Personality is most often described based on the Big Five Model (McCrae & Costa, 1987), which includes five domains: neuroticism, extraversion, agreeableness, conscientiousness and openness to experience. Neurotic individuals can be characterized as worrying, nervous, emotional unstable, insecure, impatient and vulnerable. High neurotic individuals tend to be less agreeable (McCrae & Costa, 1987). Those who score high on agreeableness, can be described as helpful, sympathetic, trusting, forgiving, open-minded and flexible. Extraverted people are often sociable, friendly, spontaneous, talkative and passionate. Conscientious people are careful, reliable, well organized, disciplined and punctual, and people who are open to experience are original, imaginative, curious, daring and independent. Every individual has its own, unique personality, so they could differ in to what extent they are vulnerable to depression. There has been some research to this subject. Neuroticism seems to be strongly related to mood disorders (Kendler et al., 2006). Neuroticism predicts first onset of depression, but also later depressive episodes. A prospective study found that neuroticism increased the risk of becoming depressed threefold (Boyce et al., 1991). The proposed mechanism for this relationship is mainly cognitive (Martin, 1984). Depressed individuals display similar habits, usually distorted, in cognitive processing with neurotic individuals. Depressed people could suffer from cognitive biases about themselves, the world and the future. They see themselves as unreliable, the world as overwhelming and the future as pointless (Hammen, 2007). Besides, negative information is recalled faster and more often than positive information. Same results were found for high neurotic individuals (Chan et al., 2007), where biases such as weakened positive processing were present. This finding
indicates why neurotic individuals are more prone to depression.
Low extraversion was positively correlated to depressive symptoms too (Kim et al., 2016). High extraversion is, in contrast to neuroticism, associated with positive emotions and amiability, which is known to reduce depressive feelings. Low levels of extraversion could mean low levels of positive affect, which is a characteristic aspect of depression (Spinhoven et al., 2014). Those studies confirm the idea that some people are more vulnerable to
9 Personality does not only have a relationship with depression, but with stress too. Neuroticism was found to correlate positively with perceived stress. Extraversion,
agreeableness and conscientiousness were negatively correlated. For openness to experiences, no significant results were found (Ebstrup et al., 2011; Saklofske et al., 2012). Various
explanations for these differences in handling stress were found. Less emotionally stable individuals, a term for describing neurotics, tended to feel overwhelmed by stress, and were less able to engage in health practices (Korotkov, 2008). Extraverted people are often engaged in problem-focused coping and less in emotion-focused coping, which is known to be less effective. Being high conscientious was found to be associated with an active coping style. Conscientious people see themselves as capable enough to meet stressful situations (Penley & Tomaka, 2002). Besides, they tend to be engaged in more health behaviors for example (Korotkov, 2008). For agreeableness, fewer results were found, but it is proposed that
agreeable people use problem solving coping styles, and seek social support when in stressful situations (Connor-Smith & Flachsbart, 2007).
Given that particular personality traits affect the way individuals evaluate stress, and may have an effect on depression too, personality is hypothesized to moderate the relationship between those two. This possible moderation has been examined before, and it was found that students with high levels of extraversion and conscientiousness, and low levels of
neuroticism, had a higher resistance to stress, which meant that those students were less prone to stress-related conditions, such as depression (Bunevicius, Katkute & Bunevicius, 2008). This study proposed that extraverted students are often exposed to higher levels of stress, but they seem to have effective coping mechanisms, so stress leads less often to depression. It appears that neuroticism is the only personality trait, which makes someone more vulnerable to depression.
To summarize, the relationship between perceived stress and depression exists among students, has become clear in several studies (Avison & McAlpine, 1992; Mikolajczuk et al., 2008). This stress can derive from a variety of sources, including academics, finances, interpersonal problems and transition to college life (Beiter et al., 2015; Ross, Niebling & Heckert 1999). High levels of neuroticism and low levels of extraversion and
10 hypothesis in this study was that students who experience more perceived student stress would show higher levels of depressive symptoms. Here it was expected that the stressors academic demands and career pressure have the highest association with depressive symptoms. The second aim was to examine the moderating role of personality within this relationship. It was hypothesized that particular personality traits will moderate the
relationship between student perceived stress and depressive symptoms. The expectation was that neuroticism strengthens the relationship between those two variables, whereas
agreeableness, extraversion and conscientiousness would be serving as protective factors and therefore diminish correlations between perceived stress and depressive symptoms. It is important to know which students are most vulnerable for developing a depression under stressful circumstances. Students who are at risk, can be offered help in earlier stages, when prevention is still possible. Examining the prevalence and causes of depressive symptoms in students, could give insight in the problems students have to deal with, and help universities to offer support programs or other forms of help. Lots of research in this area has been done with medical, nursing or dental students, but this study took into account a variety of studies, to give the best overview possible in the student population as a whole.
2. Methods
2.1 Design and participants
11 2.2 Measures
2.2.1 Perceived stress
Cohen’s Perceived Stress Scale, Dutch version
The Perceived Stress Scale (PSS; Cohen, 1983) examines the perception of stress, to what degree someone perceives his or her life as unpredictable, uncontrollable and overloaded (Cohen, 1983). This scale consists of 10 items and each questions had to be answered on a 5-points Likert scale, ranging from “0 = never”, to “4 = very often”. The questions regard feelings and cognitions during the last month, for example “In the last month, how often have you felt that you were unable to control the important things in your life?”. The English version of the PSS has a Chronbach’s alpha of about .85, in a college-student sample, but there is no validated measure of the Dutch version of the scale.
2.2.2 Student Perceived Stress
Law Student Perceived Stress Scale
The Law Student Perceived Stress Scale (LSPSS; Bergin & Pakenham, 2014) measures academic demands, career pressure, social isolation and study/life imbalance. This scale was translated into Dutch and adjusted to all kinds of students, since it was designed for law students only. The procedure started with two independent translators, translating the
questions to Dutch, where after they discussed this with a third, bilingual person. Ambiguity was removed, and the best translation was chosen. A fourth, independent translator translated the Dutch version back to English. At last, all involved checked whether the translation was sufficient, and the questionnaire was approved for the current sample. The questionnaire consists of 16 items. The instructions were as follows: ‘The next 16 items are possible sources of stress, related to studying at a university. For each item, please indicate how stressful you find the item, if at all’. No particular time frame was given. Participants answered on a 5-point Likert scale, ranging from “1 = not at all stressful”, to “5 = very stressful”. This is not a
12 2.2.3 Personality traits
Big Five Inventory, Dutch version (BFI)
The Big Five Inventory (BFI; Denissen et al., 2008) measures the Big Five factor structure of personality in individuals. In this study, we will use the Dutch version of the 44-item scale, which shows an internal consistency (measured by Cronbach’s alpha) of 0.73 to 0.86 (Denissen et al., 2008). For each domain of the five factor model, there are eight to ten
questions, each with a five points Likert scale “1 = strongly disagree”, to “5 = agree strongly”. For every question, the participants had to fill in, to what degree each statement applies to themselves. Examples of statements are ‘worries a lot’, ‘is talkative’, or ‘is a reliable worker’.
2.2.4 Symptoms of depression
Beck’s Depression Inventory II, Dutch version, Revised
The Beck’s Depression Inventory II (BDI-II-R; Roelofs et al., 2013) consists of 21 items, and it measures the severity of depressive symptoms. Each item consists of four propositions, from which respondents had to choose which one fits best. The instruction participant received, was “this questionnaire measures symptoms of depression” . The list exists of 21 sets with four statements each. Read every set carefully. Choose within each set the statement which describes best how you felt last week, including today’. For example, they needed to choose between “(0) I do not feel sad, (1) I feel sad, (2) I am sad all the time and I can’t snap out of it, or (3) I am so sad or unhappy that I can’t stand it”. The scale measures cognitive, affective, and somatic symptoms. The BDI indicates whether someone has a minimal (0-13), mild (14-19), moderate (20-28) or severe (29-63) depression. It is not a diagnostic instrument, but can only be used to assess depressive symptoms. The Dutch version of the questionnaire has a high internal consistency, with an alpha of .95 (Roelofs et al., 2013).
2.3 Procedure
Ethical approval was obtained through the ethical procedure at the Committee Ethics Psychology, and data was collected in Qualtrics (Qualtrics, 2017). The questionnaire
13 took approximately twenty minutes to complete the whole questionnaire. At the end,
participants were debriefed and could choose whether they wanted to leave their e-mail address to get a 1:25 chance to win one of the bol.com vouchers, worth 15 euros, or if they wanted to receive participants credits. First year students could receive one participant credit. 2.4 Statistical Analysis
All data was analyzed using SPSS statistics 23 (IBM Corp, 2014). Study categories were made. Those categories included mathematics and informatics, geoscience and nature, health and environmental studies, engineering and technology, medical and biomedical sciences, behavioral sciences and education, humanities, governance and global affairs, economics and business affairs, and law and criminology. Split half-reliability and Chronbach’s alpha were calculated, to examine the reliability of the LSPSS in the current sample. An exploratory factor analysis was used to examine the structure of the LSPSS, and to examine whether it was in line with the findings of Bergin and Pakenham (2014). Principal axis factoring with oblique rotation was used, and the number factors was determined by eigenvalues greater than 1. Hierarchical regression analyses were executed to analyze the relationship between the independent variable LSPSS score, the dependent variable BDI-II score and the moderating personality traits. Assumptions were checked using scatter doth graphs. Separate analyses were executed for each LSPSS scale. The interaction effects indicated whether the personality traits neuroticism, conscientiousness, agreeableness and extraversion moderate the proposed relationship between perceived stress and depressive symptoms, with covariates taken into account. For personality, the scales agreeableness, conscientiousness, extraversion,
neuroticism and openness to experience were computed from the 44 items questionnaire. The items were scaled according to the factor loadings of the Dutch translation of the Big Five Inventory (Denissen et al., 2008). The significant limit was set at p < .05, for all statistical tests. 3. Results
3.1 Demographics
14
Figure 1. Participant flow
3.2 Factor Analysis
Internal reliability for the LSPSS was r = .87, which was in line with the results of Bergin and Pakenham (2014). Before executing a factor analysis, the assumptions were tested. Firstly, most of the items had a correlation of at least .3 with at least one or more other items. Secondly, the Kaiser-Meyer-Olkin measure of sampling adequacy was .833, where the recommended value is .6, so this is sufficient. Bartlett’s test of sphericity was found to be significant (2 (120) = 2612.48, p = .000). Finally, communalities were all above .45 (see Table 2), confirming that all items had some shared variance with other items.
A principle component analysis was executed on the sixteen items of the LSPSS, using oblique rotation and based on eigenvalues > 1 and scree plot criteria. There were no items which did not load .40 or higher on any factor, so no items were excluded. Here, five
components had eigenvalues > 1 and met scree plot criteria. The first factor explained 33% of the variance, the second factor 11%, and the third, fourth and fifth factors explained 10%, 7% and 7% of the variance respectively. Together, those five factors explained 68% of the
15
Table 1. Demographic characteristics of the sample (N = 426)
Variable
Male (N= 106)
Female (N= 320)
Bachelor (N = 290)
Master (N = 136)
Total (N= 426) Age M (SD) 21.8 (3.6) 21.6 (2.5) 20.6 (2.5) 23.7 (2.3) 21.62 (2.85) Hours working M (SD) 2.68 (1.9) 2.59 (1.9) 2.51 (1.78) 2.83 (2.20) 2.62 (1.93) Living Situation N (%)
Together with students 43 (40.6) 178 (55.6) 159 (54.8) 62 (45.6) 221 (51.9) With partner 7 (6.6) 30 (9.4) 12 (4.1) 25 (18.4) 37 (8.7) With parents 36 (34.0) 55 (17.2) 74 (25.5) 17 (12.5) 91 (21.4)
Alone 19 (17.9) 52 (16.3) 42 (14.5) 29 (21.3) 71 (16.7)
Other 1 (.9) 5 (1.6) 3 (1.0) 3 (2.2) 6 (1.4)
Study phase N (%)
Bachelor 76 (71.7) 214 (66.9) 290 (68.1)
Master 30 (28.3) 106 (33.1) 136 (31.9)
How long studying M (SD) 3.09 (2.07) 3.23 (1.82) 2.3 (1.2) 5.2 (1.6) 3.20 (1.89) Study Category N (%)
Mathematics and Informatics 23 (21.7) 17 (5.3) 40 (13.8) 0 (0.0) 40 (9.4) Geoscience and Nature 1 (.9) 24 (7.5) 20 (7.9) 5 (3.7) 25 (5.9) Health and Environmental
Studies
8 (7.5) 31 (9.7) 28 (9.7) 11 (8.1) 39 (9.2)
Engineering and Technology 15 (14.2) 17 (5.3) 20 (6.9) 12 (8.8) 32 (7.5) Medical and Biomedical
Sciences
5 (4.7) 47 (14.7) 29 (10.0) 23 (6.9) 52 (12.2)
Behavioral Sciences and Education
11 (10.4) 64 (20.0) 53 (18.3) 22 (16.2) 75 (17.6)
Humanities 8 (7.5) 35 (10.9) 30 (10.3) 13 (9.6) 43 (10.1)
16
Table 2. Pattern matrix of the 16-item exploratory factor analysis for the LSPSS (N = 426)
Loadings LSPSS items Factor 1: Study/Life Imbalance Factor 2: Academic Demands Factor 3: Career Pressure Factor 4: Pressure to Perform Factor 5: Social Isolation Commun alities 2. The balance between study
and other responsibilities
.729 -.055 .168 .018 -.169 .590
5. Missing personal or social activities due to study requirements
.774 -.014 -.182 .044 .143 .665
8. Maintaining personal relationships outside of the university
.673 .064 -.104 .076 .320 .659
12. Have little free time to do things I like
.649 -.063 .123 .137 .022 .576
1. Exams that are worth a lot of credits
-.112 -.759 .024 .154 -.048 .616 3. The amount of time needed to
complete everything that is expected of me
.384 -.578 .161 -.143 -.061 .611
4. Fear of falling behind in study work and not being able to catch up
.127 -.530 -.034 .045 .263 .498
6. The amount of information that needs to be learned
.096 -.788 .116 -.069 -.021 .562
9. The difficulty level of the study load
-.018 -.758 -.078 -.032 .049 .562 11. Finding a full-time job after
my study
-.031 .042 .910 .071 .087 .868
16. Worries about my future career
-.006 -.057 .877 .054 .128 .868
7. Receiving low grades -.140 -.519 -.092 .531 .084 .669 13. The mutual competition to
get good grades
.108 .151 .124 .837 -.035 .738
14. The pressure to do well in my study
.140 -.142 .062 .744 .014 .734
15. The lack of social
connections with other students
-.065 -.017 .140 .045 .861 .789
10. Feeling socially isolated whilst being surrounded by other students
.148 -.038 .092 -.071 .786 .742
17
Table 3. Psychometric data for the LSPSS: bivariate correlations and internal consistency
1 2 3 4 5
1. Study-Life Imbalance (.766)
2. Academic Demands .441** (.788)
3. Career Pressure .316** .263** (.882)
4. Pressure to Perform .353** .474** .370** (.703)
5. Social Isolation .467** .354** .343** .311** (.745)
** p < .001 Chronbach’s alpha coefficients are in parentheses along the main diagonal.
Bergin and Pakenham (2014) found only four factors: academic demands, career pressure, social isolation, and study/life imbalance. In this study, we found five factors. Career pressure now only contains two questions, referring to employment and career. The other, new factor, refers to pressure and competition. Given that the factor ‘career pressure’ now only contains questions about career, the new factor will be given the name ‘pressure to perform’. In this sample, it does not seem possible to work with the four factors from Bergin and Pakenham (2014). When only including the four items referring to career pressure in the main questionnaire, also two factors were found. Also, when giving four fixed numbers to distract, those items do not load on the same factor. Therefore, I chose to work with five factors, instead of four, with the new variable ‘Pressure to Perform’, containing the items ‘Getting good grades’, ‘Pressure to do well on school’, and ‘competition to achieve good grades’. The item “Receiving low grades” loaded on two factors. It had a higher loading on pressure to perform, so it was chosen to accommodate the item in that scale. Executing the factor analysis on the original data set (N = 696), also shows five factors and communalities al above .45. For each subscale, good reliability was found, see Table 3. Convergent validity was found in the correlations between the LSPSS and the PSS, which were all moderate (Table 4).
18 perform (t(424) = -2.275, p = .024). Moreover, Pearson correlation showed that career
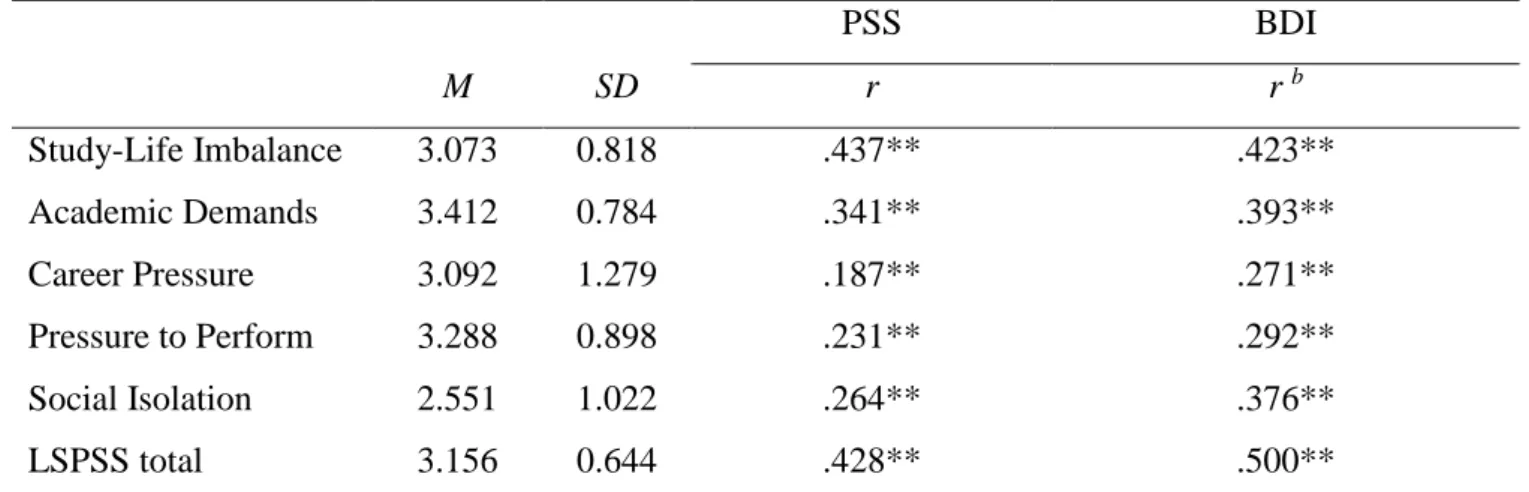
pressure was significantly related to age (r = .203, p < .001), so older participants reported stress by career pressure more frequently than younger participants. Table 4 shows
correlations of the LSPSS with the PSS and the BDI. All subscales of the LSPSS showed significant correlations with PSS and BDI scores.
Table 4. Means and standard deviations of the LSPSS subscales, and correlations with the
PSS and BDIa
PSS BDI
M SD r r b
Study-Life Imbalance 3.073 0.818 .437** .423**
Academic Demands 3.412 0.784 .341** .393**
Career Pressure 3.092 1.279 .187** .271**
Pressure to Perform 3.288 0.898 .231** .292**
Social Isolation 2.551 1.022 .264** .376**
LSPSS total 3.156 0.644 .428** .500**
**p < .001. a PSS = Perceived Stress Scale; BDI = Beck’s Depression Inventory. b Spearman correlation
Analysis on BDI scores revealed that 64.3% had minimal depression, and 15.5%, 13.4%, and 6.8% had mild, moderate and severe depression respectively. It was found that BDI scores were not normally distributed (skewness = 1.061, SE = .118), a histogram shows that the scores are skewed right. Skewness values around 0 indicate that scores are normally distributed (Field, 2013) As a result, the data were log transformed, which improved
homoscedasticity and normal distribution (skewness = -0.768, SE = .118). An independent t-test with the transformed BDI scores showed that there was no difference in BDI scores for gender (t(424) = -1.576, p = .116), and neither for study phase (t(424) = 0.848, p = .397). There were no notable differences in depression scores among study categories, and no significant correlations with years studying.
3.3 Student stress and depression
19 literature on this topic. Third, the model must be linear. After computing a scatter dot graph, a linear function between LSPSS and BDI scores was shown, so this assumption was also met. Fourth, the model must be homoscedastic. Scatter dot, however, showed a relatively
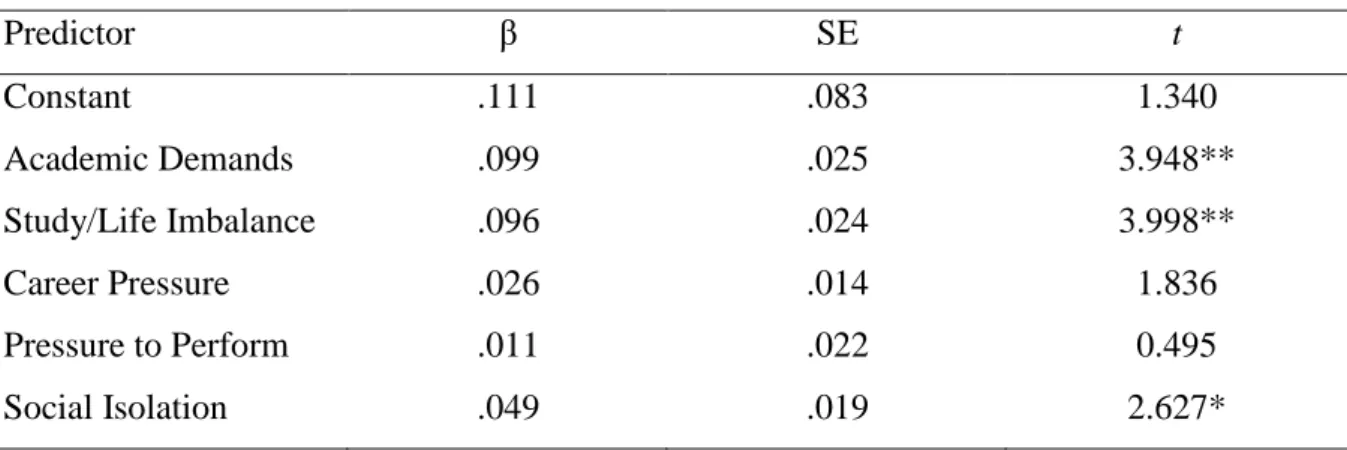
heteroscedastic plot. It could not be stated that the model is homoscedastic. As described before, the BDI scores were not normally distributed. The log transformation of the scores showed a more normal distribution and was more homoscedastic. Regression analysis on this data for the PSS and the subscales of the LSPSS was executed, using forced entry method. In Table 5, the outcomes of the regression analysis are shown. Only academic demands,
study/life imbalance and social isolation were significant predictors of higher scores on the BDI. The variance explained by this model, was found to be 23.5%, being a medium effect (Field, 2013).
Table 5. Regression analysis with dependent variable BDI scores (log transformed)
Predictor β SE t
Constant .111 .083 1.340
Academic Demands .099 .025 3.948**
Study/Life Imbalance .096 .024 3.998**
Career Pressure .026 .014 1.836
Pressure to Perform .011 .022 0.495
Social Isolation .049 .019 2.627*
* p < .05 ** p < .001
When the Perceived Stress scale was entered into this model, only academic demands and study/life imbalance were significant predictors. The new model explained 34.4% of the variance of depression scores. This indicated that some of the variance explained by academic stress and study/life imbalance, overlapped with perceived stress. The unique variance
explained by student stress only was 8.4% (F(5,419) = 10.749, p < .001). Given the significance of this finding, the first hypothesis was accepted.
3.4 Moderation analysis
The second hypothesis expected that the Big Five personality traits agreeableness,
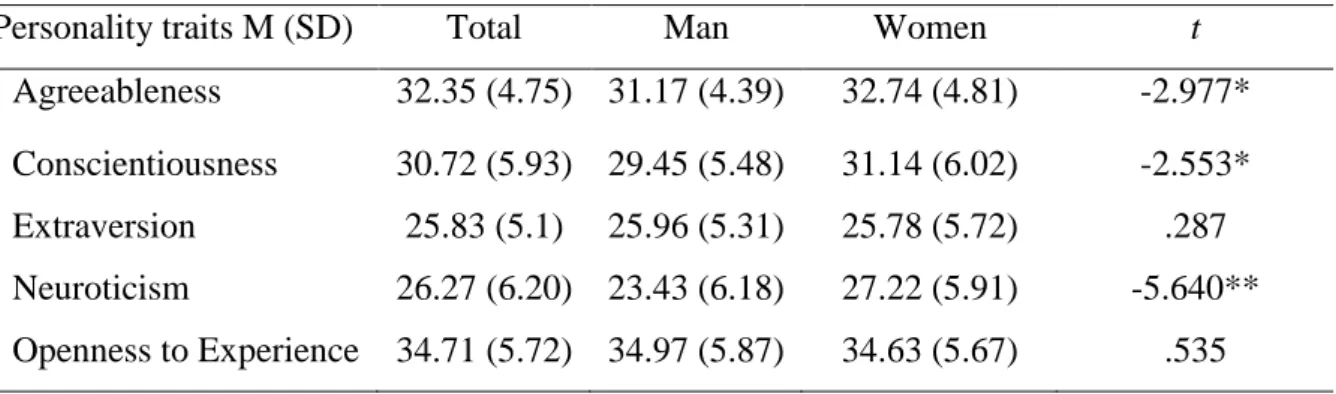
20 (t(424) = -2.977, p = .003). For extraversion and openness to experience, no gender
differences were found.
Table 6. Means, standard deviations and differences in gender for personality traits
Personality traits M (SD) Total Man Women t
Agreeableness 32.35 (4.75) 31.17 (4.39) 32.74 (4.81) -2.977* Conscientiousness 30.72 (5.93) 29.45 (5.48) 31.14 (6.02) -2.553* Extraversion 25.83 (5.1) 25.96 (5.31) 25.78 (5.72) .287 Neuroticism 26.27 (6.20) 23.43 (6.18) 27.22 (5.91) -5.640** Openness to Experience 34.71 (5.72) 34.97 (5.87) 34.63 (5.67) .535
*p < .05 ** p < .001
A significant positive correlation with depressive symptoms was found for neuroticism (r
= .617, p < .001). Significant negative correlations with depressive symptoms were found for agreeableness (r = -.172, p < .001), conscientiousness (r = -.151, p = .002) and extraversion (r
= -.244, p < .001). No significant correlation was found for openness to experience and depressive symptoms. The highest mutual correlation was found for extraversion and neuroticism, with values r = -.309, and p < .001. This negative correlation indicated that students who scored high on extraversion, in most cases, did not score high on neuroticism. And vice versa, neurotic students are not likely to report extraversion. No other notable combinations were found between the subscales of the BFI.
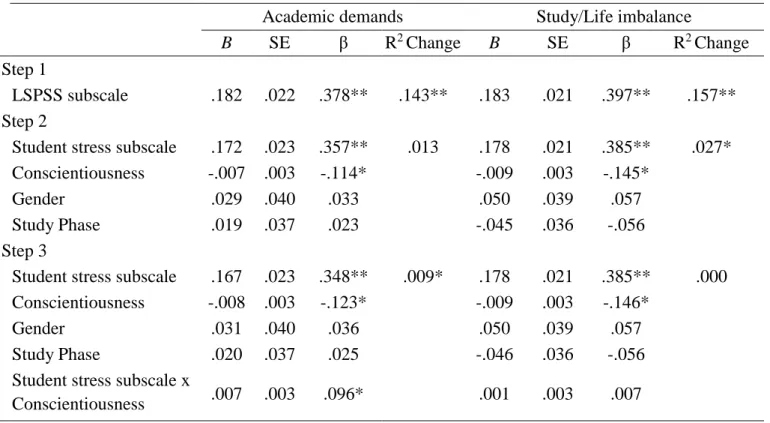
Academic demands and study/life imbalance were the only significant predictors of depressive symptoms. The unique variance explained by those factors was 8.4% (F(5,419) = 10.749, p < .001). Therefore, they were included in the analysis as independent variables. Firstly, all independent variables were centered. Secondly, interaction variables were
21 symptoms scale when under high amount of academic demands in comparison with the high conscientious students. Thus, it positively moderated the relationship between academic demands and BDI scores. This was the only significant moderator. Figure 2 shows the interactions graph for this finding. For neuroticism, agreeableness and extraversion,
hierarchical regression analyses were executed too. Those results can be found in Table 8,9 and 10. None of these traits moderated the relationship with academic demands or study/life imbalance. Therefore, the second hypothesis can only be partly accepted.
Table 7. Hierarchical regression with moderator conscientiousness
Academic demands Study/Life imbalance
B SE β R2 Change B SE β R2 Change
Step 1
LSPSS subscale .182 .022 .378** .143** .183 .021 .397** .157** Step 2
Student stress subscale .172 .023 .357** .013 .178 .021 .385** .027* Conscientiousness -.007 .003 -.114* -.009 .003 -.145*
Gender .029 .040 .033 .050 .039 .057
Study Phase .019 .037 .023 -.045 .036 -.056
Step 3
Student stress subscale .167 .023 .348** .009* .178 .021 .385** .000 Conscientiousness -.008 .003 -.123* -.009 .003 -.146*
Gender .031 .040 .036 .050 .039 .057
Study Phase .020 .037 .025 -.046 .036 -.056
Student stress subscale x
Conscientiousness .007 .003 .096* .001 .003 .007
22
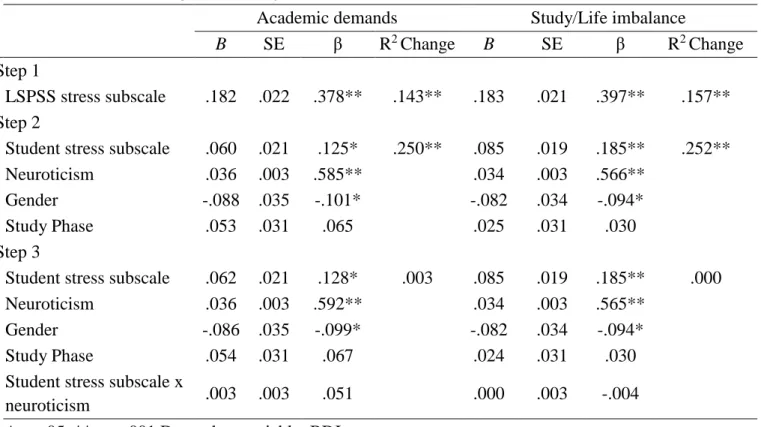
Table 8. Hierarchical regression analyses with moderator neuroticism
Academic demands Study/Life imbalance
B SE β R2 Change B SE β R2 Change
Step 1
LSPSS stress subscale .182 .022 .378** .143** .183 .021 .397** .157** Step 2
Student stress subscale .060 .021 .125* .250** .085 .019 .185** .252**
Neuroticism .036 .003 .585** .034 .003 .566**
Gender -.088 .035 -.101* -.082 .034 -.094*
Study Phase .053 .031 .065 .025 .031 .030
Step 3
Student stress subscale .062 .021 .128* .003 .085 .019 .185** .000
Neuroticism .036 .003 .592** .034 .003 .565**
Gender -.086 .035 -.099* -.082 .034 -.094*
Study Phase .054 .031 .067 .024 .031 .030
Student stress subscale x
neuroticism .003 .003 .051 .000 .003 -.004
* p <.05, ** p < .001 Dependent variable: BDI score.
Table 9 Hierarchical regression analyses with moderator agreeableness
Academic demands Study/Life imbalance
B SE β R2 Change B SE β R2 Change
Step 1
LSPSS stress subscale .182 .022 .378** .143** .183 .021 .397** .157**
Step 2
Student stress subscale .179 .022 .372** .027* .182 .020 .394** .034* Agreeableness -.013 .004 -.164** -.013 .004 -.168**
Gender .036 .040 .041 .055 .039 .063
Study Phase .005 .036 .007 -.064 .036 -.079
Step 3
Student stress subscale .179 .022 .372** .000 .182 .020 .394** .000 Agreeableness -.013 .004 -.164** -.013 .004 -.169**
Gender .036 .040 .041 .056 .039 .064
Study Phase .006 .037 .007 -.063 .036 -.078
Student stress subscale x
Agreeableness .001 .004 .007 .001 .004 .009
23
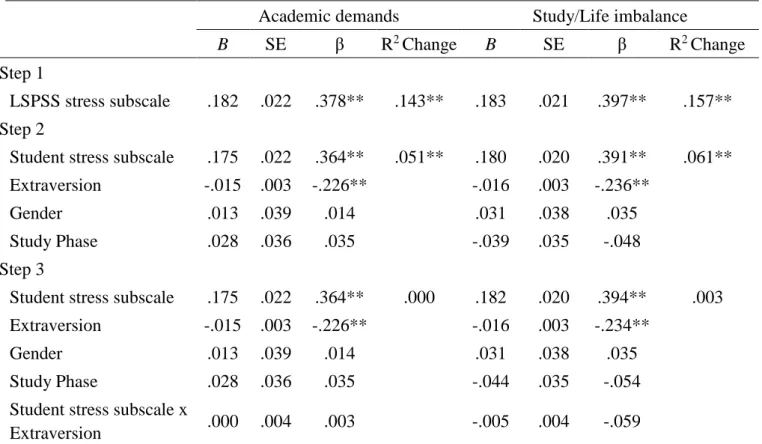
Table 10 Hierarchical regression analyses with moderator extraversion
Academic demands Study/Life imbalance
B SE β R2 Change B SE β R2 Change
Step 1
LSPSS stress subscale .182 .022 .378** .143** .183 .021 .397** .157** Step 2
Student stress subscale .175 .022 .364** .051** .180 .020 .391** .061** Extraversion -.015 .003 -.226** -.016 .003 -.236**
Gender .013 .039 .014 .031 .038 .035
Study Phase .028 .036 .035 -.039 .035 -.048
Step 3
Student stress subscale .175 .022 .364** .000 .182 .020 .394** .003 Extraversion -.015 .003 -.226** -.016 .003 -.234**
Gender .013 .039 .014 .031 .038 .035
Study Phase .028 .036 .035 -.044 .035 -.054
Student stress subscale x
Extraversion .000 .004 .003 -.005 .004 -.059
* p <.05, ** p < .001 Dependent variable: BDI score.
24 4. Discussion
The purpose of this study was to examine the relationship between study stress and depressive symptoms, and the possible moderating effect of several of the Big Five personality traits. The first hypothesis, which stated that study stress was of predicting value for depressive symptoms, was supported. The second hypothesis predicted moderating effects of
agreeableness, conscientiousness, neuroticism and extraversion. This hypothesis was only partly accepted, since only conscientiousness appeared to have a moderating effect on the relationship between academic demands and depressive symptoms.
25 and important (Hammen, 2007). This could explain why academic demands and study/life imbalance are associated with depression. For students, their study is one of the most
important responsibilities they have to deal with at that moment. Getting good grades, keeping up with course work and having enough time to study for tests, are of great importance for students. Perceiving stress in those areas, when appraising it as highly meaningful, could lead to depressive symptoms more rapidly.
In the current study, 35% had at least minimal depression, and only 20.2% had
moderate or severe depression, which was in line with previous research (Ibrahim et al., 2013; Sarokhani et al., 2013; Schofield et al., 2016).Most studies found prevalence rates between 30% and 40%. There appear to be no differences between men and women for depression scores. This is unusual, for depression is usually more common in women than in men (Ayoso-Mateos, 2001). Likewise, the majority of the studies in the student population to depression, indicate higher prevalence rates for female students, in comparison to male
students (Ibrahim et al., 2013). A minority of the studies found no differences in gender in this particular population, where it was argued that this gender difference does not exists in
student populations (Eisenberg et al., 2007). The current study agrees with the latter finding, however more research is needed to examine possible differences in gender in depressive symptoms among students.
26 Neuroticism did not influence the relationship between student stress and depressive symptoms. Neuroticism itself is a very strong predictor of both perceived study stress and depression scores. The high correlations indicate high overlap between those variables. It appeared that the relationship between perceived stress, depressive symptoms and neuroticism is a difficult one. According to the questionnaire, high neurotic students are more likely to feel depressed or tensed, worry a lot, be moody and get nervous easily. Neurotic students do not handle stress well, nor are they emotionally stable or calm in tense situations. Scoring high on the perceived stress questionnaire means feeling overwhelmed, feeling tensed and nervous and lacking the control to handle the stressful situation. This could explain why no interaction effects were found, for both the neuroticism items and the perceived stress items measured more or less the same. Besides overlap with perceived stress, there is also evidence found for high overlap between neuroticism and depression. The following models attempt to explain this overlap. The common cause model states that shared determining factors account for the relationship between neuroticism and common mental disorders (CMD), such as depression. The spectrum model implies that neuroticism and common mental disorders (especially internalizing mental disorders) are other manifestations of similar processes, which reflects that high levels of neuroticism is equivalent to, for example, depressive symptoms. (Ormel et al., 2013). The current study found strong associations between neuroticism and depressive symptoms, which indicates overlap. This may explain why neuroticism does not moderate the relationship, because nearly similar factors are measured. Yet, earlier research did found moderating effects of neuroticism (Bunevicius, Katkute and Bunevicius, 2008). In their study, another questionnaire measuring stress was used, i.e., the Vulnerability to Stress scale, which focuses more on the ability to weather stress, rather than feeling stressed. This could possibly explain the inconclusiveness of those results.
27 higher perceived stress levels and more depressive symptoms. Very little is known about the possible moderation of those traits between perceived stress and depressive symptoms. There is some research about the influence of agreeableness and extraversion on stress appraisal. Extraversion was found to have significant positive correlations with healthy stress appraisal, i.e., challenge appraisal (Gallagher, 1990). This means extraverted people tend to see stressful situations as challenging and a change to learn something, whether less extraverted people see stressful situations as threatening. Agreeableness is associated with healthy coping too
(Connor-Smith & Flachsbart, 2017). Therefore, it could be the case that personality traits do influence stress appraisal, meaning that perceived stress is not influenced by personality stress directly, only indirectly through appraisal. Thereby, there is still a debate going on whether personality traits are stable, even under depressive episodes (McCrae and Costa, 2008). If personality traits appear to be unstable during depression, it is harder to find moderation effects in a cross-sectional study. Given that this study only measured personality at one point, nothing can be said about personality traits before a student began to experience depressive symptoms. This could explain why very little results were found in the current study. Implications for further research would include conducting acohort or other longitudinal study with multiple measuring points could control for this. Thereby, causal inferences can be made in such design.
28 2010). These issues were partly alleviated by the anonymity of the survey and by the
reversing of some of the questions in the questionnaires. Moreover, selection bias could play a role in the current study. Given that the study was about stress and depressive symptoms, it could be the case that students who are feeling stressed or depressed are more rapidly attended to the posters or Facebook posts, than students who do not have such feelings. This could lead to overestimation of the presence of stress and depressive symptoms among students in the current sample. Fourthly, the use of a non-validated questionnaire could also be mentioned as a study limitation. The LSPSS was translated to Dutch, but there was no pilot done with this questionnaire. For now, it remains unknown whether the participants fully understood the nature of the questions, which could have influenced the results. Nonetheless, the internal and convergent validity in this sample were sufficient. More research is needed to confirm this validity, and the reliability and comprehension among students. Besides, it could be the case that this questionnaire is not exhaustive enough. More types of stressors apart from the items in the LSPSS, may possibly contribute to student stress and depressive symptoms. Therefore, this questionnaire should not be seen as leading in this field, but may need to be enhanced after more research.At last, the sample used in this study was relatively heterogenic, which made it harder to find results. Subgroups were not large enough for separate analyses, so it is difficult to distinguish where possible effects are found and which confounders or covariates play a role in the relationship between perceived study stress and depressive symptoms.
However, the heterogeneity is also a strong point of this study. Much of previous research focused solely on medical or nursing students, this study examined a wide range of studies. This means the results are generalizable to the whole student population, and not only to medical students. Moreover, the study was conducted at different universities, which also contributes strongly to the generalizability of this study. Another strong point is the relatively high sample size. A third strong point is the questionnaires used in this study. The Big Five Inventory, the Perceived Stress Scale and Beck’s Depression Inventory are all validated and reliable scales (Cohen, 1983; Denissen et al., 2008; Roelofs et al., 2013).
4.1 Conclusion and implications
29 was found to increase the chance to develop depressive symptoms under high amounts of academic demands.
Apart from the need for more research on this subject, several implications can already be done. To our knowledge, this is the first study on this subject among the Dutch student population. This study gave a good insight in the students issues related to stress and
depression, which has some practical implications. This study and earlier research made clear that depressive symptoms are of serious concern among students. Even though this study only took depressive symptoms into account, previous research found numerous negative effects of stress, such as poorer physical health or worse academic outcomes (Leppink et al., 2016; Struthers, Perry and Menec, 2000). It seems like academic success – and career perspectives - partly rely on a healthy mental state, which points out the importance of attention for
problems in this area. To begin with, students counselors could be of big difference for those students who need psychological help. There seems to be an increase of help-seeking
behavior among students, however it is not clear whether that is due to a true increase in psychological problems among students, or a more general increase in help-seeking (Hunt and Eisenberg, 2010). In the Netherlands, it appeared that students are satisfied with the help offered, but improvements are needed in the facilitation and availability of student counselors (Interstedelijk Studenten Overleg, 2016). The findings on personality traits moderating the relation between stress and depression, have some theoretical implications. More research is needed on this subject, but this study gives more insight in what aspects of personality can work as a protective factors, and what traits have a negative impact on the relation.
Combinations of personality traits and the effects were not examined, so further research is needed to find out which combination of traits influence development of depression in a protective or threatening manner.
Given that dealing with stress ineffectively seems to be a strong predictor of
depressive symptoms (Felsten, 2004), it appears that students will benefit most from learning how to handle study stressors, or finding ways to reduce this stress. Universities could offer programs to help students weathering stress. Trainings focusing on time- and stress
30 References
Abouserie, R. (1994). Sources and levels of stress in relation to locus of control and self- esteem in university students. Educational psychology, 14(3), 323-330.
Avison, W. R., & McAlpine, D. D. (1992). Gender differences in symptoms of depression among adolescents. Journal of health and social behavior, 77-96.
Ayuso-Mateos, J. L., Vázquez-Barquero, J. L., Dowrick, C., Lehtinen, V., Dalgard, O. S., Casey, P., & Wilkinson, G. (2001). Depressive disorders in Europe: prevalence figures from the ODIN study. The British Journal of Psychiatry, 179, 308-316. Beiter, R., Nash, R., McCrady, M., Rhoades, D., Linscomb, M., Clarahan, M., & Sammut, S.
(2015). The prevalence and correlates of depression, anxiety, and stress in a sample of college students. Journal of Affective Disorders, 173, 90-96
Bergin, A., & Pakenham, K. (2015). Law student stress: Relationships between academic demands, social isolation, career pressure, study/life imbalance and adjustment outcomes in law students. Psychiatry, Psychology and Law, 22(3), 388-406. Bewick, B., Koutsopoulou, G., Miles, J., Slaa, E., & Barkham, M. (2010). Changes in
undergraduate students’ psychological well‐ being as they progress through university. Studies in Higher Education, 35(6), 633-645.
Blanco, C., Okuda, M., Wright, C., Hasin, D. S., Grant, B. F., Liu, S. M., & Olfson, M. (2008). Mental health of college students and their non–college-attending peers: results from the national epidemiologic study on alcohol and related conditions.
Archives of general psychiatry, 65, 1429-1437.
Boyce, P., Parker, G., Barnett, B., Cooney, M., & Smith, F. (1991). Personality as a
vulnerability factor to depression. The British Journal of Psychiatry, 159(1), 106-114. Bunevicius, A., Katkute, A., & Bunevicius, R. (2008). Symptoms of anxiety and depression in
medical students and in humanities students: relationship with Big-Five personality dimensions and vulnerability to stress. International Journal of Social Psychiatry, 54(6), 494-501.
Chan, S.W.Y., Goodwin, G.M., & Harmer, C.J. (2007). Highly neurotic never-depressed students have negative biases in information processing. Psychological Medicine, 37,
31 Chien, L, Ko, H., & Wu, J.Y. (2007). The five-factor model of personality and depressive
symptoms: One-year follow-up. Personality and Individual Differences, 43, 1013-1023
Connor-Smith, J. K., & Flachsbart, C. (2007). Relations between personality and coping: a meta-analysis. Journal of personality and social psychology, 93(6), 1080.
Cohen, S., Kamarck, T., & Mermelstein, R. (1983). A Global Measure of Perceived Stress.
Journal of Health and Social Behavior, 24, 385-396
Denissen, J. J., Geenen, R., Van Aken, M. A., Gosling, S. D., & Potter, J. (2008).
Development and validation of a Dutch translation of the Big Five Inventory (BFI). Journal of personality assessment, 90(2), 152-157.
Dodd-McCue, D., & Tartaglia, A. (2010). Self-report response bias: learning how to live with its diagnosis in chaplaincy research. Chaplaincy Today, 26(1), 2-8.
Dunkley, D.M., Blankstein, K.R., & Flett, G.L. (1997). Specific Cognitive-Personality Vulnerability Styles in Depression and the Five-Factor Model of Personality. Person. Individ. Diff, 23, 1041-1053
Dusselier, L., Dunn, B., Wang, Y., Shelley, M.C., & Whalen, D.F. (2010). Personal, Health, Academic, and Environmental Predictors of Stress for Residence Hall Students.
Journal of American College Health, 54, 15-24.
Ebstrup, J.F., Eplov, L.F., Pisinger, C., & Jorgensen, T. (2011). Association between the Five Factor personality traits and perceived stress: is the effect mediated by general self-efficacy? Anxiety, Stress, & Coping, 24, 407-419.
Eisenberg, D., Gollust, S. E., Golberstein, E., & Hefner, J. L. (2007). Prevalence and
correlates of depression, anxiety, and suicidality among university students. American Journal of Orthopsychiatry, 77(4), 534-542.
Felsten, G. (2004). Stress reactivity and vulnerability to depressed mood in college students.
Personality and Individual Differences, 36(4), 789-800.
Field, A. (2013) Discovering Statistics Using IBM SPSS Statistics. London: SAGE Publications Ltd.
Gallagher, D.J. (1990). Extraversion, Neuroticism and Appraisal of Stressful Academic Events. Personal Individual Differences, 11, 1053-1057.
32 Hudd, S. S., Dumlao, J., Erdmann-Sager, D., Murray, D., Phan, E., Soukas, N., & Yokozuka,
N. (2000). Stress at college: Effects on health habits, health status and self-esteem.
College Student Journal, 34(2), 217-228.
Hurst, C.S., Baranik, L.E., & Daniel, F. (2011). College Student Stressors: A Review of the Qualitative Research. Stress and Health, 29, 275-285.
IBM Corp. (2014). IBM SPSS Statistics for Windows, Version 23.0 [Computer software]. Armonk, NY: IBM Corp
Ibrahim, A. K., Kelly, S. J., Adams, C. E., & Glazebrook, C. (2013). A systematic review of studies of depression prevalence in university students. Journal of psychiatric research, 47(3), 391-400.
Interstedelijk Studenten Overleg (2015). Studentenpsychologen, een stand van zaken. Retrieved from: http://www.iso.nl/website/wp-content/uploads/2016/10/1617-Onderzoek-Studentenpsychologen-1.pdf.
Kanner, A.D., Coyne, J.C., Schaefer, C., & Lazarus, R.S. (1981). Comparison of Two Modes of Stress measurement: Daily Hassles and Uplifts Versus Major Life Events. Journal of Behavioral Medicine, 4, 1-39.
Kendler, K.S., Gatz, M., Gardner, C.O., & Pedersen, N.L. (2006). Personality and Major Depression: a Swedish Longitudinal, Population-Based Twin Study. Arch. Gen. Psychiatry, 63, 1113-1120.
Kim, S. E., Kim, H. N., Cho, J., Kwon, M. J., Chang, Y., Ryu, S., ... & Kim, H. L. (2016). Direct and indirect effects of five factor personality and gender on depressive symptoms mediated by perceived stress. PloS one, 11(4), e0154140
Korotkov, D. (2008). Does personality moderate the relationship between stress and health behavior? Expanding the nomological network of the five-factor model. Journal of research in Personality, 42(6), 1418-1426.
Leppink, E. W., Odlaug, B. L., Lust, K., Christenson, G., & Grant, J. E. (2016). The Young and the Stressed: Stress, Impulse Control, and Health in College Students. The Journal of nervous and mental disease, 204(12), 931-938.
33 Martin, D. J., Abramson, L. Y., & Alloy, L. B. (1984). Illusion of control for self and others
in depressed and nondepressed college students. Journal of Personality and Social Psychology, 46(1), 125.
McCrae, R.R., & Costa, P.T. (1987). Validation of the Five-Factor Model of Personality Across Instruments and Observers. Journal of Personality and Social Psychology, 52,
81-90.
Costa, P. T., & McCrae, R. R. (2008). The revised neo personality inventory (neo-pi-r). The SAGE handbook of personality theory and assessment, 2, 179-198.
Mikolajczyk, R. T., Maxwell, A. E., Naydenova, V., Meier, S., & El Ansari, W. (2008). Depressive symptoms and perceived burdens related to being a student: Survey in three European countries. Clinical Practice and Epidemiology in Mental Health, 4(1), 19.
Misra, R., & McKean, M. (2000). College Students’ Academic Stress And Its Relation To Their Anxiety, Time Management, And Leisure Satisfaction. American Journal of Health Studies, 16, 41-51.
Ministerie van OCW (2015). Studentenmonitor .Retrieved from: f http://www.studentenmonitor.nl/tabellen/index.html
Opinie UT (2012). Uitkomsten landelijke enquête studiedruk. Retrieved from: https://core.ac.uk/download/pdf/11486734.pdf
Ormel, J., Jeronimus, B. F., Kotov, R., Riese, H., Bos, E. H., Hankin, B., ... & Oldehinkel, A. J. (2013). Neuroticism and common mental disorders: meaning and utility of a
complex relationship. Clinical psychology review, 33(5), 686-697.
Penley, J.A., & Tomaka, J. (2002). Associations among the Big Five, emotional responses, and coping with acute stress. Personality and Individual Differences, 32, 1215-1228. Robotham, D. (2008). Stress among higher education students: towards a research agenda.
Higher Education, 56, 735-746.
Roelofs, J., van Breukelen, G., de Graaf, L.E., Beck, A.T., Arntz, A., & Huibers, M.J.H. (2013). Norms for the Beck Depression Inventory (BDI-II) in a large Dutch
community sample. Journal of Psychopathology and Behavioral Assessment, 35, 93-98.
Ross, S.E., Niebling, B.C., & Heckert, T.M. (1999) Sources of stress among college students.
34 Royal College of Psychiatrics London (2011). Mental Health of Students in Higher
Education, College report CR166. Retrieved from http://www.rcpsych.ac.uk/files/pdfversion/CR166.pdf
Saklofske, D. H., Austin, E. J., Mastoras, S. M., Beaton, L., & Osborne, S. E. (2012). Relationships of personality, affect, emotional intelligence and coping with student stress and academic success: Different patterns of association for stress and success.
Learning and Individual Differences, 22(2), 251-257.
Saleh, D., Camart, N., & Romo, L. (2017). Predictors of Stress in College Students. Frontiers in Psychology, 8(19).
Sarokhani, D., Delpisheh, A., Veisani, Y., Sarokhani, M. T., Manesh, R. E., & Sayehmiri, K. (2013). Prevalence of Depression among University Students: A Systematic Review and Meta-Analysis Study. Depression Research and Treatment, 2013, 373857. Schneider, T.R., Rench, T.A., Lyons, J.B., & Riffle, R.R. (2011). The Influence of
Neuroticism, Extraversion and Opennes on Stress Responses. Stress and Health, 28,
102-110.
Schofield, M. J., O'halloran, P., McLean, S. A., Forrester‐Knauss, C., & Paxton, S. J. (2016). Depressive symptoms among Australian university students: who is at risk?.
Australian Psychologist, 51(2), 135-144.
Simić-Vukomanović, I., Mihajlović, G., Kocić, S., Đonović, N., Banković, D., Vukomanović, V., & Đukić-Dejanović, S. (2016). The prevalence and socioeconomic correlates of depressive and anxiety symptoms in a group of 1,940 Serbian university students.
Vojnosanitetski pregled, 73(2), 169-177.
Spinhoven, P., Elzinga, B.M., Hemert, A.M., Rooij, M., & Penninx, B.W. (2014). A longitudinal study of facets of extraversion in depression and social anxiety.
Personality and Individual Differences, 71, 39-44
Struthers, C.W., Perry, R.P., & Menec, V.H. (2000). An examination of the relationship among academic stress, coping, motivation, and performance in college. Research in Higher Education, 41, 581-592.
Uliaszek, A. A., Zinbarg, R. E., Mineka, S., Craske, M. G., Sutton, J. M., Griffith, J. W., ... & Hammen, C. (2010). The role of neuroticism and extraversion in the stress–anxiety and stress–depression relationships. Anxiety, Stress, & Coping, 23(4), 363-381.
35 VSNU (2012). Prestaties in Perspectief, trendrapportage universiteiten 2000-2020.
Retrieved from
http://www.vsnu.nl/files/documenten/Publicaties/Trendrapportage_DEF.pdf
Walsemann, K. M., Gee, G. C., & Gentile, D. (2015). Sick of our loans: Student borrowing and the mental health of young adults in the United States. Social Science & Medicine, 124, 85-93.
Qualtrics (2017). Qualtrics [Computer software]. Provo, Utah, USA. Retrieved from www.qualtrics.com