Arctic Plant Migration by 2100:
Comparing Predictions with Observations
Dahl Winters
A thesis submitted to the faculty of the University of North Carolina at Chapel Hill in partial fulfillment of the requirements for the degree of Master of Science in the
Curriculum of Ecology.
Chapel Hill 2009
Abstract
Dahl Winters: Arctic Plant Migration by 2100: Comparing Predictions With Observations (Under the direction of Dr. Aaron Moody)
iii
Acknowledgements
I dedicate this thesis to my husband, Loren Winters, for his endless love and support throughout the three and a half years I have worked on my degree. He has been the light at the end of my thesis tunnel, the lifter of my spirits, and my constant reminder of the joys that await me when I finish.
I would also like to thank my advisor, Aaron Moody, for continuing to offer advice and support to me throughout all my years of study, as well as Bob Peet, Pat Gensel, Denise Kenney, and Mary Beth Robbins for providing me with support, direction, and guidance. I also want to acknowledge Jack Weiss for instilling in me a healthy respect for statistics despite my constant battles with R, and Conghe Song, Michael Emch, and Jun Liang for introducing me to the worlds of remote sensing, GIS, and model
programming. This thesis exists in large part because of their contributions to my graduate education.
Table of Contents
List of Tables ... vi
List of Figures ... vii
Chapter 1. Introduction ... 1
2. Background ... 3
2. 1. Ecological Importance of the Arctic ... 3
2. 2. The Arctic Climate Impact Assessment (ACIA) ... 4
2. 3. Research Objectives ... 5
3. Methods ... 8
3. 1. Study System ... 8
3. 2. The ACIA Biome Model ... 9
3. 3. Empirical Data ... 10
3. 4. Comparison of Data to Model Predictions ... 12
4. Results ... 14
4. 1. Summary of Empirical Studies ... 14
5. Discussion ... 20
5. 1. Water Availability ... 20
5. 2. Time Lags ... 23
v
5. 4. Regional Variability ... 25
5. 5. Rates of Migration ... 27
6. Conclusion ... 28
Appendices Appendix 1: Supplementary Tables ... 29
Appendix 2: Multi-Level Model ... 44
Appendix 3: Figures ... 45
List of Tables
Table
1. Judging Matches from Possible Combinations of Data and Model Findings ... 12
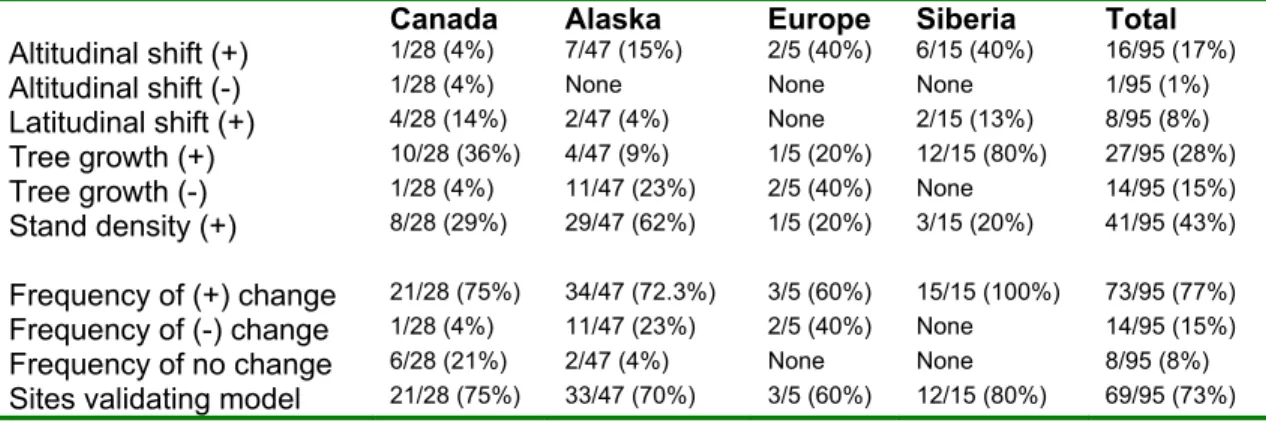
2. Frequency of Change Observations by Geographic Region ... 14
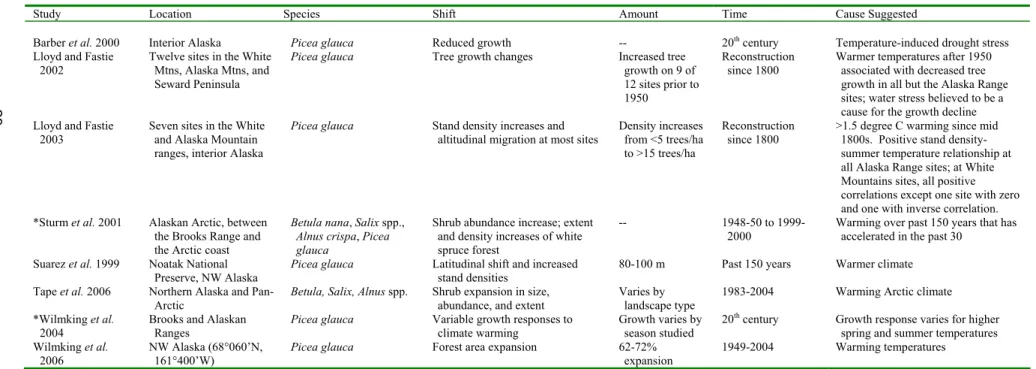
A. 1. 1. Empirical Studies of Arctic Plant Migration and Related Changes ... 29
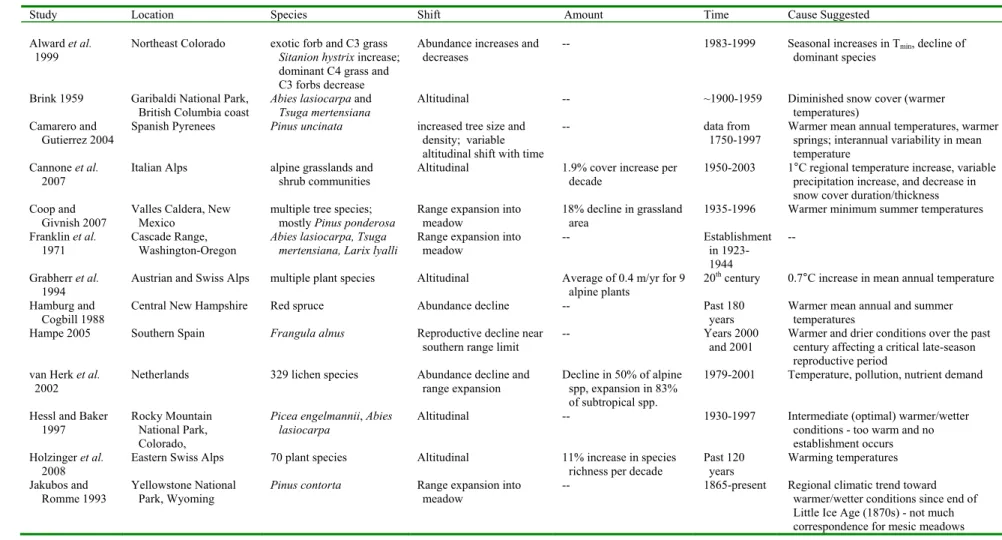
A. 1. 2. Non-Arctic Observations of Plant Migration and Related Changes ... 33
A. 1. 3. Correspondence between Predictions and Observations, by Study Site ... 35
A. 1. 4. Comparison of Present and Predicted Biome Types, by Study ... 38
vii
List of Figures
Figure
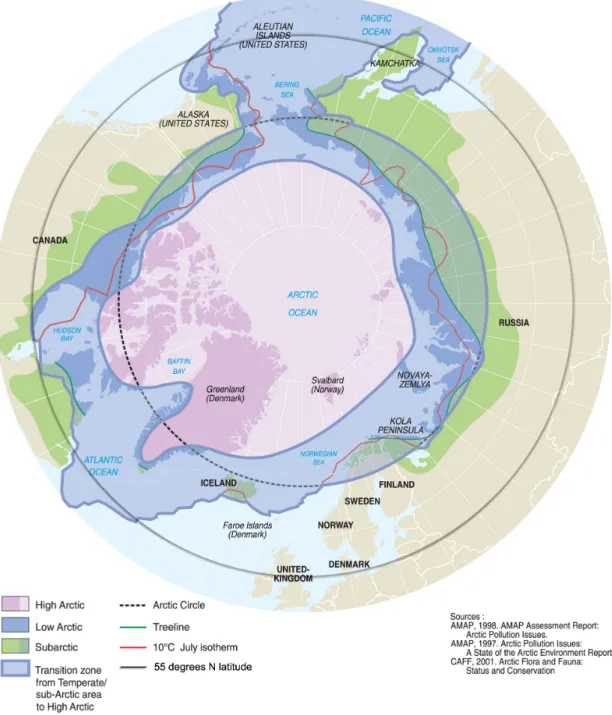
1.Comparison of Arctic Definitions ... 45
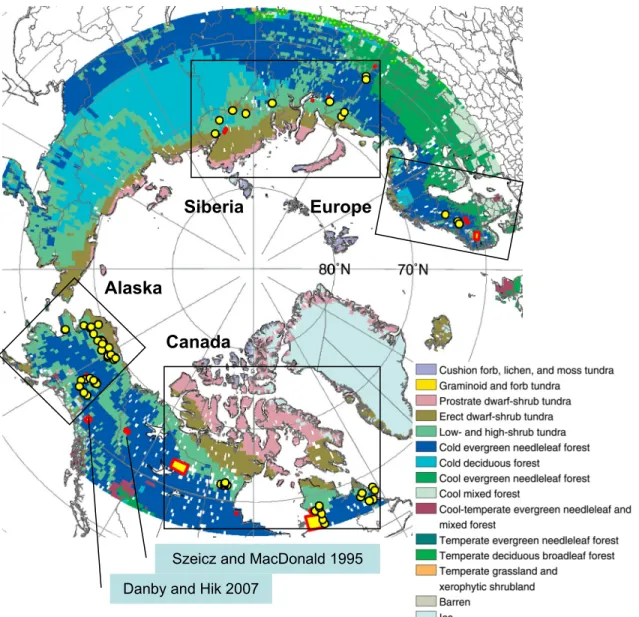
2. Study Site Locations in Relation to Present and Predicted Vegetation ... 46
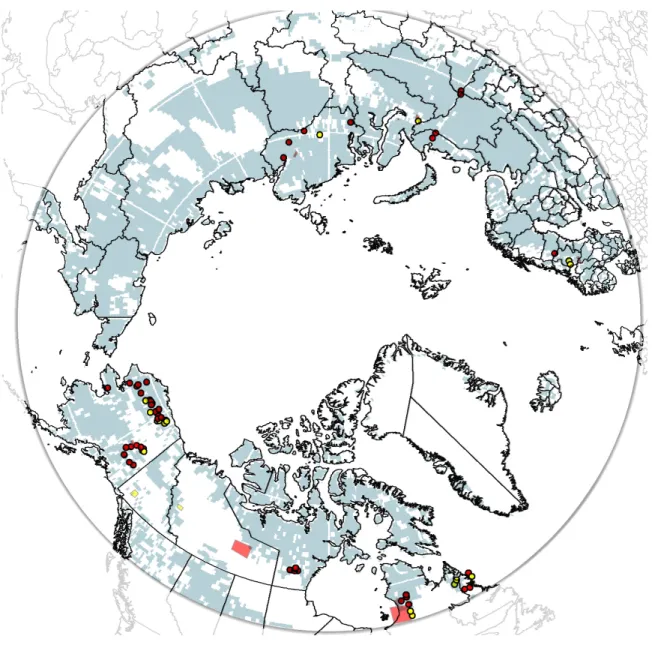
3. Study Site Locations in Relation to Areas of Predicted Change ... 48
1. Introduction
Although not always apparent, the global distributions of terrestrial biomes are dynamic, as are the ecosystem functions they fulfill. Given the rate and magnitude of anthropogenic climate change and expected ecosystem responses to it, it would appear that, on top of other human-caused ecosystem changes, we can expect changes in biome distributions over time scales of decades to centuries, with consequent implications for carbon storage and the provision of other ecosystem goods and services globally and locally (ACIA 2004). Nowhere are the implications of these trends greater than in the Arctic, which contains a major portion of Earth’s terrestrial ecosystem carbon storage (Soja et al. 2007) distributed throughout vast and largely intact forests, peatlands, and tundra (ACIA 2004, Soja et al. 2007). In the Arctic, temperature increases have already been large relative to other global regions (IPCC 2007) and this trend is projected to continue (IPCC 2007, Soja et al. 2007). The net carbon balance of Arctic ecosystems is highly sensitive to climate change, and may be affected by changing biome distributions, such as forest encroachment into tundra (ACIA 2004).
2
impacts on Arctic ecosystems. In the ACIA report, several climate change scenarios and dynamic vegetation models were used to predict changes in Arctic biome distributions, which will be critical to energy and carbon budgets in the Arctic. The relationship of these biome projections to empirical data on contemporary changes in the Arctic remains unexamined, leaving several open questions: Do ground data corroborate the patterns and types of change projected in the ACIA report? Which geographic areas are projected to undergo major changes, but contain particularly limited empirical data? Are there geographic areas where biome projections are counter-indicated by empirical data?
2. Background
2. 1.
Ecological Importance of the Arctic
Although the Arctic has been defined in many ways for different purposes (Olson et al. 2001) one definition, adopted by the Arctic Climate Impact Assessment (ACIA 2004) defines the Arctic as the region above 55°N latitude (Fig. 1). This region covers over 1.2 billion hectares, two-thirds of which lies in Eurasia, and the remainder in Canada and Alaska (Soja et al. 2007). Arctic forests vary regionally depending on climatology and biogeographic history. Depending on region they may be dominated by larch (Larix), pine (Pinus), spruce (Picea), fir (Abies), or birch (Betula), and more locally interspersed with aspen (Populus), willow (Salix) and alder (Alnus) following topographic insulae and disturbance. At the forest-tundra ecotone, where large trees give way to krummholz form and intergrade into tundra, larch, spruce, and pine are the dominant tree species found.
In addition to the carbon stored and assimilated by the vast expanses of Arctic forest, low temperatures and slow decomposition of organic matter breakdown result in large carbon stores on the ground and below the surface (Soja et al. 2007). Arctic regions have also experienced the largest temperature increases due to climate change in the 20th
4
Climate predictions indicate that the Arctic will continue to experience more rapid warming than other regions of the globe (IPCC 2007, Soja et al. 2007).
Climate change is known to cause changes in the distribution of vegetation types and biomes, with consequent changes in ecosystem function, including carbon storage, which are increasingly valued by society. Although the sensitivity of global temperatures to atmospheric CO2 concentration is uncertain, models accounting for a range of
sensitivities have predicted increases of 1.1 to 6.4°C in global average temperature by the year 2100 (IPCC 2007). In the Arctic, the predicted increase in average annual
temperature is even greater, at 2.8 to 7.8°C, with a winter warming of between 4.3 and 11.4°C (IPCC 2007).
Some ecosystem changes have already resulted from recent Arctic warming. Vegetation throughout the northern high latitudes greens earlier today than it did a century ago (Myneni et al. 1997), and climate envelopes characteristic of particular biomes have shifted, allowing for new establishment in previously cooler areas (Tape et al. 2006, Kapralov et al. 2006, Shiyatov et al. 2007). A major type of biome transition expected across much of the Arctic is from tundra to forest (ACIA 2004).
2. 2.
The Arctic Climate Impact Assessment (ACIA)
stated goal was to evaluate and synthesize knowledge on climate variability, climate change, and increased ultraviolet radiation and their consequences. The results of the assessment were released at the November 2004 ACIA International Scientific Symposium in Reykjavik, Iceland. The assessment is online at
http://www.acia.uaf.edu/pages/scientific.html.
Much research has been done to predict the effects of warming climate on Arctic vegetation this century by developing dynamic vegetation models (ACIA 2004). There has also been an effort to document signs of plant migration, or the increased growth and stand density increases that may be precursors to migration (Table A. 1. 1). However, to our knowledge there has not been an attempt to compare a comprehensive set of these empirical observations with dynamic vegetation model projections. In its description of projected vegetation changes for the year 2100, ACIA featured the use of two dynamic vegetation models. In this paper, I compare one of these models to a set of 30 published studies on Arctic vegetation response to climate change.
2. 3.
Research Objectives
6
promoted increased growth and establishment. If there are no signs, then either the model needs improvement, the observation lacked enough spatial resolution or temporal scope to observe change, or there may be time lags between climate forcing and vegetation change. If changes are occurring in places where the model did not predict change, then again this indicates opportunities for model improvement. All three cases provide
opportunities to assess our understanding of plant migration, by comparing where models predict change and where observations show it has already begun.
Performing this model validation research has required the assembly of as many observations as possible of recent plant spatial responses linked to Arctic climate change, so that these observations can be compared with model predictions. The observations are described in the upcoming literature review, along with a synthesis of their important points. Following this is a description of how these observations will be treated as data points for the purpose of assessing the accuracy of a key model from the Arctic Climate Impact Assessment, as well as an explanation for why this model was selected for this assessment.
3. Methods
3. 1.
Study System
Our study region includes land areas above 55°N latitude. This area contains Arctic treeline, as well as the study sites providing empirical data used in this research. The study region (Fig. 1) covers over 1.2 billion hectares of land area, two-thirds of which lies in Eurasia, with the remainder in Canada and Alaska (Soja et al. 2007). This area
contains most of the boreal forests, giving way to taiga and eventually tundra north of treeline, although there is interstitial mixing across these ecotones.
Arctic forests are dominated by coniferous genera, including the pines (Pinus spp.), spruces (Picea spp.), firs (Abies spp.), and larches (Larix spp.), and less frequently by deciduous broadleaved genera including the aspens (Populus spp.), birches (Betula spp.), willows (Salix spp.), and alders (Alnus spp.). In some conditions one or two of these taxa dominate over large areas, and in other places several taxa sort themselves into
The Arctic biomes cover a vast, nearly continuous, and relatively untrammeled expanse of Earth’s surface relative to other global biomes. Their ecosystems play a great role in Earth’s carbon budget in terms of both seasonal uptake and long-term carbon storage on and below the ground surface, due to low temperatures and slow
decomposition of organic matter (Soja et al. 2007). For example, boreal forests contain approximately 30-35% of global terrestrial ecosystem carbon storage (Soja et al. 2007). In addition, although sparsely populated, many inhabitants of the Arctic are highly dependent on the goods and services Arctic ecosystems provide (ACIA 2004), as is the earth system at large.
Arctic regions have also experienced the largest temperature increases due to climate change, with annual temperature increases up to 0.6-1.0°C (Beltrami and Mareschel 1991, Chapman and Walsh 1993, Kattenberg et al. 1996, Overpeck et al. 1997, Everett and Fitzharris 1998, Mann et al. 1999). Climate predictions indicate that the Arctic will continue to experience more rapid warming than other regions of the globe (Soja et al.
2007). Models accounting for a range of sensitivities have predicted an increase in average annual temperature of 2.8 to 7.8°C, with a winter warming of between 4.3 and 11.4°C (IPCC 2007).
3. 2.
The ACIA Biome Model
The Arctic Climate Impact Assessment made use of two dynamic vegetation models to project future changes in the areas of tundra and polar desert: LPJ and BIOME4. The BIOME4 projection was used for our analysis because it has a greater number of
10
This model was run under a relatively conservative equilibrium sensitivity of 2.5°C using the global climate model HadCM2-SUL, compared with a value of 3.3°C for HadCM3 which was used to provide climate data for the LPJ model. The GCM runs used to parameterize BIOME4 were forced using the IS92a greenhouse gas and sulfate aerosol concentration scenario for the 21st century (Kaplan et al. 2003) a widely adopted, but also relatively conservative emissions scenario.
BIOME4 is a coupled carbon and water flux model that predicts global steady-state vegetation distribution, structure, and biogeochemistry, and accounts for interactions between these aspects (Kaplan et al. 2003). Since it is a biome-level model and does not include species-specific demographics and dispersal, its predictions are of equilibrium vegetation distributions at any given time. The model receives as inputs long-term averages of monthly mean temperature, insolation, and precipitation, which can be provided by a GCM. Percolation rates and water-holding capacity are constrained using soil texture and depth.
3. 3.
Empirical Data
studies were excluded from this analysis because they reported generalized findings among multiple study sites, but no geo-coordinates for those sites (Wilmking et al. 2004, Sturm et al. 2001, Kullman 1989, Kharuk et al. 2005, Payette and Filion 1985). Of the remaining 30 studies, 12 included multiple study sites, totaling 76 sites all together. As a result, we had 95 geographic data points available for our analysis from the thirty studies. The analysis is based on these 95 study sites.
In order to standardize the varying information presented for different sites in the 30 papers, we developed a rubric for scoring study sites in terms of type and direction of change observed. Each study site was assigned a score in each of the following change categories: altitudinal migration, latitudinal/horizontal migration, tree growth, and stand density/abundance increase. For each category a +1 signifies migration in the direction expected from warming temperatures. A -1 signifies change in the direction opposite to that expected, and 0 is assigned when no change is reported.
12
There also were no study sites with both positive and negative changes in these four categories.
3. 4.
Comparison of Data to Model Predictions
Model predictions at study-site locations were also coded using the -1, 0, +1 scheme to determine where matches existed between predictions and observations. Of the nine possible combinations of data and model predictions, only three constitute matches (Table 1).
Table 1. Judging Matches from Possible Combinations of Data and Model Findings
For empirical data, evidence of forest range expansion, including observed increases in growth or density, or treeline migration, are indicated as 1. Evidence of range contraction (decreased growth or density, or treeline recession) is indicated as -1, and no change is indicated as 0. For model predictions, predicted forest advance is indicated as 1, forest contraction as -1, and no change is indicated as 0. A match between the empirical
observations at a study location and the projected change by 2100 occurs where empirical and projected indicators agree.
Data (Overall change) 1 1 1 0 0 0 -1 -1 -1 Model Prediction 1 0 -1 1 0 -1 1 0 -1
Match 1 0 0 0 1 0 0 0 1
observed in the data (false positive). The presence of a non-match at a study site would invalidate the model there, and too many such results throughout the Arctic would invalidate the model entirely.
As noted previously, twelve of the studies reported multiple findings for separate study sites, thus producing a nested data structure where not all studies were well
represented by a single match value, and where different sites within a study site were not spatially independent. In these cases, to account for the nested data structure in the
comparison procedure we used the proportion of matches out of all the sites within the study. We also did a second comparison by fitting a multilevel model that accounts for the nesting of multiple study sites within some of the 30 studies and that takes advantage of the fact that the match variable is binary. This will generate a single value between 0 and 1 that describes how well BIOME4 has performed in predicting the direction of change (if any) at all 30 study sites throughout the Arctic.
Since the match variable is binary and the study sites that contain match variables are nested within their respective studies, a generalized linear mixed effects model can be fit in order to give a probability that all study sites will yield perfect validation (a 1, vs. 0 for no validation). This probability can be treated as a measure of how well the model has performed across all study sites, taking into account the nested data structure.
4. Results
4. 1.
Summary of Empirical Studies
Of the 30 empirical studies included in this analysis, 25 reported one or more Arctic vegetation changes consistent with a warming-induced conversion from tundra to forest or shrubland (Table A. 1. 4). The most commonly observed type of change for all sites in these 30 studies was increased stand density, present at 41 of the 95 study sites (43%) (Table 2). The second most common change was increased tree growth, observed at 27 sites (28%). Upward altitudinal shift and northward latitudinal shift occurred at 16 and 8 of the study sites respectively (17% and 8%). The only negative changes were decreased tree growth at 14 study sites (15%), and a lowering of altitudinal treeline at 1 study site (1%).
Table 2. Frequency of Change Observations by Geographic Region
Summary of change observations by change type and geographic region indicating the frequency and percentage of studies reporting evidence consistent with forest range expansion, contraction, or no change. The last row shows the frequency of agreement between empirical observations and model predictions by region.
Canada Alaska Europe Siberia Total
The BIOME4 model predicts major northward shifts of treeline and shrub-dominated tundra (Fig. 2). These changes result in large reductions in area of cold deciduous forest
(larch-dominated) due to replacement by evergreen forests, and reductions in the area of
cushion forb, lichen, and moss tundra and graminoid and forb tundra. These predictions are consistent with the direction of change already observed at 64 of the 95 study sites (67%), which validate the model. The multilevel model used to account for all studies simultaneously, given the nested data structure, yielded a correspondence rate of 72.1 +/- 7% agreement between observed and predicted change (see Appendix 2 for complete model results and explanation).
4. 1. 1. North America
Two studies from Yukon Territory occurred at sites predicted by BIOME4 to undergo no vegetation change (Fig. 2). Of these studies, one (Szeicz and MacDonald 1995) reported no change, corresponding to the model prediction. The other (Danby and Hik 2007) found both canopy-cover and stand-density increases for P. glauca in the Yukon, with a limited amount of altitudinal shift compared to the other two changes. The model did predict vegetation change for a cluster of study sites in southern Nunavut, where abundance increases were found for P. glauca (MacDonald et al. 1998).
Seven studies were located on the eastern coast of Hudson Bay, at sites where BIOME4 projected vegetation changes from low-andhigh shrub tundra to cold
16
model predictions at only 3 of its 5 study sites. The last study (Masek 2001) was both observed and predicted to undergo no change, thus also validating the model. However, the lack of observed latitudinal shift or other vegetation change was likely due to the coarse resolution of the satellite imagery used in that study. The other six studies were implemented at finer, ground-level resolution.
Of the seven Hudson Bay studies, five reported either latitudinal shifts (Lavoie and Payette 1994, 1996; Lescop-Sinclair and Payette 1995), increased stem initiation (Lavoie and Payette 1992), or increased krummholz growth of P. mariana (Gamache and Payette 2004, Lescop-Sinclair and Payette 1995, Lavoie and Payette 1996). One study in this area, excluded from analysis due to insufficient geolocation information (Payette and Filion 1985) found an altitudinal shift of P. glauca treeline by several tens of meters over the past century. A neighboring six-site study of P. glauca in the northeastern Quebec-Labrador area (Payette 2007) found positive vegetation changes at 2 sites, no change at 3 sites, negative change at one site, and yielded only 50% agreement with model
predictions.
Sturm et al. (2001) and Tape et al. (2006) have documented widespread increases in shrub abundance, size, and extent on what is presently part of the erect dwarf shrub tundra of northern Alaska. These changes are consistent with the BIOME4 prediction of widespread conversion of erect dwarf shrub tundra across northern Alaska to cold
needleleaf evergreen forest. Sturm et al. (2001) also found increases in density and extent of P. glauca this region. Findings of forest expansion at another N. Alaska study site in
low- and high shrub tundra are also consistent with this prediction (Wilmking et al.
sites in the White Mountains and Alaska Range are also consistent with the transition from cold to cool evergreen needleleaf forest predicted by BIOME4 in these areas (Lloyd and Fastie 2002, 2003).
Reduced growth of P. glauca due to drought stress, reported by Barber et al. (2000) in the Alaskan interior, was considered a negative response to warming temperatures, inconsistent with model predictions of a change from cold to cool evergreen needleleaf forest. Nevertheless, a growth decline in P. glauca is not necessarily inconsistent with this model prediction, if it leads to future opportunities for increased establishment of
cool evergreen needleleaf forest species.
4. 1. 2. Europe
18
4. 1. 3. Siberia
For 6 of the 7 studies in Siberia, BIOME4 predictions indicated changes from low- and high shrub tundra to cold needleleaf evergreen forest. However, migration of deciduous Larix forests into tundra was almost universally found among these eight studies, and larch is often the only tree species at treeline. Nevertheless, we considered observations of these studies to be consistent with the direction of change predicted for these locations.
Larix species were reported advancing into low- and high shrub tundra in a series of studies across eastern Siberia (Esper and Schweingruber 2004, Kapralov et al. 2006, Kharuk et al. 2006, Shiyatov et al. 2007, Devi et al. 2008). There was also greater tree establishment (Esper and Schweingruber 2004, Hantemirov et al. 2008), increased stand density (Mazepa 2005, Hantemirov et al. 2008), and increased tree growth (Kapralov et al. 1996, Mazepa 2005, Devi et al. 2008) in some areas. These are all positive responses suggestive of continuing advancement of the Larix-dominated cold deciduous forest into the tundra.
Although cold needleleaf evergreen forest is predicted as the future vegetation type for all but one study site (Kapralov et al. 1996), only two studies found increased growth or migration of any evergreen species (Esper and Schweingruber 2004, Kapralov et al.
1996). In a study documenting evergreen conifer invasion into the Siberian
5. Discussion
There are several plausible explanations for lack of observable change in locations that are predicted to have changed by 2100. The simplest is that predicted changes have not begun yet to appear. Secondly, the model predictions are at a crude resolution relative to data collected for the field studies, and completely ignore local processes that can influence the vegetation found at particular sites. At half-degree resolution, geolocation errors ranged from zero to potentially half a degree, which could cause poor agreement between model and data near biome boundaries. In some cases change may be occurring but has gone undetected in the field, and treeline areas that are experiencing stand density increases could be in the first stages of migration, and will do so if suitable climatic conditions persist long enough for dispersal, germination and survival in suitable sites. Lastly, there can be some factor preventing change, such as warming-induced drought stress or time lags between climate forcing and migration, or transition episodes may require trigger events such as fire.
5. 1.
Water Availability
insufficient precipitation may be a cause (Briffa et al. 1998, Barber et al. 2000, D’Arrigo
et al. 2004, Piao et al. 2006).
In the Alaskan interior, Barber et al. (2000) found a drought stress-linked growth decline in P. glauca, which may be an important factor in boreal forest CO2 uptake, given the widespread distribution of this species. Using tree-ring data from a pan-Arctic
network of sites, Briffa et al. (1998) found growth suppression in the second half of the 20th century across the Arctic, with the exception of Alaska and northern Europe. Between the periods 1935-45 and 1975-85, they found a sudden decoupling of tree ring density and air temperatures across hundreds of Arctic study sites (Briffa et al. 1998). Although the authors argue against a simple soil moisture-related explanation for reduced tree growth they did not rule out summer drought sensitivity. The pan-Arctic
synchronicity of tree growth declines argues against local-scale influences such as disease as primary mechanisms of this phenomenon. Briffa et al. (1998) also suggest higher UV-B levels, decreased solar radiation, increased acidic deposition, and increased tropospheric ozone as potential causes of declines in tree growth.
Growth declines could also be caused by warming temperatures exceeding optimal physiological conditions. However, warmer temperatures have been found to have little effect on plant survival as long as ample water is available (Woodward 1988).
22
D’Arrigo et al. (2004) also found a post-1960s weakening in the relationship between
P. glauca tree ring width and temperature, and a concurrent decline in tree growth. They suggest that even at tree line, tree growth may decline when temperatures warm beyond a physiological threshold without significant gains in precipitation. This may lead to a reversal of the large-scale greening seen in recent decades, and the resulting browning could slow or reverse boreal forest carbon uptake.
Piao et al. (2006) conducted a modeling study that lends support and insight to possible drought impacts on Arctic biome transitions. Their analysis incorporated a dynamic global vegetation model (ORCHIDEE) that simulates global carbon and water cycles. The LAI trends of their model over the past 20 years were consistent with widespread reports of enhanced Arctic plant growth during that time, and demonstrate that warming temperatures were the likely drivers of this greening trend at high latitudes (Piao et al. 2006). However, subsequent calculations based on their model results indicated that the effects of warmer temperatures on vegetation growth depend partly on the balance between the positive effect of growing season extension and the negative effect of soil moisture stress. Piao et al. (2006) suggest that under increasing
temperatures, dry and warm conditions will lead to growth decline whereas wet and cool areas will tend to have the largest increases in vegetation growth.
Warming-induced drought stress could potentially cause the Arctic to switch from a carbon source to a sink. Between 1985 and 1991, Angert et al. (2005) found an
5. 2.
Time Lags
Climate limitations exist for all plants, and in part define the boundaries of their fundamental niche. If suitable conditions for a species’ recruitment and survival exist within the dispersal field of its present range boundary, the null expectation is that migration and range changes would take place. However, there are many factors that introduce time lags between climate forcing and migration, possibly explaining why migrations are not presently observable in some locations despite a century-long history of global warming.
Time lags between contemporary climate forcing and boreal tree migration of up to 150 years (Masek 2001, MacDonald et al. 1993) are known, and longer-lived trees are expected to respond more slowly and indirectly to climate changes compared to shorter-lived plant species (Clark 1991, Zasada et al. 1992, Graumlich and Brubaker 1995, and Sirois 1997). Cold temperatures at treeline also limit the production of viable seeds, so that when warmer years come, insufficient seed may be available to support increases in tree establishment (Lloyd and Fastie 2002).
Perhaps most importantly, it takes time for the suitable conditions for dispersal and recruitment to come together in sufficient density to form migration. For example, the environmental conditions necessary for germination and juvenile survival may be
24
ecological assembly at play that delay migration. For example, nitrogen-fixing species may need to recruit into nutrient poor sites such as newly deglaciated tundra before trees can colonize. The level of soil development and water-retaining capacity can also delay migration (Pennington 1986). For example, in areas underlain by permafrost, there may be a delay in tree establishment until air temperatures warm enough to thaw sufficient permafrost for root activity (Lloyd and Fastie 2002).
In other cases, migration may be dispersal-limited. For example, Shiyatov et al.
(2007) showed that larch seeds at a site in the Polar Urals are carried by wind no farther than 40-60 m from maternal plants due to their heaviness, and are retained in the soil litter after settling. Thus, in distant tundra areas with few trees, larch establishment into denser tree stands takes time. Complex topography is another dispersal-limiting factor. In a modeling study, Rupp et al. (2001) found that white spruce would take 3000-4000 years to disperse across the Brooks Range to the currently treeless North Slope of Alaska, in response to a climate warming of 6°C. Glacial lakes and ridges, and thermokarsts, the physiographic transformations associated with melting of frozen ground, are other barriers to dispersal related to terrain, as described by Masek (2001) during his work in northern Canada. Human-modified, fragmented landscapes also potentially constrain dispersal (Honnay et al. 2002).
5. 3.
Episodic Events
half of the 20th century drought stress slowed establishment in some areas (Briffa et al.
1998, Barber et al. 2000, D’Arrigo et al. 2004, Piao et al. 2006).
Migration episodes may also be triggered by events that remove ecological constraints, such as resource competition, that interfere with range expansion. For example, trees at treeline may respond slowly to warming if they face competition from faster-responding tundra plants that limit successful tree seedling establishment (Lloyd and Fastie 2002). Given a sufficient disturbance, the treeline may experience competitive release and migration may then proceed rapidly (Lloyd and Fastie 2002). Disturbance events of many kinds are known to trigger competitive release by temporarily relaxing ecological constraints to successful establishment. This has been shown for gap formation from windthrow or disease, fire, drought, wetness anomalies, or other extreme weather or climate events that can remove competitors from part of the landscape (Racine et al.
1987) or change the competitive balance (Landhausser and Wein 1993, Cater and Chapin 2000) Such events have been important in past episodes of climate change-driven plant migration (Parshall 2002, Szeicz and MacDonald 1995, Pearson 2006) and they are likely also to be important in the present episode.
5. 4.
Regional Variability
26
forest type in Siberia (Soja et al. 2007). Fire is likely to increase in boreal forests with climate warming (Soja et al. 2007), so this mechanism may promote the migration of evergreen needleleaf forest into the deciduous needleleaf forest which is presently encroaching into tundra across western Siberia (Kharuk et al. 2005).
Areas in the Yukon and Labrador regions of Canada (Danby and Hik 2007, Payette 2007) are undergoing apparent climate-related changes in areas where none are predicted, while areas in the Alaskan interior (Barber et al. 2000, Lloyd and Fastie 2002) are
undergoing apparent drought induced changes that are contrary to expected trajectories of change. Both of these scenarios imply that models of biome change are not accounting for, or are not capturing regional scale variability, in certain forcing mechanisms.
The eastern coast of Hudson Bay, northwestern Canada, montane and northern Alaska, the Scandes Mountains of Europe, and the Polar Ural Mountains have been focal areas for studies of plant migration (Fig. 2). However, there are two regions where major changes are predicted, but field studies are few or absent (Fig. 3). Eastern Siberia is currently dominated by low- and high shrub tundra, where isolated pockets of larch forest could exist and could be expanding. This region is predicted to transition to cold evergreen needleleaf forest. The area largely encompassed by Nunavut, which contains the Arctic Archipelago extending through the Northwest Passage between mainland Canada and northern Greenland, is predicted to experience a major northward
5. 5.
Rates of Migration
6. Conclusion
It is inevitable that the ability of plants to track climate change will vary both geographically and taxonomically, and in some cases will be contingent upon trigger events such as humid periods or fire. It is not expected that ecosystems will shift en toto, nor that predicted patterns at the global scale would necessarily match those found on the ground now or in 2100. In many cases actual changes may constitute a reordering from within and across existing ecosystems to produce novel ecosystems whose composition and function differ from current ecosystems (Williams and Jackson 2007). Such
reorganization could place evolutionarily significant selective pressure on some taxa at shifting ecotones (Thomas et al. 2004).
29
Appendix 1: Supplementary Tables
Table A. 1. 1. Empirical Observations of Arctic Plant Migration and Related Changes
Asterisks indicate the 5 of 35 studies that were excluded from analysis because they offered generalized findings among multiple study sites without geo-coordinates for those sites.
Alaska – 8 studies, 2 excluded
Study Location Species Shift Amount Time Cause Suggested
Barber et al. 2000 Interior Alaska Picea glauca Reduced growth -- 20th century Temperature-induced drought stress
Lloyd and Fastie 2002
Twelve sites in the White Mtns, Alaska Mtns, and Seward Peninsula
Picea glauca Tree growth changes Increased tree growth on 9 of 12 sites prior to 1950
Reconstruction since 1800
Warmer temperatures after 1950 associated with decreased tree growth in all but the Alaska Range sites; water stress believed to be a cause for the growth decline Lloyd and Fastie
2003
Seven sites in the White and Alaska Mountain ranges, interior Alaska
Picea glauca Stand density increases and altitudinal migration at most sites
Density increases from <5 trees/ha to >15 trees/ha
Reconstruction since 1800
>1.5 degree C warming since mid 1800s. Positive stand density-summer temperature relationship at all Alaska Range sites; at White Mountains sites, all positive correlations except one site with zero and one with inverse correlation. *Sturm et al. 2001 Alaskan Arctic, between
the Brooks Range and the Arctic coast
Betula nana, Salix spp., Alnus crispa, Picea glauca
Shrub abundance increase; extent and density increases of white spruce forest
-- 1948-50 to
1999-2000 Warming over past 150 years that has accelerated in the past 30
Suarez et al. 1999 Noatak National Preserve, NW Alaska
Picea glauca Latitudinal shift and increased stand densities
80-100 m Past 150 years Warmer climate
Tape et al. 2006 Northern Alaska and
Pan-Arctic Betula, Salix, Alnus spp. Shrub expansion in size, abundance, and extent Varies by landscape type 1983-2004 Warming Arctic climate *Wilmking et al.
2004
Brooks and Alaskan Ranges
Picea glauca Variable growth responses to climate warming
Growth varies by season studied
20th century Growth response varies for higher
spring and summer temperatures Wilmking et al.
2006
NW Alaska (68°060’N, 161°400’W)
Picea glauca Forest area expansion 62-72% expansion
30
Canada – 13 studies, 1 excluded
Study Location Species Shift Amount Time Cause Suggested
Danby and Hik 2007 Kluane Ranges, SW Yukon,
Canada Picea glauca Mostly canopy cover and stand density increases, limited altitudinal shift
-- 1947-48 to 1989 Warmer temperatures (0.5 degrees C over past 100 years)
Gamache and Payette 2004
East coast of Hudson Bay, Canada
Picea mariana Acceleration in height growth of trees <2.5 m
0.5-1 m above previous levels
1970s to 1998 Primarily longer growing degree days, secondarily an earlier snowmelt. Lavoie and Payette
1992 Boniface River area (57°45’N, 76°20’W), in subarctic Quebec, Canada
Picea mariana Increased stem initiation Supranival stem number increase from 1880, peaking in 1930-35, decreasing after 1955
Study done in 1989; reconstruction of past 400 yr
Warmer summers, milder and snowier winters (snow provides increased insulation from freezing winds)
Lavoie and Payette 1994
East coast of Hudson Bay, Canada
Picea mariana Latitudinal 4 km northward Since late 1800s Milder winter conditions
Lavoie and Payette 1996
East coast of Hudson Bay, Canada
Picea mariana Latitudinal shift from krummholz growth
Approx. 4 km Little Ice Age to 1990s
Recent warming temperatures
Lescop-Sinclair and
Payette 1995 Eastern coast of Hudson Bay, Canada, from 56°52'46N 76°17'04W to 57°55'18N 76°41'46W
Picea mariana Latitudinal, toward Hudson Bay; krummholz growth, no establishment
12 km toward
Hudson Bay 1992; tree establishment from late 1800s (Little Ice Age)
Warming temperatures
MacDonald et al. 1998
Nunavut, Canada Picea glauca, Picea mariana
No latitudinal shift but abundance increase
none 1880-1987 Warming temps help recruitment, but seed dispersal of spruces limited
Masek 2001 Canada - east coast of Hudson Bay; Great Slave Lake, NW Territories
Picea mariana No latitudinal shift <200-300 m/ century
1972-2001 --
Payette 2007 Northern Labrador, Canada Picea glauca Altitudinal/latitudinal shifts, growth declines at some sites
-- Last half of 20th
century
Warmer growing season temperatures
*Payette and Filion 1985
East coast of Hudson Bay, Canada
Picea glauca No latitudinal but altitudinal shift
Several tens of meters
Last century --
Pereg and Payette 1998
East of Hudson Bay, Canada (57°45’N 76°20’W)
Picea mariana Increased krummholz growth
Increases in stem initiation began in 1940s, peaking during the 1970s
Since 1890s Warmer winters, more precipitation
Scott et al. 1987 Northern Manitoba, Canada Picea glauca Latitudinal migration and density increases
-- Little Ice Age to
1980s
Climatic warming
Szeicz and
MacDonald 1995 NW Canada Picea glauca No latitudinal shift or re-establishment of old stands
-- 200 years ago to
31
Europe – 6 studies, 1 excluded
Study Location Species Shift Amount Time Cause Suggested
Hofgaard et al. 1991 Mt. Blaikfjället, east of the Scandes Mtns in N. Sweden (64°40’N, 15°50’E)
Picea abies Increased growth after severe cold damage
69% of tops had increased regernation (2% unchanged, 29% shorter)
1938-1988 Warming temperatures
Klanderud and Birks 2003 Jotunheimen Mountains,
Central Norway (61°N) All vascular plants (~100) Altitudinal 73.2% of all species recorded had range expansions
1930-31 to 1998 Recent climatic changes, specifically warming (0.4-1.2°C in past 100 years)
*Kullman 1989 Southern Swedish Scandes Betula pubescens ssp. tortuosa
Growth decline, recession
16% decline in trees >2m, trees to krummholz
1972-1986 Recent climatic cooling and delayed thawing
Kullman 1991 Mt. Välliste in the Northern Swedish Scandes (63°17’N, 13°14’E)
Pinus sylvestris, Picea abies Growth decline, recession
-- 1949-1987 Recent climatic cooling
Kullman 1996 Handolan Valley of the southern Swedish Scandes (63°12’N, 12°23’E)
Old-growth Picea abies Growth decline,
recession Rate of needle loss is 2.69% per year
1974-1994 Cooler climate since the late 1930s followed by very cold winters after the 1960s; complete stem loss projected for 2003 if temperatures do not warm
Kullman 2001 Swedish Scandes Betula pubescens ssp. tortuosa, Pinus sylvestris, Picea abies, and the grass Deschampsia flexuosa
Altitudinal migration and density increases
Mostly 30-50 m;
max. 120-165 m Between late 19
th
and 20th centuries Earlier, more complete snowmelt due to 0.8°C / century warming, soil
32
Siberia – 8 studies, 1 excluded
Study Location Species Shift Amount Time Cause Suggested
Devi et al. 2008 Polar Urals treeline Larix sibirica Expanding forests, taller
growth forms Upward by 20-60 m; 90% new seedlings after 1950 upright in growth form
1960 to 2007 0.9°C summer warming and doubling of winter precipitation Esper and Schweingruber 2004 Nine trans-Siberian study sites Larix species, Pinus sibirica, Picea obovata Altitudinal migration and greater tree establishment
Pulses of tree
establishment in 1940s-50s and again in 1970s
1940s and 1950s and after the early 1970s
Warming temperatures, suggested to be part of a circumpolar trend based on comparisons with other studies
Hantemirov et al. 2008
Northern timberline of Yamal Peninsula, Russia
Larix sibirica Greater tree establishment
Pulses of tree establishment in 1900-1935 and 1950-1970
1880-1980 Warmer July air temperatures
Kapralov et al. 2006 Northern Ural Mountains (59°30'-59°40'N, 59°00'-59°20'E)
Variety of tree species (L. sibirica, P. sibirica, B. tortuosa) Altitudinal and horizontal range expansions; crown density increase, tree species changing in land area dominance
Average of 31 m altitudinal shift, 113 m horizontal shift, and 11% increase in crown density
1956-2005 Climate warming and increased humidity: over the past 40 years, summer temperature and precipitation increases have been 0.4°C and 72 mm, respectively, and the winter temperature and preciptation increases have been 2.0°C and 105 mm, respectively
*Kharuk et al. 2005 Middle Siberian Plateau, near Yenisei Ridge Evergreen conifers (primarily P. sibirica) into larch zone
Range expansion via new establishment; stand density increases in forest/tundra ecotone; larch spreading into the tundra zone
70 years post fire, larch abundance went from 100% to 10%; P. sibirica abundance from 0 to nearly 80%
2001-2003 Warming temperatures
Kharuk et al. 2006 Ary-Mas forest, northern Siberia (from 72°02'-72°40'N to 101°15'-102°06'E) Larch forest (Larix gmelinii, Larix sibirica )
Increased canopy cover; 65% abundance increase; altitudinal shift
65% increase in closeness of larch canopy; larch into tundra expansion by 3-11 m/year
1973-2000 Primarily warmer winter temperatures (cold from 1948-1972, but then warmed, which later increased seedling survival). Correlation between density of young tree growth and summer air temperature
Mazepa 2005 25 mapped sites in the Polar Ural Mountains (66°48'57''N, 65°34'09''E)
Larix sibirica Stand density and stem growth increases
2-5x increase in stem growth volume; up to 1-3.5x increase in stand density
1960-62 to 1999-2001
Warmer summer temperatures and earlier growing seasons
Shiyatov et al. 2007 Polar Urals Larix sibirica Altitudinal and latitudinal
26-35 m rise in elevation; 290-520 m horizontal shift
20th century
(1910s-2000s)
33
Table A. 1. 2. Non-Arctic Observations of Plant Migration and Related Changes
These 31 studies were not used in the analysis presented in this paper, but are listed to provide a more global view of vegetation changes.
Study Location Species Shift Amount Time Cause Suggested
Alward et al. 1999
Northeast Colorado exotic forb and C3 grass Sitanion hystrix increase; dominant C4 grass and C3 forbs decrease
Abundance increases and decreases
-- 1983-1999 Seasonal increases in Tmin, decline of
dominant species
Brink 1959 Garibaldi National Park, British Columbia coast
Abies lasiocarpa and Tsuga mertensiana
Altitudinal -- ~1900-1959 Diminished snow cover (warmer
temperatures) Camarero and
Gutierrez 2004
Spanish Pyrenees Pinus uncinata increased tree size and density; variable altitudinal shift with time
-- data from
1750-1997
Warmer mean annual temperatures, warmer springs; interannual variability in mean temperature
Cannone et al. 2007
Italian Alps alpine grasslands and shrub communities
Altitudinal 1.9% cover increase per decade
1950-2003 1°C regional temperature increase, variable precipitation increase, and decrease in snow cover duration/thickness Coop and
Givnish 2007
Valles Caldera, New Mexico
multiple tree species; mostly Pinus ponderosa
Range expansion into meadow
18% decline in grassland area
1935-1996 Warmer minimum summer temperatures
Franklin et al. 1971
Cascade Range, Washington-Oregon
Abies lasiocarpa, Tsuga mertensiana, Larix lyalli
Range expansion into meadow
-- Establishment in
1923-1944
--
Grabherr et al. 1994
Austrian and Swiss Alps multiple plant species Altitudinal Average of 0.4 m/yr for 9 alpine plants
20th century 0.7°C increase in mean annual temperature
Hamburg and Cogbill 1988
Central New Hampshire Red spruce Abundance decline -- Past 180
years
Warmer mean annual and summer temperatures
Hampe 2005 Southern Spain Frangula alnus Reproductive decline near southern range limit
-- Years 2000
and 2001
Warmer and drier conditions over the past century affecting a critical late-season reproductive period
van Herk et al. 2002
Netherlands 329 lichen species Abundance decline and range expansion
Decline in 50% of alpine spp, expansion in 83% of subtropical spp.
1979-2001 Temperature, pollution, nutrient demand
Hessl and Baker 1997
Rocky Mountain National Park, Colorado,
Picea engelmannii, Abies lasiocarpa
Altitudinal -- 1930-1997 Intermediate (optimal) warmer/wetter
conditions - too warm and no establishment occurs Holzinger et al.
2008
Eastern Swiss Alps 70 plant species Altitudinal 11% increase in species richness per decade
Past 120 years Warming temperatures Jakubos and Romme 1993 Yellowstone National Park, Wyoming
Pinus contorta Range expansion into meadow
34
Jump et al. 2006 Mediterranean region of Spain
Fagus sylvatica Growth decline at southern range limit
Basal area increment decline of 49% at lower elevations; higher elevations unaffected
1975-2003 Regional warming trend
Kearney 1982 Jasper National Park, Canada
Abies lasiocarpa, Picea engelmannii, Pinus contorta
Altitudinal -- Establishment
in 1965-1973
Above average mean summer temperature
Klasner and Fagre 2002
Glacier National Park, Montana
Abies lasiocarpa Altitudinal, krummholz growth, density increase
3.4% increase in forest area over 46 years
1945-1991 --
Lavergne et al.
2006 Mediterranean region of France 2100 plant species Abundance declines Regression or extinction of Eurosiberian species 1886-2001 Regional southern range limits of Eurosiberian spp. warming negatively affecting Millar et al. 2004 Upper elevation forests
of the central Sierra Nevada, California
Pinus spp. Altitudinal migration and krummholz growth
-- between 1880
and 2002
Minimum temperature increase
Meshinev et al.
2000 Bulgaria Pinus peuce Altitudinal Establishment 300 m above previous treeline 1970-1999 Warming Parolo and Rossi
2008
Rhaetian Alps, Northern Italy
166 plant species Altitudinal Species richness increase from 153 to 166; median migration rate of 23.9 m/decade.
1926-2003 Mean air temperature increase of 1.6°C in summer and 1.1°C in winter during the last 50 years
Pauli et al. 2007 Austrian Alps 54 plant species Altitudinal 11.8% mean increase in species richness
1994-2004 Warming of 0.8°C between 1980-2004
Peñuelas et al. 2007
Montseny Mountains (Catalonia, NE Spain)
Fagus sylvatica, Quercus ilex
Altitudinal Beech migration 70 m upward; replacement by oak at lower range limit
1910-2003 ~1.5°C average annual temperature increase since 1950
Peñuelas and Boada 2003
Montseny Mountains (Catalonia, NE Spain)
Fagus sylvatica, Quercus ilex
Altitudinal Beech migration 70 m in the past 55 yrs
1940-2001 1.2-1.4°C temperature increase since 1950
Peterson et al. 1994
North Cascade
Mountains, Washington
Abies lasiocarpa, Picea engelmannii, Larix lyallii
Increased growth -- -- Warming
Sanz-Elorza et al. 2003
Central Iberian Peninsula Juniperus communis ssp. alpina and Cytisus oromediterraneus
Altitudinal -- 1957-1991 Significantly higher Tmin and Tmax, fewer
snow cover days, redistributions in monthly rainfall
Smith 1994, Fowbert and Smith 1994
Antarctica only two native Antarctic vascular plant species
Range expansion, abundance increase
5-fold rise in C. quitensis, 25-fold rise in D. antarctica
1964-1990 Warming summer temperatures and longer growing seasons since late 1940s
Taylor 1995 Lassen Volcanic National Park, California
Tsuga mertensiana Abundance increase -- since mid 1800s
Longer snow-free growing season length; warmer annual and summer temperatures
Walther et al.
2005 Swiss Alps Multiple plant species Altitudinal Accelerating altitudinal shift; mean shift of 27.8 ± 14.6 m/decade
1905-2003 Warming
Wardle and Coleman 1992
New Zealand 4 native tree species Altitudinal -- 1930-1991 Warming
Woodward et al.
35
Table A. 1. 3. Correspondence between Predictions and Observations, by Study Site
This table provides correspondences between BIOME4 2100 predictions and observed changes in the 95 study sites included in the 30 studies analyzed, by study site. See Methods for more detailed scoring information about how change values for sites were
determined. For studies with multiple sites, the final column provides a summary of the match information over all sites in the study.
Region Study
Type Species Site # Site Name
Alt M
ig
Lat Mig Growt
h Densi ty Ch ang e Mo del Mat ch St ud y R es ul t
Alaska Barber et al. 2000 M Picea glauca 1 Barber et al. 2000 0 0 -1 0 -1 0 0 0.00
Alaska Barber et al. 2000 M Picea glauca 2 Barber et al. 2000 0 0 -1 0 -1 0 0 ‘’
Alaska Barber et al. 2000 M Picea glauca 3 Barber et al. 2000 0 0 -1 0 -1 0 0 ‘’
Alaska Barber et al. 2000 M Picea glauca 4 Barber et al. 2000 0 0 -1 0 -1 1 0 ‘’
Alaska Barber et al. 2000 S Picea glauca 0 Barber et al. 2000 0 0 -1 0 -1 0 0 0.00
Alaska Lloyd and Fastie 2002 M Picea glauca 1 AR-Canyon Creek 0 0 1 0 1 1 1 0.50
Alaska Lloyd and Fastie 2002 M Picea glauca 2 AR-Monahan Flats 0 0 1 0 1 1 1 ‘’
Alaska Lloyd and Fastie 2002 M Picea glauca 3 AR-Usibelli-Treeline 0 0 0 0 0 1 0 ‘’
Alaska Lloyd and Fastie 2002 M Picea glauca 4 AR-Usibelli-Below 0 0 1 0 1 1 1 ‘’
Alaska Lloyd and Fastie 2002 M Picea glauca 5 SP-Bank 0 0 -1 0 -1 -1 1 ‘’
Alaska Lloyd and Fastie 2002 M Picea glauca 6 SP-Grasshopper Hill 0 0 -1 0 -1 -1 1 ‘’
Alaska Lloyd and Fastie 2002 M Picea glauca 7 WM-Eagle Summit-T 0 0 1 0 1 1 1 ‘’
Alaska Lloyd and Fastie 2002 M Picea glauca 8 WM-Eagle Summit-B 0 0 -1 0 -1 1 0 ‘’
Alaska Lloyd and Fastie 2002 M Picea glauca 9 WM-Nome Creek-T 0 0 0 0 0 1 0 ‘’
Alaska Lloyd and Fastie 2002 M Picea glauca 10 WM-Nome Creek-B 0 0 -1 0 -1 1 0 ‘’
Alaska Lloyd and Fastie 2002 M Picea glauca 11 WM-Twelvemile Summit-T 0 0 -1 0 -1 0 0 ‘’
Alaska Lloyd and Fastie 2002 M Picea glauca 12 WM-Twelvemile Summit-B 0 0 -1 0 -1 0 0 ‘’
Alaska Lloyd and Fastie 2003 M Picea glauca 1 WM-Eagle Summit 1 0 0 1 1 1 1 0.86
Alaska Lloyd and Fastie 2003 M Picea glauca 2 WM-Twelvemile Summit 1 0 0 1 1 0 0 ‘’
Alaska Lloyd and Fastie 2003 M Picea glauca 3 WM-Nome Creek 1 0 0 1 1 1 1 ‘’
Alaska Lloyd and Fastie 2003 M Picea glauca 4 AR-Usibelli 1 0 0 1 1 1 1 ‘’
Alaska Lloyd and Fastie 2003 M Picea glauca 5 AR-Monahan Flats 1 0 0 1 1 1 1 ‘’
Alaska Lloyd and Fastie 2003 M Picea glauca 6 AR-Canyon Creek 1 0 0 1 1 1 1 ‘’
Alaska Lloyd and Fastie 2003 M Picea glauca 7 AR-Wrangell View 1 0 0 1 1 1 1 ‘’
Alaska Suarez et al. 1999 S Picea glauca 0 Suarez et al. 1999 0 1 0 1 1 1 1 1.00
Alaska Tape et al. 2006 M Betula, Salix, Alnus spp. 1 Anaktuvuk S 0 0 0 1 1 1 1 0.67
36
Alaska Tape et al. 2006 M Betula, Salix, Alnus spp. 3 Atigun Gorge 0 0 0 1 1 0 0 ‘’
Alaska Tape et al. 2006 M Betula, Salix, Alnus spp. 4 Ayiyak 0 0 0 1 1 1 1 ‘’
Alaska Tape et al. 2006 M Betula, Salix, Alnus spp. 5 Chandler 0 0 0 1 1 1 1 ‘’
Alaska Tape et al. 2006 M Betula, Salix, Alnus spp. 6 Colville W 0 0 0 1 1 1 1 ‘’
Alaska Tape et al. 2006 M Betula, Salix, Alnus spp. 7 Colville 0 0 0 1 1 1 1 ‘’
Alaska Tape et al. 2006 M Betula, Salix, Alnus spp. 8 Colville E 0 0 0 1 1 1 1 ‘’
Alaska Tape et al. 2006 M Betula, Salix, Alnus spp. 9 Itigaknit 0 0 0 1 1 0 0 ‘’
Alaska Tape et al. 2006 M Betula, Salix, Alnus spp. 10 Ivishak 0 0 0 1 1 0 0 ‘’
Alaska Tape et al. 2006 M Betula, Salix, Alnus spp. 11 Killik 0 0 0 1 1 0 0 ‘’
Alaska Tape et al. 2006 M Betula, Salix, Alnus spp. 12 Kokolik 0 0 0 1 1 1 1 ‘’
Alaska Tape et al. 2006 M Betula, Salix, Alnus spp. 13 Kugururok 0 0 0 1 1 1 1 ‘’
Alaska Tape et al. 2006 M Betula, Salix, Alnus spp. 14 Kurupa 0 0 0 1 1 1 1 ‘’
Alaska Tape et al. 2006 M Betula, Salix, Alnus spp. 15 Lupine 0 0 0 1 1 -1 0 ‘’
Alaska Tape et al. 2006 M Betula, Salix, Alnus spp. 16 Nanushuk S 0 0 0 1 1 1 1 ‘’
Alaska Tape et al. 2006 M Betula, Salix, Alnus spp. 17 Nanushuk N 0 0 0 1 1 1 1 ‘’
Alaska Tape et al. 2006 M Betula, Salix, Alnus spp. 18 Nigu 0 0 0 1 1 0 0 ‘’
Alaska Tape et al. 2006 M Betula, Salix, Alnus spp. 19 Namiuktuk 0 0 0 1 1 1 1 ‘’
Alaska Tape et al. 2006 M Betula, Salix, Alnus spp. 20 Oolamnagavik 0 0 0 1 1 1 1 ‘’
Alaska Tape et al. 2006 M Betula, Salix, Alnus spp. 21 Sagavanirktok 0 0 0 1 1 -1 0 ‘’
Alaska Wilmking et al. 2006 S Picea glauca 0 Wilmking et al. 2006 0 1 0 0 1 1 1 1.00
Canada Danby and Hik 2007 S Picea glauca 0 Danby and Hik 2007 0 0 1 1 1 0 0 0.00
Canada Gamache and Payette 2004 M Picea mariana 1 PB 0 0 1 0 1 0 0 0.60
Canada Gamache and Payette 2004 M Picea mariana 2 EC 0 0 1 0 1 0 0 ‘’
Canada Gamache and Payette 2004 M Picea mariana 3 LM 0 0 1 0 1 1 1 ‘’
Canada Gamache and Payette 2004 M Picea mariana 4 RI 0 0 1 0 1 1 1 ‘’
Canada Gamache and Payette 2004 M Picea mariana 5 LC 0 0 1 0 1 1 1 ‘’
Canada Lavoie and Payette 1992 S Picea mariana 0 Lavoie and Payette 1992 0 0 1 0 1 1 1 1.00
Canada Lavoie and Payette 1994 S Picea mariana 0 Lavoie and Payette 1994 0 0 1 0 1 1 1 1.00
Canada Lavoie and Payette 1996 S Picea mariana 0 Lavoie and Payette 1996 0 1 0 0 1 1 1 1.00
Canada Lescop-Sinclair and Payette 1995 S Picea mariana 0 Lescop-Sinclair and Payette 1995 0 1 1 0 1 1 1 1.00
Canada MacDonald et al. 1998 S Picea glauca, Picea mariana 0 MacDonald et al. 1998 0 0 0 1 1 1 1 1.00
Canada MacDonald et al. 1998 S Picea glauca, Picea mariana 0 0 0 0 1 1 1 1 1.00
Canada MacDonald et al. 1998 S Picea glauca, Picea mariana 0 0 0 0 1 1 1 1 1.00
Canada MacDonald et al. 1998 S Picea glauca, Picea mariana 0 0 0 0 1 1 1 1 1.00
Canada MacDonald et al. 1998 S Picea glauca, Picea mariana 0 0 0 0 1 1 1 1 1.00
Canada MacDonald et al. 1998 S Picea glauca, Picea mariana 0 0 0 0 1 1 1 1 1.00
Canada MacDonald et al. 1998 S Picea glauca, Picea mariana 0 0 0 0 1 1 1 1 1.00
Canada Masek 2001 M Picea mariana 1
Richmond Gulf Region,
Quebec 0 0 0 0 0 0 1 1.00
Canada Masek 2001 M Picea mariana 2 Great Slave Lake, NWT 0 0 0 0 0 0 1 ‘’
Canada Payette 2007 M Picea glauca 1 Napaktok 0 1 0 0 1 1 1 0.50
Canada Payette 2007 M Picea glauca 2 Okak 1 0 0 0 1 0 0 ‘’
Canada Payette 2007 M Picea glauca 3 Eli-Vincent 0 0 0 0 0 0 1 ‘’
Canada Payette 2007 M Picea glauca 4 Hutte-Sauvage 0 0 0 0 0 0 1 ‘’
37
Canada Payette 2007 M Picea glauca 6 Qairajutait 0 0 0 0 0 1 0 ‘’
Canada Pereg and Payette 1998 S Picea mariana 0 Pereg and Payette 1998 0 0 1 0 1 1 1 1.00
Canada Scott et al. 1987 S Picea glauca 0 Scott et al. 1987 0 1 0 1 1 0 0 0.00
Canada Szeicz and Macdonald 1995 M Picea glauca 0 Szeicz and Macdonald 1995 0 0 0 0 0 0 1 1.00
Europe Hofgaard et al. 1991 S Picea abies 0 Hofgaard et al. 1991 0 0 1 0 1 1 1 1.00
Europe Klanderud and Birks 2003 S All vascular plants 0 Klanderud and Birks 2003 1 0 0 0 1 1 1 1.00
Europe Kullman 1991 S Pinus sylvestris, Picea abies 0 Kullman 1991 0 0 -1 0 -1 0 0 0.00
Europe Kullman 1996 S Old-growth Picea abies 0 Kullman 1996 0 0 -1 0 -1 0 0 0.00
Europe Kullman 2001 S Betula pubescens ssp. tortuosa, Pinus sylvestris 0 Kullman 2001 1 0 0 1 1 1 1 1.00
Siberia Devi et al. 2008 S Larix sibirica 0 Devi et al. 2008 1 0 1 0 1 0 0 0.00
Siberia Esper and Schweingruber 2004 M
Larix species, Pinus sibirica,
Picea obovata 1 URA1 1 0 1 0 1 1 1 0.89
Siberia Esper and Schweingruber 2004 M
Larix species, Pinus sibirica,
Picea obovata 2 URA2 1 0 1 0 1 1 1 ‘’
Siberia Esper and Schweingruber 2004 M Larix species, Pinus sibirica, Picea obovata 3 MOR 0 0 1 0 1 1 1 ‘’
Siberia Esper and Schweingruber 2004 M
Larix species, Pinus sibirica,
Picea obovata 4 ADZ 0 0 1 0 1 1 1 ‘’
Siberia Esper and Schweingruber 2004 M
Larix species, Pinus sibirica,
Picea obovata 5 NOR 0 0 1 0 1 1 1 ‘’
Siberia Esper and Schweingruber 2004 M
Larix species, Pinus sibirica,
Picea obovata 6 PUT 0 0 1 0 1 0 0 ‘’
Siberia Esper and Schweingruber 2004 M
Larix species, Pinus sibirica,
Picea obovata 7 BOJ 0 0 1 0 1 1 1 ‘’
Siberia Esper and Schweingruber 2004 M Larix species, Pinus sibirica, Picea obovata 8 ANA 0 0 1 0 1 1 1 ‘’
Siberia Esper and Schweingruber 2004 M
Larix species, Pinus sibirica,
Picea obovata 9 ARE 0 0 1 0 1 1 1 ‘’
Siberia Hantemirov et al. 2008 S Larix sibirica 0 Hantemirov et al. 2008 0 0 0 1 1 1 1 1.00
Siberia Kapralov et al. 2006 S L. sibirica, P. sibirica, B. tortuosa 0 Kapralov et al. 2006 1 1 1 0 1 1 1 1.00
Siberia Kharuk et al. 2006 S Larix gmelinii, Larix sibirica 0 Kharuk et al. 2006 1 0 0 1 1 1 1 1.00
Siberia Mazepa 2005 S Larix sibirica 0 Mazepa 2005 0 0 1 1 1 0 0 0.00
Siberia Shiyatov et al. 2007 S Larix sibirica 0 Shiyatov et al. 2007 1 1 0 0 1 1 1 1.00
Total Positive 16 8 27 42
Total No Change 77 86 53 52
38
Table A. 1. 4. Comparison of Present and Predicted Biome Types, by Study
Described here are comparisons of the dominant biome type across each study’s sites with the type predicted by BIOME4 for the year 2100. Only six biome types applied to the 30 studies. Biome abbreviations are:
Tundra: LHST = low and high shrub tundra, EDST = erect dwarf shrub tundra
Forest: NEF = needleleaf evergreen forest (cold or cool), CDF = cold deciduous forest, CMF = cool mixed forest
Alaska – 6 studies
Study Location Species Shift Amount Time Predicted
Change? Present Type Future Predicted Type
Barber et al. 2000 Alaska Picea glauca Reduced growth -- 20th century yes Cold NEF Cool NEF
Lloyd and Fastie 2002 Twelve sites in the White Mtns, Alaska Mtns, and Seward Peninsula
Picea glauca Tree growth changes Increased tree growth on 9 of 12 sites prior to 1950
Reconstruction since 1800
yes Cold NEF Cool NEF
Lloyd and Fastie 2003 Seven sites in the White and Alaska Mountain ranges, interior Alaska
Picea glauca Stand density increases and altitudinal migration at most sites
Density increases from <5 trees/ha to >15 trees/ha
Reconstruction since 1800
yes Cold NEF Cool NEF
Suarez et al. 1999 Noatak National Preserve, NW Alaska
Picea glauca Latitudinal shift and increased stand densities
80-100 m Past 150 years yes LHST Cold NEF
Tape et al. 2006 Northern Alaska and Pan-Arctic
Betula, Saliz, Alder spp.
Shrub expansion in size, abundance, and extent
Varies by landscape type
1983-2004 yes EDST,
LHST
Cold NEF
Wilmking et al. 2006 NW Alaska (68°060’N, 161°400’W)
39
Canada – 12 studies
Study Location Species Shift Amount Time Predicted
Change?
Present Type Future Predicted Type
Danby and Hik 2007
Kluane Ranges, SW Yukon, Canada
Picea glauca Mostly canopy cover and stand density increases, limited altitudinal shift
-- 1947-48 to
1989
no Cold NEF Cold NEF
Gamache and Payette 2004
East coast of Hudson Bay, Canada Picea mariana Acceleration in height growth of trees <2.5 m
0.5-1 m above previous levels
1970s to 1998 yes LHST, some cold NEF
Cold NEF
Lavoie and Payette 1992
Boniface River area (57°45’N, 76°20’W) , in subarctic Quebec, Canada
Picea mariana Increased stem initiation Supranival stem number increase from 1880, peaking in 1930-35, decreasing after 1955
Study done in 1989; reconstruction of past 400 yr
yes LHST Cold NEF
Lavoie and Payette 1994
East coast of Hudson Bay, Canada Picea mariana Latitudinal 4 km northward since late 1800s yes LHST Cold NEF
Lavoie and Payette
1996 East coast of Hudson Bay, Canada Picea mariana Latitudinal shift from krummholz growth Approx. 4 km Little Ice Age to 1990s no Cold NEF Cold NEF Lescop-Sinclair
and Payette 1995
Eastern coast of Hudson Bay, Canada, from 56°52'46N 76° 17'04W to 57°55'18N 76°41'46W
Picea mariana Latitudinal, toward Hudson Bay; krummholz growth, no establishment
12 km toward Hudson Bay 1992; tree establishment from late 1800s (Little Ice Age)
yes LHST Cold NEF
MacDonald et al. 1998
Nunavut, Canada Picea glauca, Picea mariana
No latitudinal shift but abundance increase
None 1880-1987 no Cold NEF Cold NEF
Masek 2001 Canada - east coast of Hudson Bay; Great Slave Lake, NW Territories
Picea mariana No latitudinal shift < 200-300 m/century 1972-2001 yes LHST Cold NEF
Payette 2007 Northern Labrador, Canada Picea glauca Altitudinal/latitudinal shifts, growth declines at some sites
-- Last half of 20th
century
yes LHST, some cold NEF
Cold NEF
Pereg and Payette 1998
East of Hudson Bay, Canada (57°45’N, 76°20’W)
Picea mariana Increased krummholz growth
Increases in stem initiation began in 1940s, peaking during the 1970s
Since 1890s yes LHST Cold NEF
Scott et al. 1987 Northern Manitoba, Canada Picea glauca Latitudinal migration and density increases
-- Little Ice Age
to 1980s
no Cold NEF Cold NEF
Szeicz and
MacDonald 1995 NW Canada Picea glauca No latitudinal shift or re-establishment of old stands
-- 200 years ago