Unusual operating cash flows and stock returns
Mei Luo
*,1The Accounting Department, School of Economics and Management, Tsinghua University, Beijing 100084, China
a r t i c l e
i n f o
JEL classification: M41
G14 Keywords:
Unusual cash flows from operations Cash flow prediction
Stock returns Market efficiency
a b s t r a c t
The current financial reporting of cash flows from operations does not present individual sources of these cash flows, making it diffi-cult for investors to assess a firm’s future performance. I hand-col-lect individual cash flows from unusual operations and examine their characteristics for predicting future cash flows. The results show that the unusual individual cash flow items contain a signif-icant incremental predictive ability for future cash flows. Addi-tional return tests show that stock prices fail to fully reflect their predictive value, suggesting that the current reporting practice may mislead investor perceptions of a firm’s cash generating abil-ity and investors could benefit from a more explicit presentation of cash flows from operations.
Ó2008 Elsevier Inc. All rights reserved.
1. Introduction
This paper examines the abilities of several unusual sources of cash flows from operations for indi-cating future economic conditions – future cash flows, and it examines whether the stock market par-ticipants fully reflect the predictive value contained in these individual cash flows. It aims to provide evidence whether, in predicting future cash flows and gauging the persistence of current cash flows, investors are better off knowing individual significant or unusual transactions that generate current cash flows from operations. The Financial Accounting Standards Board (FASB) requires a statement of cash flows filed periodically to the Securities and Exchange Commission (SEC) as part of financial fil-ings, on the basis of helping investors, creditors, and others assess the amount, timing, and uncertainty
0278-4254/$ - see front matterÓ2008 Elsevier Inc. All rights reserved. doi:10.1016/j.jaccpubpol.2008.07.004
* Address: 3850 Highbury Way, San Ramon, CA 94582, USA. Tel.: +86 10 62773185 (China)/+1 510 282 7487 (USA); fax: +1 360 287 7487.
E-mail address:[email protected] 1
This paper is partly based on my dissertation completed at University of California, Berkeley. Contents lists available atScienceDirect
J. Account. Public Policy
of prospective cash flows.2Cash flows from operations, the operating section of a statement of cash flows,
provide a key metric in assessing a firm’s ability to generate cash from internal operations and remain via-ble. Currently, most firms adopt indirect methods of adjusting earnings by accruals to present cash flows from operations. Its practical implementation imposes two difficulties for analyzing a company’s cash power. First, investors without insider information are not able to derive the same number as what the company reports as cash flows from operations if they apply the indirect method mechanically.3Second,
although the statement of cash flows from operations prepared by companies reports changes in the bal-ance of current accounts (i.e., accruals) excluding transactions that do not relate an operating source or use of cash to an income statement account, it does not present what underlying transactions cause changes in accruals or other operating cash flows, and thus determine the total amount of operating cash flows. Firms are neither required to disclose the individual sources of operating cash flows in the footnote disclosures. Not revealing explicitly how companies generate operating cash flows, a statement of cash flows lacks transparency needed for an investor to fully appreciate its economic implications. In worse scenarios, management could opportunistically report a desired amount of total operating cash flows to influence investor perception of the firm’s cash generating ability and future prospects.
This paper hand collects individual operating cash flows generated from significant or unusual transactions and examines their incremental value in forecasting future cash flows over items typi-cally reported in a statement of cash flows. These unusual operating cash flows are selected based on anecdotally documented problems in operating cash flow reporting (Mulford and Comiskey, 2002), and their information has to be widely available from footnote disclosures by sample firms. They are unusual in the sense that their distinct economic characteristics could cause misperception of the cash generating ability if investors treat them the same as other operating cash flows. The se-lected items are: (1) nonrecurring cash, (2) tax benefits realized from exercises of nonqualified em-ployee stock options, (3) cash used in investment activities (R&D and restructuring), and (4) cash from selling or securitizing accounts receivable.4The benchmark cash forecast model for examining their incremental predictive abilities incorporates the forecasting variables of theBarth et al. (2001)
model that is shown to have the most superior predictive ability. The results show that the unusual sources of operating cash flows provide significant incremental predictive value and possess differential persistence from other operating cash flows, implying that knowing the individual unusual or significant transactions and resulting operating cash flow helps in projecting future economic conditions.
I then investigate whether the stock market participants value the unusual sources of operating cash flows consistently with their implications for future cash flows. The findings indicate that stock prices do not fully reflect the predictive value of tax benefits and R&D expenses, and that investors do not imme-diately anticipate the lower future cash flows experienced by firms that sell or securitize part of accounts receivables to expedite the cash collection. Hedge portfolios based on their incremental predictive value can generate significant abnormal returns over the subsequent six months to three years.
This paper contributes to the accounting and financial market literature in a number of important ways. It is the first study to hand-collect operating cash flow components to explore the economic implications and stock market perception of unusual sources of operating cash flows that can poten-tially bias investor perception of the firm’s cash strength. Very few prior studies have explicitly exam-ined the predictive ability of components of operating cash flows. A recent study byCheng and Hollie
(2008)differentiates between core and non-core operating cash flows in predicting future cash flows,
where core and non-core cash flows are defined parallel to the presentation and format of operating income. Their estimation of cash flow components is subject to bias or errors from using balance sheet
2
Statement of Financial Accounting Standards (SFAS) no. 95, 1987, Statement of Cash Flows, paragraph 45.
3SeeBahnson et al. (1996) and Drtina and Largay (1985)for non-articulated differences in a statement of operating cash flows.
The indirect method adjusts net income by changes in noncash current accounts, assuming that changes in a current account relate an operating source or use of cash to an income statement account. When current accounts change without a link to the income statement, errors occur when mechanically applying the indirect method. For example, if stock shares are issued to settle a portion of accounts payable, a non-articulated difference occurs when net income is adjusted by changes in the balance of accounts payable that obviously are not related to use of cash or an income statement item.
4
There could be other unusual operating cash flow items, but obtaining them is often infeasible and could require inside information. For example, cash flows from the purchase or sale of trading securities are one of the emphasized problematic operating cash flows listed inMulford and Comiskey (2002), but I find little information about them in the financial filings.
based cash flow information (Collins and Hribar, 2002). Hand-collection of operating cash flow com-ponents avoids the measurement problems. This study also adds to prior explanations for the predic-tive ability of current aggregate cash flows for future returns (e.g.,Chan et al., 1991; Fama and French,
1996; Sloan, 1996).Dechow et al. (2007)decompose total operating cash flows based on how they are
used to explain the market inefficiency in incorporating information in cash flows. No prior studies have examined the sources of operating cash flows to explain the stock market inefficiency. The infor-mativeness of current operating cash flows about the future performance should be mainly deter-mined by characteristics of underlying transactions that generate these cash flows. The evidence implies that investors may not fully understand the economic implications of the underlying unusual cash flows whose information is often times imbedded in footnote disclosures. This research calls for more salient presentation and an increased level of disclosures, and provides insights for policy mak-ers of financial reporting standards.
The remainder of the paper is organized as follows. Section2examines the characteristics of the selected unusual operating cash flows for predicting future cash flows. Section3describes the sample and data collection. Section4reports the empirical results of the predictive value and the stock return analysis. Section5concludes the paper.
2. Unusual sources of cash flows from operations and research methodology 2.1. Economic characteristics
The selected unusual sources of operating cash flows possess economic characteristics distinct from other operating cash flows generated from ordinary and continuing operations.
2.1.1. Nonrecurring cash flows
Under the indirect method of presenting cash flows from operations, net income is reconciled by accruals to derive operating cash flows. Net income could contain many nonrecurring items, whose associated cash portions are included in total operating cash flows. Companies can classify income items to be nonrecurring based on their functional properties, such as income generated from discon-tinued operations. Companies also can opportunistically classify certain negative or positive items as nonrecurring to influence investor perception of the firm’s performance.Gu and Chen (2004)find that the income items treated by financial analysts as nonrecurring have a significant ability to indicate future performance. By definition, nonrecurring items should be irrelevant for forecasting a firm’s fu-ture performance, i.e., a zero predictive ability.5It remains an empirical question whether the operating
cash flows claimed by companies to be nonrecurring are relevant for forecasting future cash flows.
2.1.2. Tax benefits from exercises of nonqualified employee stock options
When nonqualified employee stock options are exercised, the issuing company will receive a tax benefit that equals the product of the tax rate and the difference between the exercise price and mar-ket price on the date options are exercised. A profitable company may use this tax benefit to reduce current tax payable and save cash payments for taxes. Tax payment generally is classified as an oper-ating activity. However, tax benefits from option exercises arise from granting stock shares to employ-ees, a form of non-debt financing activity (Kahle and Shastri, 2005), so they also can be financing cash flows. In 2000, the Emerging Issues Task Force reached a consensus that such tax benefits should be included in operating cash flows.6Not only do the tax benefits possess a non-operating feature, they
5 Ohlson (1999)uses the term ‘‘forecasting irrelevancy” to describe one of the conditions that transitory items possess:
forecasting irrelevant for next period’s abnormal earnings. This paper uses future cash flows to represent a firm’s future performance. Therefore, transitory or nonrecurring operating cash flows should satisfy forecasting irrelevancy for future cash flows.
6
The Emerging Issues Task Force (EITF) Issue 00-15 requires the tax benefits be classified as operating cash flows, effective for financial statements after July 20, 2000. Prior to the effective date, companies had the choice of reporting them in operating cash flows or financing cash flows. I collect tax benefits that are included in operating cash flows. The revised FASB No. 123, effective from June 2005, requires the tax benefit be classified as financing cash flows and will eliminate it as an unusual operating cash flow item. The newer requirement is irrelevant for my sample period of 1988–2000.
also are not directly influenced by management strategic operations like the other operating cash flows are. Employee exercise decisions and market conditions will mostly determine the amount. The huge amount of option grants and option exercises have created large corporate tax deductions and boosted operating cash flows during the market boom period from the year 1998–2001, whereas not as many benefits have accrued during the recent recession, which creates volatility in operating cash flow state-ments. Notably, the high levels observed in the late 1990s seem less likely to represent recurring cash flows. On the other hand, option exercises accompanied by strong market conditions also could indicate strong underlying operations and promise a prosperous future performance.
2.1.3. Operating cash expenditures related to investing activities
If potential investment endeavors are expensed as incurred in the income statement, the associated cash expenditures are treated as operating cash outflows. Research and development activities and restructuring activities are examples of such immediately expensed investment activities. They are investments intended to bring long-term benefits and improve future profitability. Most R&D ex-penses are cash expenditures, and restructuring activities also require substantial cash payment. Expensing these investment activities immediately will not only beat down earnings, but also reduce operating cash flows significantly. Prior studies have documented positive abnormal returns following R&D investments, suggesting that investors might be too pessimistic about the current period’s under-performance and under-react to the future benefits (e.g.,Chan et al., 2001; Eberhart et al., 2004;
Pen-man and Zhang, 2002). If firms make consecutive investments and associated benefits materialize
much later, predictable lower future cash flows will result. Conversely, when firms decrease invest-ments and profits emerge out of past successful investinvest-ments, positive future cash flows will arise. No prior research has provided a functional form for the differential economic relation of current R&D investments with future benefits from that of other periodic operating expenses, especially in the context of an operating cash flow item.
2.1.4. Cash proceeds from sale or securitization of accounts receivable
Credit sale transactions are followed with increases in revenues and accounts receivables. Any col-lection from customers will decrease the balance of accounts receivable and increase cash flows from operations. Instead of waiting several years for customers to pay back, management can discretion-arily securitize or sell receivables all at once to collect cash much faster and tempordiscretion-arily boost current operating cash flows. A significant amount of such cash inflows can distort the perception of a firm’s financial health if these discretionary cash flows do not recur. Nonetheless, if firms engage in these transactions regularly as a cheaper way of financing, the cash inflows during one period could be a good indicator for cash flows in the next period, because the underlying receivables sold or securitized are continuously generated from the core operations. Mechanically, discounting receivables collectible in multiple future years to the present will reduce cash flows received in future periods compared with everything-else-equal firms that do not sell receivables.
2.2. Research methodology
Barth et al. (2001), referred to as BCN thereafter, empirically examine the predictive power of
sev-eral forecast models and conclude that the forecast specification using total cash flows from opera-tions (CFO) and major accrual components – change in accounts receivable (DAR), change in accounts payable (DAP), change in inventory (DINV), depreciation and amortization (DEPAMO), and other accruals (OACC) – has a better predictive performance than other models. If components of oper-ating cash flows do not differ in predictive abilities, or if they differ but information in these differ-ences is captured by the accrual components, adding individual component of operating cash flows in the BCN model will not help for better prediction. Therefore, even if unusual components of oper-ating cash flows possess distinct economic characteristics, knowing them individually would not add benefits to investors. To have a robust examination of the incremental predictive value of unusual sources of operating cash flows, I use forecasting variables in the BCN model and capital expenditures (CAPITAL) as explanatory variables in the benchmark cash forecast model(1)
CFOðFCFÞtþn¼
a
þb1CFOtþb2CAPITALtþb3DAR
tþb4DINV
tþb5DAP
tþb6DEPAMOtþb7OACCtþetþn ð1Þ
I predict two types of future cash flows: operating cash flows (CFO) and free cash flows (FCF).FCFis the difference betweenCFOandCAPITAL.
The following model examines the incremental predictive abilities of the selected unusual compo-nents of operating cash flows. Every unusual component is part of total operating cash flows (CFO). Therefore, withCFOin the forecast model, the coefficient on each unusual component represents its incremental predictive ability as well as its differential predictive ability from the rest ofusual oper-ating cash flows
CFOðFCFÞtþn¼
a
þb1CFOtþb2CAPITALtþb3DAR
tþb4DINV
tþb5DAP
tþb6DEPAMOt þb7OACCtþd1NONRECtþd2YTAXBENtþd02Y0
TAXBENtþd002Y
00
TAXBENtþd3RDtþd03RESTRtþd4ARFINtDUMtþd04DUMtþetþn ð2Þ
The coefficientd1on nonrecurring cash flows (NONREC), reflects its incremental predictive ability. The total coefficient onNONREC,b1þd1, tests whether nonrecurring cash flows are forecasting irrelevant, i.e., a zero predictive ability. I allow the incremental predictive ability of tax benefits from exercises of nonqualified employee stock options (TAXBEN) to differ across time periods, due to the exceptionally large amount of tax benefits created in the market boom period.Y,Y0 andY00 are year indicators:Y
equals 1 if prior to the market boom period (1988–1998), and otherwise 0; Y0 equals 1 for year
1999 and otherwise 0;Y00equals 1 for year 2000 and otherwise 0.RDmeasures cash used in research
and development activities. The cash settlement for restructuring activities usually lasts several years.
RESTRtrepresents operating cash outflows incurred in fiscal yeartfor prior and current year restruc-turing activities.ARFINtmeasures the discretionary cash proceeds received or forgone in fiscal yeart from selling or securitizing accounts receivables. The indicator variableDUMcontrols for the system-atic difference in future cash flows between firms that engage in these transactions (DUM= 1) and firms that do not (DUM= 0). Its coefficient is expected to be negative. Coefficient on the interaction term ofARFINandDUM,d4, reflects the incremental predictive ability ofARFINwithin firms that en-gage in these transactions. All variables except indicator variables are scaled by average total assets. The inclusion of accrual components and capital expenditures as explanatory variables in model(2)
does not allow direct examination of the persistence of unusual components. The following equation tests their persistence in predicting future operating cash flows. The coefficient on eachunusualcash flow component,d, reflects its differential persistence from the rest ofusualoperating cash flows.
CFOtþn¼
a
þb1CFOtþd1NONRECtþd2TAXBENtþd3RDtþd03RESTRtþd4ARFINtDUMtþd04DUMtþetþn ð3Þ
3. Sample and data collection
The sample firms are Fortune 500 firms as of 2001 that are listed on NYSE, AMEX, and NASDAQ. The selection of mature and large firms ensures that cash flow information, together with other financial information, plays an important role to market participants in assessing a firm’s future prospects and stock value. The sample period is from year 1988 to 2000. Starting from year 1988, most firms adopted SFAS 95 for preparing the cash flow statement based on indirect method. I ex-clude financial services firms (SIC codes 6000–6999) because their cash flow activities are quite dif-ferent from other industrial firms. I also remove regulated firms (SIC codes 4000–4999) because their cash flows are subject to regulatory intervention and restructuring cash expenditures often are not available. I conduct a detailed and thorough examination of the full set of financial state-ments and footnote disclosures to collect the unusual operating cash flows. Half of the sample re-ports R&D activities, and firms reportingNONREC, TAXBEN, RESTR and DUM (=1) amount to 25%, 20%, 27% and 15%, respectively, of the whole sample. The 10-K filings of each firm are obtained from EdgarScan, EdgarOnline, or the Lexis/Nexis database. Other financial data are fromCompustatAnnual Industrial and Research Files, and stock return data are from CRSP. Firm-year observations need to
Table 1
Incremental predictive abilities of unusual components of operating cash flows
CFOðFCFÞtþn¼aþb1CFOtþb2CAPITALtþb3DARtþb4DINVtþb5DAPtþb6DEPAMOtþb7OACCtþetþn ð1Þ
CFOðFCFÞtþn¼aþb1CFOtþb2CAPITALtþb3DARtþb4DINVtþb5DAPtþb6DEPAMOtþb7OACCtþd1NONRECt
þd2YTAXBENtþd02Y0TAXBENtþd002Y00TAXBENtþd3RDtþd30RESTRtþd4ARFINtDUMt
þd04DUMtþetþn ð2Þ
Benchmark model(1) Model(2)
CFOt+1 FCFt+1 CFOt+1 FCFt+1 NONREC 0.223 0.279 (0.02) (0.02) YTAXBEN 1.010 1.079 (0.00) (0.00) Y0TAXBEN 0.378 0.592 (0.18) (0.10) Y00TAXBEN 0.344 0.014 (0.34) (0.97) RD 0.140 0.212 (0.00) (0.00) RESTR 0.026 0.189 (0.89) (0.39) ARFINDUM 0.012 0.003 (0.90) (0.98) DUM 0.010 0.012 (0.00) (0.00) CFO 0.719 0.597 0.669 0.544 (0.00) (0.00) (0.00) (0.00) CAPITAL 0.033 0511 0.021 0.561 (0.50) (0.00) (0.49) (0.00) DAR 0.452 0.412 0.391 0.329 (0.00) (0.00) (0.00) (0.00) DINV 0.355 0.201 0.320 0.183 (0.00) (0.00) (0.00) (0.00) DAP 0.460 0.423 0.437 0.387 (0.00) (0.00) (0.00) (0.00) DEPAMO 0.327 0.062 0.280 0.102 (0.00) (0.48) (0.00) (0.27) OACC 0.209 0.187 0.181 0.154 (0.00) (0.00) (0.00) (0.00) v2 test (b1+d1= 0) (0.00) (0.03) Adj.R2 45% 28% 47% 30%
This table presents the estimation results for the benchmark cash forecast model(1)and the model with unusual operating cash flows(2)in predicting future one-year-ahead operating cash flows and free cash flows. Estimation results for predicting future two-years- and three-years-ahead cash flows are similar. The estimates for intercepts are suppressed. Numbers in bold indicate a significant difference from zero at or below 10% level, two-sided.p-Values in parentheses below the coefficient estimates are associated with heteroscedasticity adjusted White-tstatistics, andp-values associated with the Chi-squared tests for nonre-curring cash flows are based on the heteroscedasticity adjusted covariance of estimates.
The sample contains firms from Fortune 500 index as of 2001. The sample period is 1988–2000. Unusual operating cash flows are collected from financial filings.NONRECis operating cash flows claimed explicitly as nonrecurring.TAXBENis tax benefits realized in the current year as cash savings from employee exercises of nonqualified stock options.RDis cash expenditures for research and development activities, a negative amount.RESTRis cash expenditures incurred in the current year for prior and current restructuring activities, a negative amount.ARFINis discretionary cash flows received or forgone from selling or securitizing accounts receivables.DUMequals 1 if firms engage in the sale or securitization, and 0 otherwise.CFOis total cash flows from operations (Compustat item #308). I use reported cash flows from operations in 10-K filings if it is inconsistent with item #308.FCFequalsCFOminus capital expenditures (#128), or equalsCFOplus cash flow from investing activities (#311) if #128 is missing.CAPITALequalsCFOminusFCF. The accruals are defined the same as those inBarth et al. (2001)per the statement of operating cash flows.DAR: change in the accounts receivable, #302;DINV: change in inventory, #303;DAP: change in accounts payable, #304;DEPAMO: depreciation and amortization expenses, #125; and other accruals (OACC): total accruals (earnings (#18) –CFO) minus (DAR+DINV–DAP–DEPAMO). If data items 302, 303, 304 and 125 are missing, then DAR,DINV, andDAPare estimated from the balance sheet accounts. All variables exceptDUMare scaled by the average total assets (Compustat item #6).
have sufficient data to test the incremental predictive abilities, resulting in a sample of 3172 firm-year observations and a total of 290 firms.
4. Empirical results
4.1. Incremental predictive abilities and persistence
Table 1reports coefficient estimates and associatedp-values on the unusual components of
oper-ating cash flows in predicting future one-year operoper-ating cash flows and free cash flows. Predicting fu-ture two- and three-year cash flows yield very similar results (not reported). The results from estimating the benchmark forecast model(1)show that accrual components and total operating cash flows are significantly associated with future cash flows, consistent withBarth et al. (2001).CAPITAL
does not possess incremental information relating to future operating cash flows, suggesting that the accrual variable – depreciation and amortization (DEPAMO) absorbs information about future operat-ing cash benefits in the current capital expenditures.CAPITALhas a significantly negative association with future free cash flows, probably because the predictable future capital expenditures are sub-tracted in deriving future free cash flows.
The right two columns ofTable 1present the estimation results for model(2). The results indicate that individual cash flows from unusual operations jointly provide significant incremental value in predicting future cash flows over items typically reported in a statement of cash flows – major accrual components and total operating cash flows. Specifically,NONRECpredicts less future cash flows with significant incremental coefficients of0.223 and0.279 for future one-year operating and free cash flows. Chi-squared tests rejectb1+d1= 0, implying that currentNONREChas a significant forecasting ability for the next year’s cash flows, which stands in contrast to the claim of ‘‘nonrecurring” cash flows made by companies in the financial filings. It eventually becomes forecasting irrelevant for the three-year-ahead cash flows. Tax benefits generally predict higher future cash flows than other operating cash flows with positive incremental coefficients, especially for tax benefits realized prior to the market boom period. The significance diminishes and coefficients turn negative on tax benefits realized in the market boom period (year 1999 and 2000). The strongly positive coefficient implies that tax benefits arising from option exercises could reflect strong underlying business operations and in turn, indicate a promising future performance and predict more exercises of stock options. However, the large benefits created by the boom are not as promising. The negative incremental coef-ficient onRD(measured in negative) suggests that R&D cash outflows contribute to higher future ben-efits than do other operating cash outflows. The lower coefficient on R&D expenditures reflects the offsetting of positive future benefits and recurring R&D investments. The expenses for restructuring activities are usually paid for over a number of years, so the yearly cash payment (RESTR) exhibits the same predictive ability as other operating cash expenses, with an insignificant coefficient. The
Table 2
Persistence of unusual components of operating cash flows
CFOtþn¼aþb1CFOtþd1NONRECtþd2TAXBENtþd3RDtþd03RESTRtþd4ARFINtDUMtþd04DUMtþetþn ð3Þ
CFO NONREC TAXBEN RD RESTR ARFINDUM DUM Adj. R2
CFOt+1 0.546 0.181 0.531 0.258 0.257 0.080 0.014 (0.00) (0.06) (0.02) (0.00) (0. 18) (0.42) (0.00) 41% CFOt+2 0.454 0.295 0.201 0.302 0.050 0.132 0.016 (0.00) (0.01) (0.38) (0.00) (0.85) (0.10) (0.00) 31% CFOt+3 0.435 0.377 0.070 0.275 0.042 0.083 0.015 (0.00) (0.00) (0.76) (0.00) (0.83) (0.32) (0.00) 27%
This table presents the estimation results for model(3). Coefficient estimates on unusual components of operating cash flows represent their respective different persistence from the rest of operating cash flows. Numbers in bold indicate a significant difference from zero at or below 10% level, two-sided.p-values in parentheses below the coefficient estimates are based on heteroscedasticity adjusted White-tstatistics. SeeTable 1for sample description and variables measurement.
Hedge Portfolio Returns Based on TAXBEN (1.53) (1.34) (2.6) (2.54) (2.6) 0 0 .0 5 0 .1 0 .1 5 0 .2 0 .2 5 0 .3
six-month one-year 2nd-year 3rd-year
Hedge Portfolio Returns Based on RD
(2.54) (2.75) (2.1) (2.8) (3.44) 0 0.0 5 0.15
Hedge Portfolio Returns Based on DUM
(0.55) (0.9) (1.09) (1.89) (1.45) 0 0.0 1 0.0 2 0.0 3 0.0 4 0.0 5 three-month
six-month one-year 2nd-year 3rd-year three-month
six-month one-year 2nd-year 3rd-year three-month
0.1 0.2
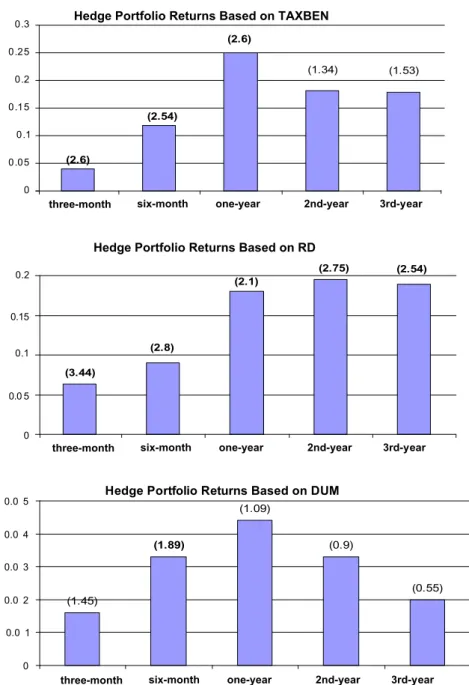
Fig. 1.Time-series means andt-statistics (in bracket) of hedge portfolio returns over various return windows. Each year starting 3 months after fiscal year-end, I rank stocks into equal-sized quartiles based on RD and TAXBEN using firms that disclose the respective item. I calculate the size-adjusted returns to hedge portfolios of buying the top TAXBEN (bottom RD) quartile of firms and selling the bottom TAXBEN (top RD) quartile of firms over the subsequent three-month, six-month, and each of the future three years. The top two graphs depict the average returns andt-statistics for each return window across 13 years from 1988 to 2000 for RD and 11 years from 1988 to 1998 for TAXBEN. The bottom graph calculates the average difference in size-adjusted returns from 1988 to 2000 between a portfolio of firms that do not sell receivables (DUM = 0) and firms doing so (DUM = 1). See variable definitions inTable 1. Boldedt-statistics represent a two-tailed significance level at or below 10%.
discretionary cash proceeds from selling or securitizing accounts receivables have the same predictive ability as other cash flows generated from ordinary business avenues. However, firms engaging in these financing facilities will systematically entail $0.01 lower cash flows in multiple future years than do other firms. This finding implies that although management may exercise discretion to receive cash much faster and temporarily increase operating cash flows, future cash flows will suffer.
Table 2presents the estimation results for the persistence of individual operating cash flows in
pre-dicting future three years’ operating cash flows. These unusual operating cash flows have a different persistence from other operating cash flows, in a similar manner to their incremental predictive abil-ities reported inTable 1. This similarity implies that the incremental predictive abilities of the unusual components remain robust to the correlation, if there is any, between the unusual operating cash flows and other forecast variables in model(2).
I also perform robustness tests for the incremental predictive value, such as using alternative benchmark forecast models, or running a separate forecast model for each unusual component instead of including all in one forecasting equation. The incremental predictive abilities of unusual compo-nents of operating cash flows remain qualitatively the same.
4.2. Stock market returns analysis
At the time of financial statement release, if investors fail to distinguish unusual operating cash flows from other operating cash flows but form naïve expectations of future cash flows without rec-ognizing their incremental predictive value, as new information arrives or actual cash flows are re-vealed, stock prices will gradually reflect the information and predictable abnormal returns will result. To test whether stock prices immediately reflect the positive (negative) incremental predictive value in unusual operating cash flows, I calculate portfolio returns to hedge positions that buy the top (bottom) quartile and sell the bottom (top) quartile of stocks ranked on the magnitude of each unusual cash flow item. Each year starting three months after fiscal year-end, I rank stocks into equal-sized quartiles using firms that disclose the respective item.Fig. 1depicts the average abnormal returns and associatedt-statistics to hedge portfolios formed on the basis ofTAXBEN,RD, andDUMover the return windows of subsequent three months, six months, and each of the future three years. The re-sults show that hedge positions based onTAXBENgenerate significantly positive returns over the sub-sequent three months up to one year. Hedge portfolios based on RDproduce substantial positive returns over the subsequent three months through the entire three years. Firms that sell or securitize accounts receivables (DUM= 1) experience a significant 3.3% lower return over the subsequent six months than firms that do not engage in such discretionary activity (DUM= 0). Strategies based on
NONRECdo not generate significant returns over any return window (not reported) even though it has an incrementally negative association with future cash flows. The correct valuation probably ben-efits from the emphasis many firms place on nonrecurring cash flows via a separate line item in the cash flow statement.RESTRdoes not contain incremental predictive value, and consequently, the re-sults indicate no associated abnormal returns. Rere-sults are qualitatively the same with size-adjusted returns and market-adjusted returns.
I also conduct cross-sectional (Fama and MacBeth, 1973) regressions of one-year-ahead abnormal returns on the unusual components of operating cash flows, controlling for previously documented return predictors and risk factors. The results confirm the predictable associations observed in
Fig. 1. The overall evidence suggests that investors underestimate the future cash flows predictable
by R&D investments or by tax benefits from employee exercise of stock options, and investors do not immediately anticipate the lower future cash flows caused by selling or securitizing accounts receivables.
5. Conclusions
By collecting operating cash flows from unusual or significant transactions, this paper explores information in individual cash flows about future economic conditions. The evidence shows that unu-sual sources of operating cash flows, whose information is imbedded in footnote disclosures, possess significant incremental predictive value and have a different persistence from other usual operating
cash flows. Presenting them saliently will add significantly to the informativeness of a cash flow state-ment. The stock market participants do not seem to fully value the unusual operating cash flows con-sistently with their implications for future cash flows. The current practice of imbedding information in the footnotes about individual significant transactions and the resulting operating cash flows may not help investors to fully incorporate the implications of current operating cash flows for future eco-nomic conditions.
For illustrative purpose, this paper examines several unusual sources of operating cash flows that can be obtained from financial statements and footnote disclosures. Under current corporate reporting practice, information about many other unusual sources of operating cash flows is often times hidden from an outside investor and omitted in financial filings. The evidence presented here highlights a serious problem facing standard-setting bodies: If stock prices do not fully reflect the implications of items that are costly to collect but still identifiable, how much mis-pricing would we expect for other unusual sources of operating cash flows that are less widely disseminated, non-disclosed or con-cealed by firms in the financial statements?
Acknowledgements
I am grateful to Sunil Dutta, Daniel L. McFadden, and Xiao-Jun Zhang for their valuable comments and suggestion. I appreciate the encouragement by editors Martin Loeb and Lawrence Gordon, and valuable comments from the reviewers. I am also thankful to William Beaver, S.P. Kothari, Stephen Penman, Theodore Sougiannis, Brett Trueman, and workshop participants at University of California, Berkeley, Stanford University, and 2005 AAA annual conference in San Francisco, for their helpful in-sights. I appreciate the continuous support and encouragement from Dr. Yi Zheng and Ms. Dan Yu. References
Bahnson, P., Miller, P., Budge, B., 1996. Nonarticulation in cash flow statements and implications for education, research and practice. Accounting Horizons 10, 1–15.
Barth, M., Cram, D., Nelson, K., 2001. Accruals and the prediction of future cash flows. The Accounting Review 76, 27–58. Chan, L., Hamao, Y., Lakonishok, J., 1991. Fundamentals and stock returns in Japan. Journal of Finance 46, 1739–1764. Chan, L., Lakonishok, J., Sougiannis, T., 2001. The stock market valuation of research and development expenditures. Journal of
Finance 56, 2431–2456.
Cheng, C.S.A., Hollie, D., 2008. Do core and non-core cash flows from operations persist differentially in predicting future cash flows? Review of Quantitative Finance and Accounting 31, 29–53.
Collins, D., Hribar, P., 2002. Errors in estimating accruals: Implications for empirical research. Journal of Accounting Research 40, 105–134.
Dechow, P., Richardson, S., Sloan, R., 2007. The persistence and pricing of the cash component of earnings, Working paper, University of California, Berkeley and Barclays Global Investors.
Drtina, R., Largay III, J., 1985. Pitfalls in calculating cash flow from operations. The Accounting Review 60, 314–326. Eberhart, A., Maxwell, W., Siddique, A., 2004. An examination of long-term abnormal stock returns and operating performance
following R&D increases. Journal of Finance 59 (2), 623–650.
Fama, E., French, K.R., 1996. Multifactor explanations of asset pricing anomalies. Journal of Finance 51, 55–84. Fama, E., MacBeth, J.D., 1973. Risk, return and equilibrium – empirical tests. Journal of Political Economy 71, 607–636. Gu, Z., Chen, T., 2004. Analysts’ treatment of nonrecurring items in street earnings. Journal of Accounting and Economics 38,
129–170.
Kahle, K., Shastri, K., 2005. Firm performance, capital structure, and the tax benefits of employee stock options. Journal of Financial and Quantitative Analysis 40 (1), 135–160.
Mulford, C., Comiskey, E., 2002. The Financial Numbers Game, Detecting Creative Accounting Practices. John Wiley & Sons, Inc. Ohlson, J., 1999. On transitory earnings. Review of Accounting Studies 4, 145–162.
Penman, S., Zhang, X., 2002. Accounting conservatism, the quality of earnings, and stock returns. The Accounting Review 77, 237–264.
Sloan, R., 1996. Do stock prices fully reflect information in accruals and cash flows about future earnings? The Accounting Review 71, 289–315.