Post-Crisis»Analytics:»six»imperatives
Economic stress has produced more demand
for analytic insights and is changing how we
use them
By Dr. Andrew Jennings, FICO Chief Research Officer and Head of FICO Labs
One response to the severity of the recent economic crisis is increasing demand for analytics. Forrester Research predicts that the market for predictive analytics and data mining will grow at a rapid pace to $1.8 billion by 2014.1 You can gauge the demand for analytics, in part, by the
high-profile acquisitions of analytics companies by the world’s largest technology players, and by the rapid announcements of new analytic products and platforms.
Fueling this growth are executives who want data-driven insights, predictions and recommendations to help them recognize leading indicators of adversity and opportunity. They want a surer guidance system for taking astute, timely actions that minimize downside exposure and maximize upside potential.
More analytics doesn’t mean more of the same, however. What we’ve learned from the crisis must now shape the way we build and use analytics. While today’s business press is filled with the message that analytics can help companies “do business smarter,” the largest gains will come from
using analytics smarter.
In this paper, I discuss six analytic imperatives for raising performance to the next level:
1. Turn the “360-degree customer view” inside out.
2. Model the decision to optimize performance.
3. Rethink what it means to be data-driven when the future isn’t like the past.
4. Factor macro-economic forecasts into analytics.
5. Balance automation with expertise.
6. Justify complexity and increase transparency.
1 Market Overview: The Business Intelligence Software Market, Forrester Research, Inc. 10/23/09, p7
Number 40—July 2010
Analytically driven companies will claim the
leadership positions in their industries. But they
won’t get there by going click-click-click.
»
»
insights
That’s what the CEO of a large financial services firm recently said to his top managers. “Show me the data, explain why I should trust the model and tell me where its weaknesses are that I need to be aware of.”
This insistence on stronger empirical foundations for decisions—and on better understanding of how these decisions are arrived at—is not unique to financial services. It is occurring across many industries and fueling rising demand for analytics. Clearly, while a key tenet of the business world has long been “If you can’t measure it, you can’t manage it,” today we need to add “If you can’t predict it, you can’t manage it.”
Periods of adversity force businesses to perform better. They push competition to a higher level, which becomes the new normal going forward. And today’s new normal demands a higher level of analytic sophistication.
If I had to sum up the impact of the economic crisis on business analytics in a sentence, I would say this: No company can afford not to be an analytically driven competitor. Success, however, requires, more than ever, the right blend of data, technique and domain experience. Grave dangers lie in the naïve application of prepackaged analytic techniques.
With that in mind, here are the six ways I believe analytics needs to change to drive business performance to higher levels.
1. Turn the “360-degree customer view” inside out
The phrase has been used so often it has become banal—even though few companies have actually brought their initiatives to understand customers full-circle. Most still have a way to go in bridging the silos of data and decisioning that span their operational landscapes.
The new normal requires that companies will ultimately achieve integration and coordination across multiple business lines, products, channels and customer lifecycle management areas. At the same time, top performers are pushing beyond this effort to bridge corporate views of the customer and focusing on developing a more holistic understanding of the customer’s view. In a sense, it’s about “getting inside the customer’s head” and taking a 360-degree look outward.
To construct this inside-out customer view, companies are bringing together data from a widening range of internal and external sources. The sense of urgency that came with crisis is impelling them to tackle the thorny integration and organizational issues involved in sharing data across product lines, channels and customer lifecycle decision areas.
There’s another aspect to this effort. No one doubts that more data and more relevant data leads to better models. Winners, however, won’t just use that data to build better models—they will
»
“Don’t tell me what
you think, but what
you know.”
»
The six imperatives
“Customer retention has returned as a core value to financial
services institutions. Analytics can play a major role.”
—Rodney Nelsestuen, Senior Research Director, TowerGroup
April 2010
»
»
»
insights
»
insights
A smarter use of analytics is to model the offer you are about to make. That means asking questions about which products individual customers are most likely to buy next, and when they are most likely to make the purchase. If customers buy a particular product, which related products are they most likely to buy within a specific range of time? Which channels does this customer use most, and does that pattern vary by season or by day of the week?
By using analytics to answer these kinds of questions, you can predict an individual customer’s sensitivity to the specific attributes of an offer (including packaging, pricing, delivery channel and timing). You can also automatically generate population segments with similar sensitivity. This is the key insight on which differentiation can be built. We’ve seen this kind of precision boost response rates to 25%, with 85% of the responding population converting to new customers.
Better questions need to be asked in the credit risk area too. Lenders can now use analytics to predict not only “What is the current risk that this consumer will become delinquent?” but also “What is the future risk if they take on additional debt?” Answering questions like these, which address
credit capacity, is essential to fully meeting requirements for assessing a borrower’s ability to pay. Lenders should also be addressing questions of credit serviceability—”How are this customer’s usage and payment behavior likely to change as interest rates shift?”
Finding such answers is immensely more difficult when you have silos of data and product-oriented views of the customer than when you have shared data and a holistic view. So while the effort required to overcome data and organizational differences is not trivial, it can pay back handsomely in opportunities for analytically driven competitive differentiation.
2. Model the decision to optimize
performance
The gist of this paper will be on making better decisions. This is because while we must continue to improve scores and other predictive analytics, the largest performance gains going forward will
come from improving how we use them in our
decision strategies. It is, after all, better decisions that improve business performance, not better predictive models in isolation.
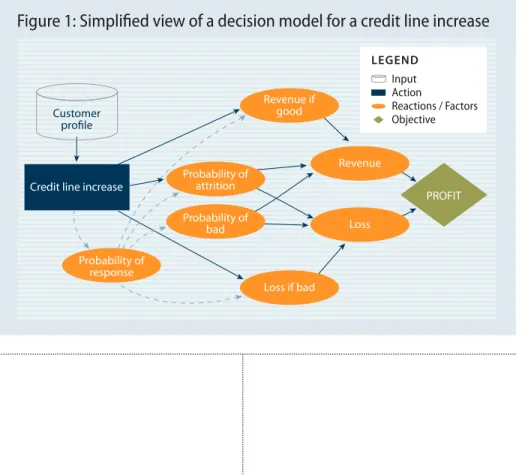
This means we need to model more than individual customers and their behavior. We need to model the decision itself. Decision modeling is a fundamental technique for understanding and improving decision strategies. A decision model, as shown in Figure 1, can incorporate any number of predictive analytics along with a multitude of other inputs.
Figure 1: Simplified view of a decision model for a credit line increase
Revenue Loss PROFIT Loss if bad Revenue if good Probability of response Probability of bad Probability of attrition Credit line increase
Customer profile Input Action Reactions / Factors Objective LEGEND
»
»
»
insights
»
insights
All decision makers have a view of the way a particular business situation operates whether they recognize it formally or not. The great advantage of the decision model concept is that it makes that view explicit and ties it to an objective like maximizing sales or profit. It also makes clear the decision variables—like credit limit and interest rate or channel and price—and the constraints that need to be met, such as expected losses not exceeding some predetermined value. At the core of this model are predictions about how customers will react to potential actions. Generally these are the models that determine the effectiveness of the decisions that get created. However, it is very common for decision makers and analysts to create their decisions with a complete absence of any formal understanding of these action-reaction relationships. Not surprisingly, this leads to lost opportunity.
Typically, managers and analysts who design decision strategies start with the decision tree, not with the decision model. As shown in Figure 2, this approach can be logically convenient because we find it easy to think in the sequential logic that a tree represents. It is highly inefficient, however, because it ignores the underlying structure of the problem. In essence, analysts skip a step and try to go directly to the answer. Guess what: They are often a long way from getting it right. In our experience, the performance difference between a decision strategy that has been carefully modelled and one that hasn’t is about 30%. This gap gets worse when it is time to adapt the decisions to some new set of circumstances. What is new about that set of circumstances is either that the relationships in the decision model have changed or that a new set of business constraints need to apply. It follows logically that you go to that model to understand those changes or impose those constraints. You don’t start by editing the answer you already have.
Thinking this way, one can see how the decision model concept creates the best starting place for three crucial steps to improving decisions:
• First, adapting the parameters and constraints of the model for some new circumstance forms a sound way of creating new decision logic. You are addressing the change at the structural level, not editing some derived construct. This also applies to the testing of new strategies, which I will refer to in the next section.
• Second, because the decision model makes explicit the underlying relationships, it becomes much clearer what information should be tracked to understand if a strategy is playing out
»
»
insights
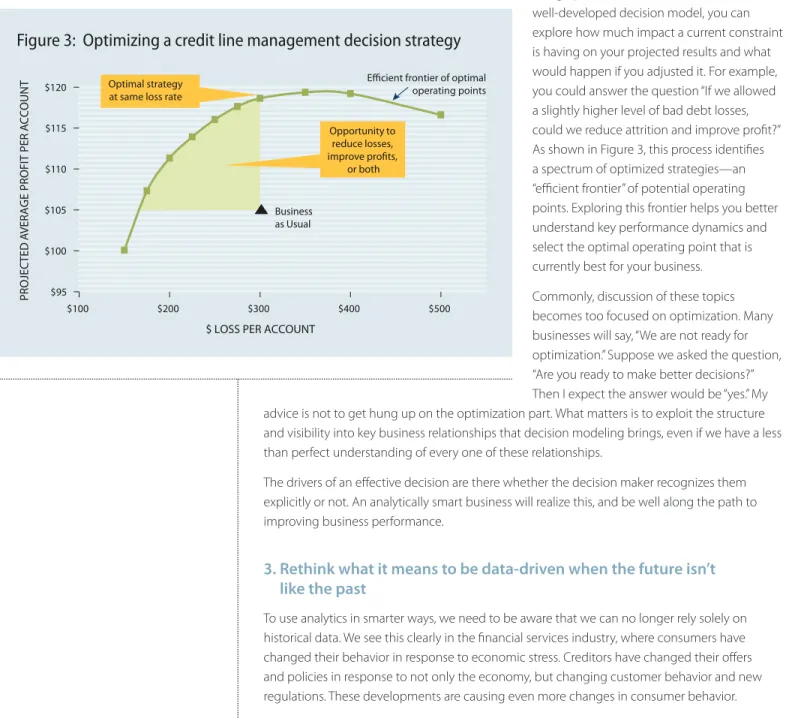
In addition to making the drivers of a decision clear, a decision model can be “solved” by mathematical optimization. Optimization pinpoints the single best strategy for maximizing or minimizing a particular goal. For example, what’s the best strategy for maximizing profit or minimizing bad debt losses? The output of optimization is the assignment, at the level of individual customers, of the best actions or treatments for what you’re trying to accomplish at the portfolio or organizational level. The resulting solution can be expressed as a decision tree. Using optimization and simulation with a well-developed decision model, you can explore how much impact a current constraint is having on your projected results and what would happen if you adjusted it. For example, you could answer the question “If we allowed a slightly higher level of bad debt losses, could we reduce attrition and improve profit?” As shown in Figure 3, this process identifies a spectrum of optimized strategies—an “efficient frontier” of potential operating points. Exploring this frontier helps you better understand key performance dynamics and select the optimal operating point that is currently best for your business.
Commonly, discussion of these topics becomes too focused on optimization. Many businesses will say, “We are not ready for optimization.” Suppose we asked the question, “Are you ready to make better decisions?” Then I expect the answer would be “yes.” My advice is not to get hung up on the optimization part. What matters is to exploit the structure and visibility into key business relationships that decision modeling brings, even if we have a less than perfect understanding of every one of these relationships.
The drivers of an effective decision are there whether the decision maker recognizes them explicitly or not. An analytically smart business will realize this, and be well along the path to improving business performance.
3. Rethink what it means to be data-driven when the future isn’t
like the past
To use analytics in smarter ways, we need to be aware that we can no longer rely solely on historical data. We see this clearly in the financial services industry, where consumers have changed their behavior in response to economic stress. Creditors have changed their offers and policies in response to not only the economy, but changing customer behavior and new regulations. These developments are causing even more changes in consumer behavior.
Figure 3: Optimizing a credit line management decision strategy
$95 $100 $105 $110 $115 $120 PR OJEC TED A VERAGE P RO FIT PER A CCO U N
T Efficient frontier of optimal
operating points
$100 $200 $300 $400 $500
$ LOSS PER ACCOUNT
Business as Usual Opportunity to reduce losses, improve profits, or both Optimal strategy
»
»
insights
To cope with such upheavals, top performers are continuing to analyze historical data, but also probing their markets by conducting rapid-cycle designed experiments. They’re analyzing the results to learn as quickly as possible about changing market dynamics and identify which offers, policies and actions are working best now. In a world where discontinuous change can happen in any industry, every business should be adopting this discipline.
For financial services, what I’m saying is nothing new, since credit card issuers have long engaged in such test-and-learn cycles. They’re referred to as “champion/challenger tests” because the current business-as-usual approach (“the champion”) is tested against a proposed alternative approach (“the challenger”). If the challenger wins, it is usually promoted to champion status, and a new challenger is pitted against it.
What is new is that top performers are changing how they perform champion/challenger testing in order to dramatically increase learning speed and yield.
First, instead of relying primarily on judgment to figure out what the next challenger should be (“Let’s try making this change, and see what happens”), they’re using decision modeling to create new challengers.
Second, top-performers are following the proven principles of experimental design to learn more from fewer tests. This mature discipline aims at creating experiments whose results can be accurately analyzed and causes of variations understood. A well-designed series of experiments eliminates the need to test every option—or even all the best options—because enough has been learned already to extrapolate the outcome.
In a high-performing analytic organization, a certain proportion of challengers will be purposefully designed to produce “controlled variation.” If you test only challenger strategies that are close to how you currently do business, you will limit what you can learn from your data. If, however, you push the design of some challengers outside of the bounds of business as usual, you’ll introduce variation into your data and expand what you can learn from it.
In a practical situation, it is never as simple as the challenger beats the champion. Well-designed strategies don’t even set out with this goal in mind. They set out to push the relationships that underlie the decision model so that learning increases understanding. Think of them not as challengers to replace a champion, but as learning strategies. This cycle, in turn, leads to a new champion and another round of testing. By exploring a wider range of possibilities, you increase the chances of discovering unique insights that might lead to competitive differentiation, and you’re also less likely to be caught flat-footed when the forces of change shake up the status quo.
4. Factor macro-economic forecasts into analytics
Because we place less trust in the patterns of the past to forecast the patterns of the future, we need ways to inject alternate perspectives of the future into analytic techniques. The most urgently sought alternative perspective is the impact of future macro-economic conditions on customer behavior.
»
»
insights
We’ve all seen that abrupt economic changes, such as severe recessions, can cause actual customer behavior to shift from what historical data tells us it should be. In the recent downturn, credit default rates rose significantly above the rates historically associated with standard credit score ranges. Many creditors, caught unprepared, took too long to adjust their policies and experienced sharply rising delinquencies and bad debt write-offs as a result.
Today we have new analytic methods for forecasting how such macro-economic conditions are likely to impact customer behavior and change our results. We can do this with both behavior predictions and decision strategies.
At the level of behavior predictions, analytics are now being used to generate an index of how much default rates are likely to increase or decrease under a range of economic forecasts. This index enables lenders to see, for example, that in a moderate recession, an individual with a credit score of 620 is likely to have a default rate much closer to that traditionally associated with a score of 614. In a very severe recession, the default rate is likely to look a lot more like that of a 600. This doesn’t mean the score is “broken”—it may rank-order risk just as strongly as ever, but the performance of customers at each score has degraded.
With this kind of economic impact simulation, lenders can select the economic forecast they believe is probable, then use the associated index metrics to adjust their score cutoffs for credit approval. In this way, it’s possible to maintain a fairly consistent default rate across changing economic conditions.
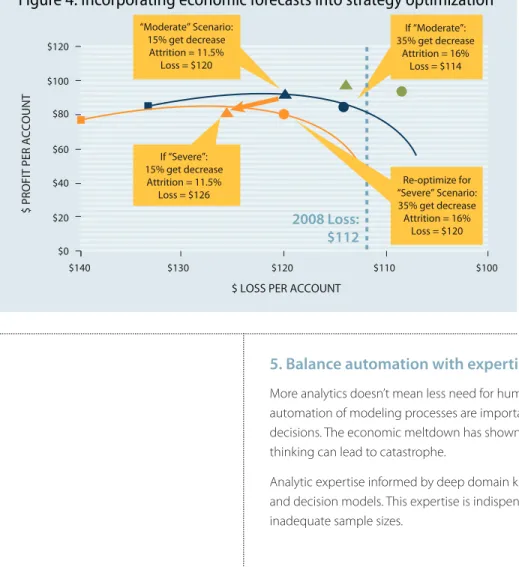
At the level of decision strategies, we can also project the impact of a range of possible future macro-economic conditions. As shown in Figure 4, using decision modeling and optimization, we can extrapolate how the efficient frontier of potential optimized operating points would shift in a moderate or severe recession. We can also explore the trade-offs in strategies that balance competing objectives, such as minimizing both losses and attrition, in order to achieve the overall goal of keeping profit per account as high as possible despite downward economic pressures.
5. Balance automation with expertise
More analytics doesn’t mean less need for human expertise. Automated discovery of patterns and automation of modeling processes are important tools that can speed the process of improving decisions. The economic meltdown has shown us, however, that letting the machines do all the thinking can lead to catastrophe.
Analytic expertise informed by deep domain knowledge is essential to building effective predictive and decision models. This expertise is indispensable for dealing with everything from data bias to inadequate sample sizes.
Figure 4: Incorporating economic forecasts into strategy optimization
$0 $20 $40 $80 $60 $100 $120
$ PROFIT PER ACCOUNT
$140 $130 $120 $110 $100
$ LOSS PER ACCOUNT
If “Moderate”: 35% get decrease Attrition = 16% Loss = $114 If “Severe”: 15% get decrease Attrition = 11.5% Loss = $126 Re-optimize for “Severe” Scenario: 35% get decrease Attrition = 16% Loss = $120
2008 Loss:
$112
“Moderate” Scenario: 15% get decrease Attrition = 11.5% Loss = $120»
»
insights
I don’t think I’m going too far by saying that the real power in modeling has always come from the analytics expert, and this will not change. Expertise makes the difference between models that perform so-so and those that perform at a very high level. This performance edge comes from the expert’s ability to interpret nuances in the data in order to find the best predictive characteristics for a desired performance outcome. It comes from knowing how to validate models without “over-fitting” them to the data they were developed from, and how to fine-tune models to a company’s specific real-world business conditions. Above all, the analyst’s understanding of the context in which a model will be used—and the decision it’s supposed to improve—is absolutely critical. Today’s analytic announcements focus on the need to use analytics to crunch through petabytes of data. That’s true, but it’s only part of the story. Given today’s dynamic market conditions, businesses need analytics to make decisions for which they don’t have petabytes of data—or at least not petabytes of relevant data. That’s why you need to rely on analytic experts to get the most predictive value from what you have to work with.
Here’s an example of what I mean. You can make the performance of a credit approval model look wonderful in the development stage depending on how you assign future performance to “rejects”: those individuals who didn’t pass your past approval screens, and therefore whose performance is not captured in your development sample. Since improving operational performance depends on the “swap set”—who will you accept that you didn’t previously and vice versa—you need to estimate the unknown performance of the rejects, a process known as reject inference. You can’t do this automatically. It requires a judgment call. Being too optimistic will make the model look great and perform badly. The reverse will lead to lost opportunity.
Finally on this point, when analytics deliver disappointing results, it’s often because there isn’t enough analytic expertise at hand to fully understand what these tools are saying and not saying. As a result, it’s not clear what results need to be tracked and how decisions need to be altered. It’s very hard to create business context through automation.
6. Justify complexity and increase transparency
Businesses are operating in an increasingly complex world, and it follows that analytics must often be complex as well. Nevertheless, analytic complexity must be justified. A senior manager should be able to get a clear answer to “Why does this customer decision need to be so complicated? What value are we getting from it? What are we learning? How is this going to make tomorrow’s decisions better than today?”
Moreover, as analytics become more widely used in business, it must become easier for managers, senior executives and regulators to understand the roles they’re playing in decisions, and how they’re contributing to better results.
“Analytics should be used across the enterprise, but not without
human involvement… Do not discount the human element in
adding value to analytics.”
—Rodney Nelsestuen, Senior Research Director, TowerGroup
April 2010
»
»
insights
For more information»» US toll-free International email web
+1 888 342 6336 +44 (0) 207 940 8718 [email protected] www.fico.com
The Insights white paper series provides briefings on best practices, research findings and product innovations from FICO. To subscribe,
go to www.fico.com/insights.
the decision tree rather than the decision model; and 2) the inefficiencies of the decision tree as a means of representation.
Editing a decision tree of any size is an inherently risky venture. This form of representation is visually complicated, and therefore, working within it, one can easily make mistakes. By comparison, the underlying decision model can be much simpler to understand and change. Edit the decision
model, and you will have a better grasp of the structural reasons for the changes you’re making, and thus can have confidence in the decision tree derived from it, no matter how complex.
When it’s necessary to edit or “prune back” the resulting decision tree a bit, you need tools that help you navigate across it to focus in on just the places requiring attention. You also need tools that help you understand how much fidelity to the decision model you’re giving up by making these edits.
The best tools also enable you to compare the original decision strategy to the changed strategy. Starting with the decision model, you understand the structural reasons for the changes. Comparing the trees then shows you the differences in the decision logic. This just isn’t possible when comparing “raw” trees with anything beyond a small number of nodes, and it’s not unusual to have trees with many thousands of nodes, hence the magnitude of the problem.
In the post-crisis era, the companies that succeed with analytics won’t be those that simply use more of them, they’ll be those that use them in the smart ways I’ve outlined. Above all, to really succeed with analytics, you need to understand the context of the data, the operational context of the decision and the underlying business relationships that you’re modeling. I don’t believe you can do that by going click-click-click.
Dr. Andrew Jennings is a Senior Vice President and Chief Research Officer at FICO. Since joining FICO in 1994, he has worked with many leading banks worldwide, and previously has held senior analytics positions at Barclays and Abbey. He has a Ph.D. in economics from the University of Nottingham.
»
Conclusion
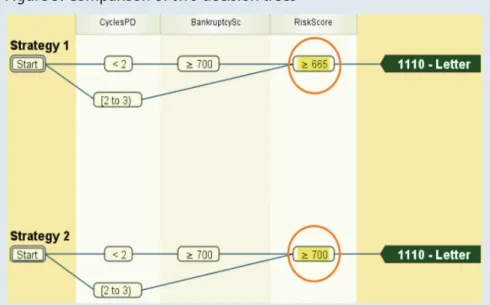
Figure 5: Comparison of two decision trees
New strategy design tools simplify the visualization of complex strategies. This helps in the comparison of different strategies, such as in this example, which highlights the score cutoff change difference in two collection strategies.
Learn more about analytic innovations that raise performance in dynamic times:
• Outliers Find Fraud in Fast-Changing Markets • How Do Economic Changes Impact Consumer Risk? • How Much Credit Is Too Much?