National Institute of Standards and Technology
Technology Administration, U.S. Department of Commerce
NISTIR 6770
An Approach for Measuring Reductions in
Operations, Maintenance, and Energy Costs for
Educational Facilities
Robert E. Chapman
Office of Applied Economics
Building and Fire Research Laboratory Gaithersburg, Maryland 20899
An Approach for Measuring Reductions in
Operations, Maintenance, and Energy Costs for
Educational Facilities
Robert E. Chapman
Sponsored by:
National Institute of Standards and Technology Building and Fire Research Laboratory
and
Subcommittee on Construction and Building Committee on Technology
National Science and Technology Council Office of Science and Technology Policy 1600 Pennsylvania Avenue, NW
Washington, DC 20502
January 2002
U.S. DEPARTMENT OF COMMERCE Donald L. Evans, Secretary
TECHNOLOGY ADMINISTRATION Philip J. Bond, Under Secretary for Technology
NATIONAL INSTITUTE OF STANDARDS AND TECHNOLOGY Arden L. Bement, Jr., Director
U.S. Department of Commerce Technology Administration
National Institute of Standards and Technology
Office of Applied Economics
Building and Fire Research Laboratory Gaithersburg, MD 20899
iii
Abstract
The Construction and Building Subcommittee of the National Science and Technology Council is developing baseline measures of current construction industry practices and measures of progress with respect to each of the seven National Construction Goals. The seven National Construction Goals are concerned with: (1) reductions in the delivery time of constructed facilities; (2) reductions in operations, maintenance, and energy costs; (3) increases in occupant productivity and comfort; (4) reductions in occupant-related illnesses and injuries; (5) reductions in waste and pollution; (6) increases in the durability and flexibility of constructed facilities; and (7) reductions in construction worker illnesses and injuries. This report provides a detailed set of baseline measures for National Construction Goal 2 (reductions in operations, maintenance, and energy costs) for educational facilities. As such, it describes data sources, data classifications, and the metrics used to develop the baseline measures. Extensive use of charts and tables is made throughout this document to illustrate the process by which the baseline measures were developed.
Keywords
building economics; construction; costs; economic analysis; educational facilities; energy costs; maintenance costs; metrics; operations costs
v
Preface
This study was conducted by the Office of Applied Economics in the Building and Fire Research Laboratory (BFRL) at the National Institute of Standards and Technology (NIST). The study was sponsored by the Construction and Building Subcommittee of the National Science and Technology Council. The BFRL project, of which this study is a part, seeks to develop baseline measures and measures of progress with respect to each of the seven National Construction Goals. These measures are to be disseminated both through publications and, ultimately, electronically via the World Wide Web. The intended audience for this report is the Construction and Building Subcommittee member organizations as well as construction industry representatives and other interested parties.
vii
Acknowledgments
The author wishes to thank all those who contributed so many excellent ideas and suggestions that he has attempted to incorporate into this report. The author wishes to thank Dr. Jack E. Snell and Mr. John Talbott, Co-Chairs of the Construction and Building Subcommittee, and Dr. Andrew J. Fowell, Secretariat of the Construction and Building Subcommittee, for their guidance, suggestions, and support. Special appreciation is extended to Drs. Harold E. Marshall and Sieglinde K. Fuller of the Office of Applied Economics at NIST’s Building and Fire Research Laboratory (BFRL) for the thoroughness of their reviews and for their many insights and to Ms. Catherine Linthicum and Mrs. J’aime Maynard for their assistance in preparing the manuscript for review and publication. Special appreciation is also extended to Messrs. Karthy Kasi and Daniel Cardy, formerly with BFRL’s Office of Applied Economics, who helped immensely with the data collection and analysis effort during their summer internships. Thanks are also due to Ms. Christine Izzo of BFRL's Office of Applied Economics for her comments on the earlier drafts of this report and for her assistance in interpreting the results of the data analysis effort.
ix
Table of Contents
Abstract... iii Preface...v Acknowledgments... vii List of Figures... xiList of Tables ... xii
List of Acronyms ... xiii
Executive Summary ...xv
1. Introduction...1
1.1 Background... 1
1.2 Purpose... 2
1.3 Scope and Approach ... 3
2. The National Construction Goals: A Tool for Promoting Competitiveness Within the Construction Industry ...5
2.1 Description of the National Construction Goals... 5
2.2 Baseline Measures ... 8
2.3 How This Document Helps... 8
3. Overview of the Construction Industry...11
3.1 Value of Construction Put in Place... 12
3.2 Overview of the Commercial/Institutional Sector ... 17
3.3 Characteristics of Educational Facilities... 21
4. OM&E Measures for Educational Facilities...29
4.1 Data Considerations: Sources, Availability, and Constraints ... 29
4.2 Baseline Measures for Educational Facilities ... 32
4.2.1 Baseline Measures for K-12 Facilities... 32
4.2.2 Baseline Measures for College and University Facilities ... 34
4.2.3 Energy Conservation in Educational Facilities... 42
4.3 Summary of Baseline Measures for Educational Facilities ... 51
5. Summary and Suggestions for Further Research...53
x
5.2 Suggestions for Further Research ... 53 References...55
xi
List of Figures
Figure 3-1. 1997 Breakdown of $657 Billion Construction Market...18
Figure 3-2. 1997 Breakdown of $206 Billion Commercial/Institutional Sector ...20
Figure 3-3. Total Number of Educational Facilities by Size Category: 1995 ...23
Figure 3-4. Total Educational Floorspace by Building Size Category: 1995 ...23
Figure 3-5. Total Educational Floorspace by Building Size Category and Number of Floors: 1995...24
Figure 3-6. Total Number of Educational Facilities by Year of Construction: 1995...26
Figure 3-7. Total Educational Floorspace by Year of Construction: 1995...26
Figure 3-8. Total Educational Floorspace by Year of Construction and Number of Floors: 1995...27
Figure 4-1. Distribution of Major Repair Costs by Building Element Over a 50-Year Period ...34
Figure 4-2. Selected Annual Operations Costs for College and University Facilities...38
Figure 4-3. Annual Building and Custodial Maintenance Costs for Colleges and Universities by Number of Students ...38
Figure 4-4. Annual Electricity Cost by Funding Source for Colleges and Universities ...39
Figure 4-5. Annual Mean Gas Cost by Funding Source for Colleges and Universities ...39
Figure 4-6. Sum of Annual Major Fuel Expenditures of Educational Facilities by Building Size Category...43
Figure 4-7. Sum of Annual Major Fuel Expenditures of Educational Facilities by Year of Construction...43
Figure 4-8. Heating Equipment Usage in Educational Buildings by Building Size Category...45
xii
Figure 4-9 Building Cooling Equipment Usage in Educational Buildings by
Building Size Category...46 Figure 4-10. Building Lighting Equipment Usage in Educational Buildings by
Building Size Category...47 Figure 4-11. Educational Facilities Shell Conservation Features by Building
Size Category...48 Figure 4-12. Educational Facilities HVAC Conservation Features by Building
Size Category...49 Figure 4-13. Educational Facilities Lighting Conservation Features by Building
Size Category...50
List of Tables
Table 3-1. Value of Construction Put in Place in Millions of Constant 1997
Dollars...14 Table 3-2. Value of Construction Put in Place in Millions of Current Dollars ...15 Table 3-3. Value of Construction Put in Place: Sector Totals and Sum Total in
Millions of Constant 1997 Dollars...16 Table 3-4. Value of Construction Put in Place: Sector Totals and Sum Total in
Millions of Current Dollars...17 Table 4-1. Annual Operations, Maintenance, and Energy Costs for K-12
Facilities...33 Table 4-2. Most Costly Major Repair Tasks Over a 50 Year Period...35 Table 4-3. Annual Operations, Maintenance, and Energy Costs for College and
University Facilities ...36 Table 4-4. Selected Annual Operations Costs for College and University
Facilities by Funding Source, Region, and Number of Students...37 Table 4-5. Annual Mean Electricity Usage for College and University Facilities
xiii
Table 4-6. Annual Mean Gas Consumption for College and University
Facilities by Funding Source, Region, and Number of Students...41 Table 4-7. Summary of OM&E Baseline Measures for Educational Facilities...52
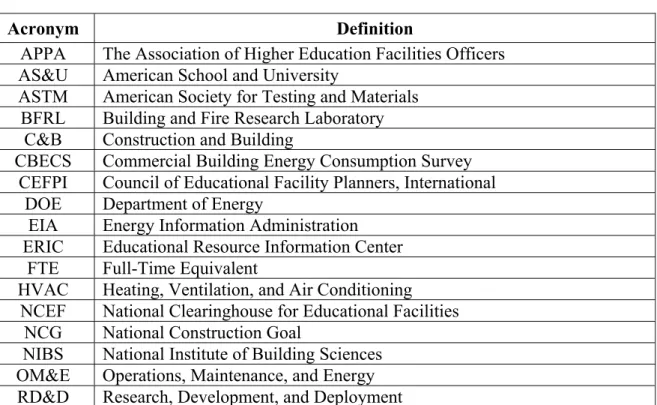
List of Acronyms
Acronym Definition
APPA The Association of Higher Education Facilities Officers
AS&U American School and University
ASTM American Society for Testing and Materials
BFRL Building and Fire Research Laboratory
C&B Construction and Building
CBECS Commercial Building Energy Consumption Survey
CEFPI Council of Educational Facility Planners, International
DOE Department of Energy
EIA Energy Information Administration
ERIC Educational Resource Information Center
FTE Full-Time Equivalent
HVAC Heating, Ventilation, and Air Conditioning
NCEF National Clearinghouse for Educational Facilities
NCG National Construction Goal
NIBS National Institute of Building Sciences
OM&E Operations, Maintenance, and Energy
xv
Executive Summary
The National Science and Technology Council, a cabinet-level group chaired by the President, is charged with setting federal technology policy and coordinating R&D strategies across a broad cross-section of public and private interests. It has established nine research and development committees, including the Committee on Technology (CT), to collaborate with the private sector in developing a comprehensive national technology policy. The purpose of CT is to enhance the international competitiveness of US industry through federal technology policies and programs. The Construction and Building Subcommittee of CT coordinates and defines priorities for federal research, development, and deployment related to the industries that produce, operate, and maintain constructed facilities, including buildings and infrastructure.
The mission of the Construction and Building Subcommittee is to enhance the competitiveness of the US industry, public safety, and environmental quality through research and development, in cooperation with US industry, labor, and academia, for improvement of the life cycle performance of constructed facilities. To accomplish its mission, the Construction and Building Subcommittee has established seven National Construction Goals in collaboration with a broad cross section of the construction industry.
Data describing current practices of the US construction industry are needed to establish baselines against which the industry can measure its progress towards achieving the seven National Construction Goals. The Goals are: (1) reductions in the delivery time of constructed facilities; (2) reductions in operations, maintenance, and energy costs; (3) increases in occupant productivity and comfort; (4) reductions in occupant-related illnesses and injuries; (5) reductions in waste and pollution; (6) increases in the durability and flexibility of constructed facilities; and (7) reductions in construction worker illnesses and injuries. Baseline measures and measures of progress will be produced for each National Construction Goal in each of the four key construction industry sectors. The four sectors are: (1) residential; (2) commercial/institutional; (3) industrial; and (4) public works.
This document provides a detailed set of baseline measures for National Construction Goal 2 (reductions in operations, maintenance, and energy costs) for educational facilities. Industry performance in 1994 is used as the reference point from which the values of the baseline measures are calculated. Goal 2 was identified as one of the highest priority National Construction Goals by the construction industry.
This document has five chapters. Chapter 1 explains the purpose, scope, and general approach. Chapter 2 introduces the National Construction Goals, describes how a well-defined set of metrics is used to develop the baseline measures, and outlines the project approach. Chapter 3 provides an overview of the construction industry. The overview provides the context within which the baseline measures are developed. Chapter 4
xvi
presents the baseline measures. Chapter 5 concludes the document with a summary and suggestions for further research.
Chapter 2 provides perspective on the overall effort to develop baseline measures for each of the seven National Construction Goals. First, each National Construction Goal is introduced and described. Next, the process for developing baseline measures for each Goal is described. This process involves: (1) specifying data relationships; (2) collecting and compiling the key data and supporting information for the base year, 1994; (3) defining metrics for each goal/sector combination; and (4) producing the metrics in a summary form (i.e., figures and tables to depict the metrics). Criteria are then presented
which ensure that the data selected for analysis are well defined, consistent, and
replicable. The chapter also outlines a strategy for using the baseline measures to drive performance improvement.
Chapter 3 provides a snapshot of the US construction industry. It provides the context within which the baseline measures are developed. An extensive set of statistics has been compiled on each sector; many of these statistics are included in Chapter 3. These statistics are useful not only as a tool for defining the baseline measures but also as a resource reference for readers with a wide variety of interests in the construction industry. Information is first presented on the value of construction put in place to show the size of the construction industry and each of its four sectors. The four sectors are residential, commercial/institutional, industrial, and public works. Information on the commercial/ institutional sector is then presented to focus on its importance within the overall construction industry and to define its key components. Educational facilities are shown to be a key component of the commercial/institutional sector. Special emphasis is then placed on detailing the key characteristics of educational facilities (e.g., building floorspace and year of construction). Detailing the key characteristics of educational facilities is crucial because investments in these facilities affect not only new construction activities, but additions and alterations and maintenance and repair activities as well. The construction industry is a key component of the US economy. A key indicator of construction activity is the value of construction put in place. Data published by the US Bureau of the Census are used to establish the composition of construction expenditures by type of construction. These expenditures are then assigned to one of the four key construction industry sectors.
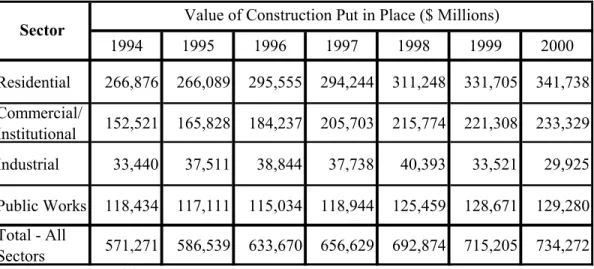
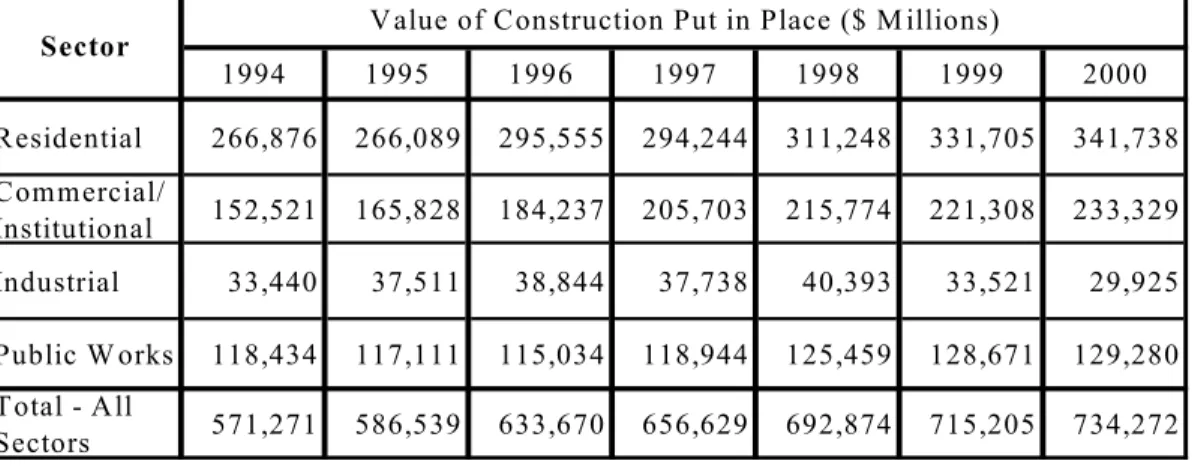
Table ES-1 summarizes both the annual sector totals and the sum total. Since 1994, the value of construction put in place has risen from $571.3 billion in 1994 to $734.3 billion in 2000 in constant 1997 dollars. The largest component of construction over this period was in the residential sector (about 45 percent of the total), with the smallest component in the industrial sector (about 6 percent).
xvii
Table ES-1. Value of Construction Put in Place in Millions of 1997 Dollars: Sector Totals and Sum Total
Source: US Bureau of the Census.
Chapter 4 presents the baseline measures. These measures are based on data published by four sources: (1) the Energy Information Administration (EIA), a part of the US Department of Energy (DOE); (2) the Association of Higher Education Facilities Officers (APPA); (3) the American School & University (AS&U) Magazine; and (4) Whitestone Research. Section 4.1 describes each of the data sets. The baseline measures are reported and described in Section 4.2. Section 4.2.1 covers K-12 facilities. Section 4.2.2 covers college and university facilities. Section 4.2.3 uses data from the EIA’s Commercial Buildings Energy Consumption Survey (CBECS) to establish the national average energy cost per unit of floor area and the rates of utilization of energy conserving features and practices. The chapter concludes with a summary of the various baseline measures for operations, maintenance, and energy (OM&E) costs for educational facilities.
Because the OM&E baseline measures presented in Chapter 4 are drawn from several key documents, a comprehensive list of OM&E cost components are identified and defined. These components include the following:
• administration - includes all administrative costs for the facility including payroll costs, equipment, supplies, communications, computer rental, accounting costs, and training costs
• work control - includes all costs necessary for the proper planning, scheduling, and dispatching of maintenance work, including payroll, database maintenance, supervision, and cost estimation
• engineering/architecture - includes all design and engineering costs
• project management - includes all costs associated with actual estimating, contracting, inspecting, and final approval of new or renovated construction
• building maintenance - includes in-house and contracted services for routine repairs, minor corrective maintenance, preventive maintenance and service calls for HVAC, plumbing, electrical, painting, glazing, and elevators
1994 1995 1996 1997 1998 1999 2000 Residential 266,876 266,089 295,555 294,244 311,248 331,705 341,738 Commercial/ Institutional 152,521 165,828 184,237 205,703 215,774 221,308 233,329 Industrial 33,440 37,511 38,844 37,738 40,393 33,521 29,925 Public Works 118,434 117,111 115,034 118,944 125,459 128,671 129,280 Total - All Sectors 571,271 586,539 633,670 656,629 692,874 715,205 734,272 Sector Value of Construction Put in Place ($ Millions)
xviii
• custodial maintenance - includes interior and exterior functions such as window and building cleaning, snow removal, and operating costs such as towels
• grounds maintenance - includes landscaping and grounds maintenance costs for parking areas, irrigation systems, and fencing
• utilities operations - includes all costs for heating, cooling, lighting, and other utilities for physical plant operations, excluding cost of fuel and purchased utilities • solid waste disposal - includes all costs associated with refuse removal
• hazardous waste disposal - includes all costs associated with hazardous waste removal
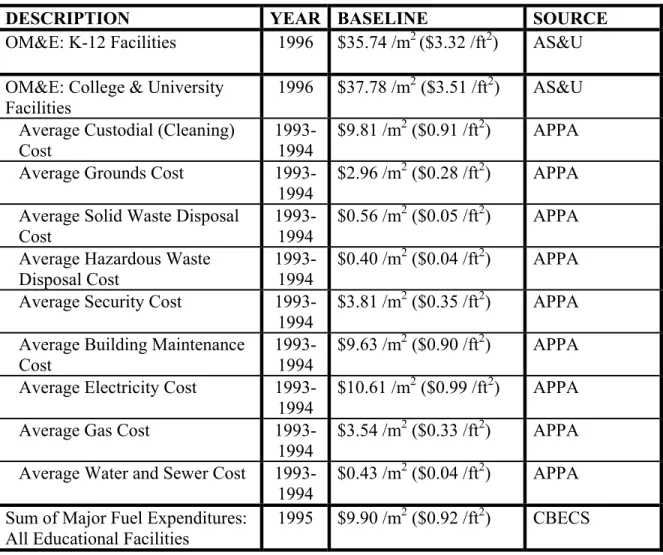
• security - includes all security expenses such as traffic, parking, and building security Table ES-2 summarizes the baseline measures for educational facilities that are presented in Sections 4.2.1, 4.2.2, and 4.2.3 of this document. The table is organized to serve as a quick reference; it includes a brief description of each measure, the year for the data, the value of the measure in dollars per square meter ($/m2) and dollars per square foot( $/ft2), and the source of the data. Two sets of summary OM&E measures are presented first— one for K-12 facilities and one for college and university facilities—followed by a more detailed set of measures.
Chapter 5 discusses additional areas of research that might be of value to government agencies and private bodies who are concerned about reducing operations, maintenance, and energy costs in educational facilities. These areas of research are concerned with: (1) the dissemination of more detailed information on building characteristics and energy consumption by EIA that would facilitate the construction of measures for K-12 facilities and for college and university facilities rather than general measures for educational facilities as a whole; and (2) the measurement and evaluation of progress toward achievement of National Construction Goals 2 in educational facilities.
xix
Table ES-2. Summary of OM&E Baseline Measures for Educational Facilities
DESCRIPTION YEAR BASELINE SOURCE
OM&E: K-12 Facilities 1996 $35.74 /m2 ($3.32 /ft2) AS&U
OM&E: College & University Facilities
1996 $37.78 /m2 ($3.51 /ft2) AS&U Average Custodial (Cleaning)
Cost
1993-1994
$9.81 /m2 ($0.91 /ft2) APPA
Average Grounds Cost
1993-1994
$2.96 /m2 ($0.28 /ft2) APPA
Average Solid Waste Disposal Cost
1993-1994
$0.56 /m2 ($0.05 /ft2) APPA
Average Hazardous Waste Disposal Cost
1993-1994
$0.40 /m2 ($0.04 /ft2) APPA
Average Security Cost
1993-1994 $3.81 /m
2 ($0.35 /ft2) APPA
Average Building Maintenance
Cost 1993-1994 $9.63 /m
2 ($0.90 /ft2) APPA
Average Electricity Cost
1993-1994 $10.61 /m
2 ($0.99 /ft2) APPA
Average Gas Cost
1993-1994
$3.54 /m2 ($0.33 /ft2) APPA
Average Water and Sewer Cost
1993-1994
$0.43 /m2 ($0.04 /ft2) APPA
Sum of Major Fuel Expenditures: All Educational Facilities
1
1. Introduction
1.1 BackgroundThe National Science and Technology Council, a cabinet-level group chaired by the President, is charged with setting federal technology policy and coordinating R&D strategies across a broad cross-section of public and private interests. It has established nine research and development committees, including the Committee Technology (CT), to collaborate with the private sector in developing a comprehensive national technology policy. The purpose of CT is to enhance the international competitiveness of US industry through federal technology policies and programs. The Construction and Building Subcommittee of CT coordinates and defines priorities for federal research, development, and deployment related to the industries that produce, operate, and maintain constructed facilities, including buildings and infrastructure.1
The mission of the Construction and Building Subcommittee is to enhance the competitiveness of US industry, public safety, and environmental quality through research and development, in cooperation with US industry, labor, and academia, for improvement of the life cycle performance of constructed facilities. To accomplish its mission, the Construction and Building Subcommittee has established seven National Construction Goals in collaboration with a broad cross section of the construction industry.2
Data describing current practices of the US construction industry are needed to establish baselines against which industry can measure its progress towards achieving the seven National Construction Goals. The seven National Construction Goals are concerned with: (1) reductions in the delivery time of constructed facilities; (2) reductions in operations, maintenance, and energy costs; (3) increases in occupant productivity and comfort; (4) reductions in occupant-related illnesses and injuries; (5) reductions in waste and pollution; (6) increases in the durability and flexibility of constructed facilities; and (7) reductions in construction worker illnesses and injuries.
Although information having relevance to the seven goals is available, for the most part, this information has such a narrow focus that a consistent set of baseline measures and associated measures of progress cannot be produced without first conducting a significant research effort. Specifically, information from a wide variety of data sets needs to be collected, reviewed, analyzed, and critiqued to ensure that the baseline measures and measures of progress which result are:
1 Wright, Richard N. 1995. "Government and Industry Working Together." Construction Business Review
(January/February): pp. 44-49.
2 Wright, Richard N., Arthur H. Rosenfeld, and Andrew J. Fowell. 1995. Construction and Building:
Federal Research and Development in Support of the US Construction Industry. Washington, DC:
2
(1) adequate (i.e., they not only capture the complexities of the US construction
industry, but also represent a consensus among experts in the field); and (2) suitable for dissemination to the public.
It is essential to have baseline data and associated measures of progress to determine the success of actions taken to improve the competitiveness of the US construction industry. In addition, baselines and measures of progress will make it possible to demonstrate the benefits of advanced technologies and practices, and to guide decision makers in prioritizing potential programs.
The goal of this project is to develop a suite of products that support the measurement and attainment of the National Construction Goals by the four key construction industry sectors. The four industry sectors are: (1) residential; (2) commercial/institutional; (3) industrial; and (4) public works. Three basic sets of products are envisioned:
(1) Baseline Measures: Develop baseline measures that characterize current industry performance with respect to each of the seven goals. The averages of current practice (defined in this document as industry performance in 1994) will become the baselines for measuring progress towards achieving each of the goals.
(2) Measures of Progress: Develop methods for measuring progress. These “results” measures are envisioned as a composite of performance measures offering a means not only for monitoring actual performance, but also for marshaling support for improving results.
(3) Periodic Reports: Provide information on each of the seven goals. This information will be made available to interested parties both through publications and, ultimately, electronically via the World Wide Web.
1.2 Purpose
The purpose of this document is to provide a detailed set of baseline measures for National Construction Goal 2 (reductions in operations, maintenance, and energy costs) for educational facilities. As such, it describes data sources, data classifications, and the metrics used to develop the baseline measures. Extensive use of charts and tables is made throughout this document to illustrate the process by which the baseline measures were developed. The focus of this document is on educational facilities. Readers wishing a comprehensive set of baseline measures for each sector of the construction industry are referred to a companion document.3
3 Chapman, Robert E., and Roderick Rennison. 1998. An Approach for Measuring Reductions in
Operations, Maintenance, and Energy Costs: Baseline Measures of Construction Industry Practices for the
National Construction Goals. NISTIR 6185, Gaithersburg, MD: National Institute of Standards and
3
The intended audience for this document is the Construction and Building Subcommittee member organizations,4 four private sector organizations with interest in specific building
sectors,5 designers and managers of educational facilities, construction industry
representatives, and other interested parties. In addition, because this document includes both detailed information on the baseline measures for National Construction Goal 2 and a compilation of statistics on the four sectors and the construction industry as a whole, it is anticipated that this document will serve as a resource reference for readers with a wide variety of interests in the construction industry.
1.3 Scope and Approach
This document has four chapters in addition to the Introduction. Chapter 2 introduces the National Construction Goals and describes how a well-defined set of metrics is used to develop the baseline measures. Chapter 3 provides an overview of the construction industry. The overview provides the context within which the baseline measures are developed. Chapter 4 presents the baseline measures for educational facilities. Key baseline measures are summarized in Table 4-7, which appears at the end of Chapter 4. Chapter 5 concludes the document with a summary and suggestions for further research.
4 The following Federal Agencies are members of the Construction and Building Subcommittee:
Department of Agriculture, Department of Commerce, Department of Defense, Department of Education, Department of Energy, Department of Health and Human Services, Department of Housing and Urban Development, Department of Interior, Department of Labor, Department of Transportation, Department of Veterans Affairs, Environmental Protection Agency, General Services Administration, National Aeronautics and Space Administration, and National Science Foundation.
5 The four private sector organizations are: (1) National Association of Home Builders Research Center
(residential); (2) National Institute of Building Sciences (commercial/institutional); (3) Construction Industry Institute (industrial); and (4) American Public Works Association (public works).
5
2. The National Construction Goals: A Tool for Promoting
Competitiveness Within the Construction Industry
2.1 Description of the National Construction GoalsThe Construction and Building (C&B) Subcommittee has studied research priorities expressed by the construction industry. These priorities translate into the following seven National Construction Goals:
1. 50 % Reduction in Delivery Time
2. 50 % Reduction in Operation, Maintenance, and Energy Costs
3. 30 % Increase in Productivity and Comfort
4. 50 % Fewer Occupant-Related Illnesses and Injuries
5. 50 % Less Waste and Pollution
6. 50 % More Durability and Flexibility
7. 50 % Reduction in Construction Worker Illnesses and Injuries
To make the National Construction Goals operational, they are based on the values of a well-defined set of baseline measures. The values of the baseline measures for each goal are averages of industry performance in 1994. The year 1994 was established as the basis for computing the values of the baseline measures because it was the year when the National Construction Goals were first formulated.6
Two priority thrusts—better constructed facilities, and improved health and safety of the construction work force—were defined as the focus of C&B-related research, development, and deployment (RD&D) activities. The objective of the C&B-related RD&D activities is to make technologies and practices capable of achieving the goals under the two priority thrusts available for general use in the construction industry by 2003.
Achievement of the National Construction Goals will: (1) reduce the first costs and life-cycle costs of constructed facilities in the four key construction industry sectors (i.e., residential, commercial/institutional, industrial, and public works); (2) result in better constructed facilities; and (3) result in improved health and safety for both construction workers and occupants of constructed facilities. Achievement of the goals will convey benefits to each of the four construction industry sectors (e.g., housing will become more affordable through reductions in first costs and life-cycle costs). However, depending on the goal and the construction industry sector, the beneficial impacts are expected to vary. To gain a better appreciation of the importance of the National Construction Goals, both individually, and taken together, and of their relationship to the four key construction
6 Wright, Richard N., Arthur H. Rosenfeld, and Andrew J. Fowell. 1994. Rationale and Preliminary Plan
for Federal Research for Construction and Building. NISTIR 5536. Washington, DC: National Science
6
industry sectors, a brief description of each goal follows. The descriptions are patterned after those given in the report by Wright, Rosenfeld, and Fowell.7
Goal 1: 50 % Reduction in Delivery Time
Delivery time is defined as the elapsed time from the decision to construct a new facility until its readiness for service. Delivery time issues affect both industrial competitiveness and project costs. During the initial planning, design, procurement, construction, and start-up process, the needs of the client are not being met. Furthermore, the client’s needs evolve over time, so a facility long in delivery may be uncompetitive or unsuitable when it is finished. Delays almost always translate into increased project costs due to inflationary effects, higher financial holding costs, and reduced productivity. Furthermore, the investments in producing the facility cannot be recouped until the facility is operational. Owners, users, designers, and constructors are among the groups calling for technologies and practices to reduce delivery time.
Goal 2: 50 % Reduction in Operations, Maintenance, and Energy Costs
Operations, maintenance, and energy (OM&E) costs are a major factor in the life-cycle costs of a constructed facility. In some cases, OM&E costs over the life of a facility exceed its first cost. However, because reductions in OM&E costs are often associated with increased first costs, facility owners and managers may under-invest in cost saving technologies. Furthermore, undue attention on minimizing first costs may result in a facility which is expensive to operate and maintain, wastes energy resources, is inflexible, and rapidly becomes obsolete. Finally, because OM&E costs tend to increase more rapidly than the general rate of inflation, facility owners and operators are often forced to reallocate funds to cover OM&E costs. Reductions in OM&E costs will produce two types of benefits. First, constructed facilities will become more affordable because facility owners and operators are making more cost-effective choices among investments (e.g., design configurations) which affect life-cycle costs. Second, these same facilities will better conserve scarce energy resources.
Goal 3: 30 % Increase in Productivity and Comfort
Industry and government studies have shown that the annual salary costs of the occupants of a commercial or institutional building are of the same order of magnitude as the capital
cost of the building.8 Occupant comfort depends largely on the nature of buildings,
building furnishings, and indoor environments. The quality of indoor environments also has a large impact on occupant health and productivity. Improvement of the productivity of the occupants (or for an industrial facility, improvement of the productivity of the
7 Wright, Richard N., Arthur H. Rosenfeld, and Andrew J. Fowell. 1995. Construction and Building:
Federal Research and Development in Support of the US Construction Industry. Washington, DC:
National Science and Technology Council.
8 Building Owners and Managers Association. 1994. Experience Exchange Report, National
7
process housed by the facility) is an important performance characteristic for most constructed facilities.
Goal 4: 50 % Fewer Occupant-Related Illnesses and Injuries
Buildings are intended to shelter and support human activities, yet the environment and performance of buildings can contribute to illnesses and injuries for building users. Examples are avoidable injuries caused by fire, natural hazards, slips, and falls; disease from airborne microbes, often associated with a workplace environment; and building damage or collapse from fire, earthquakes, or extreme winds. Reductions in illnesses and injuries will increase building users’ productivity as well as reduce the costs of medical care and litigation.
Goal 5: 50 % Less Waste and Pollution
Improvement of the performance of constructed facilities provides major opportunities to reduce waste and pollution at every step of the delivery process, from raw material extraction to final demolition and recycling of the facility and its contents. Additional reductions come from reduced energy use, reduced water consumption, and reductions in waste water production, which are considered in part by Goal 2.
Goal 6: 50 % More Durability and Flexibility
Durability denotes the capability of the constructed facility to continue (given appropriate maintenance) its initial performance over the intended service life. Flexibility denotes the capability to adapt the constructed facility to changes in use or users’ needs. Increased durability and flexibility of constructed facilities reduces life-cycle costs and prolongs the economic life of the facility (i.e., the period of time over which an investment in the original facility is considered to be the least-cost alternative for meeting a particular objective).
Goal 7: 50 % Reduction in Construction Worker Illnesses and Injuries
Health and safety issues exert a major effect on the competitiveness of the US construction industry. Construction workers die as a result of work-related trauma at a rate which is higher than all other industries except mining and agriculture. Construction workers also experience a higher incidence of nonfatal injuries resulting in days away from work than workers in other industries do. Although the construction workforce represents less than 6 % of the nation’s work force, it is estimated that the construction industry pays about 15 % of the nation’s workers’ compensation.9
9 The Center to Protect Workers’ Rights. 1997. The Construction Chart Book: The US Construction
8
2.2 Baseline Measures
As noted earlier, the baseline measures for each goal are averages of industry performance in 1994. Thus, with regard to the baseline measures, 1994 is the “base year.” Consequently, data from 1994 drive the data collection effort culminating with the development of the baseline measures for each National Construction Goal.
The process for developing baseline measures used in this project involves: (1) specifying data relationships; (2) collecting and compiling the key data and supporting information for the base year, 1994;10 (3) defining metrics for each goal/sector combination; and (4) producing the metrics in a tabular summary form and, where appropriate, producing charts and graphs to depict the metrics. If the goal/sector combination has components and subcomponents, then metrics are defined for each. This process is employed because the metrics represent not only a statement of current construction industry performance, but tools for measuring an individual organization’s performance as well. By providing a small set of well-defined metrics, individual organizations can construct their own performance baselines. For example, individual organizations can see how a collection of their projects performs vis-à-vis the “national” data. To summarize, the basic philosophy behind the baseline measures is that they are not a static tool whose sole purpose is quantifying the value of the goal, but a means for driving performance improvement within individual organizations.
Criteria are needed to ensure that the data selected for analysis are well-defined,
consistent, and replicable. Because data are so important to the baseline measures for each goal, BFRL reviewed many potential sources (e.g., journals, technical publications, and electronic media) of baseline-related data/information. This review suggested three criteria which must be met by any data in order to be accepted for analysis. These criteria are:
(1) Published by a reliable, nationally-recognized organization and available to the
public;
(2) Updated on a regular basis; and
(3) Able to be normalized to account for changes in the building stock and the level
of construction activity.
2.3 How This Document Helps
This document is part of a series. As such, it provides perspective on the overall effort to develop baseline measures and measures of progress for each of the seven National
10 If data are available for years in addition to 1994, then these data are collected at the same time as the
base year data and used to illustrate trends; these data are also used to compute the associated measures of progress.
9
Construction Goals.11 It also serves to highlight how these measures and their associated metrics can be used to drive performance improvement.
On a deeper level, this document provides step-by-step descriptions of how to construct a well-defined set of baseline measures, their components, and associated metrics for the specific goal of reducing operations, maintenance, and energy costs for educational facilities. Information on data classification, data sources, and data collection and analysis provide the underpinnings for the results presented in this document. It is anticipated that once users of this document have understood the vital role of metrics as a process improvement tool, they will see how the National Construction Goals will benefit both their organization and the US construction industry.
11 Three earlier companion documents focused on National Construction Goals 1, 2, and 7. For information
on reductions in delivery time (Goal 1), see Chapman, Robert E., and Roderick Rennison. 1998. An Approach for Measuring Reductions in Delivery Time: Baseline Measures of Construction Industry
Practices for the National Construction Goals. NISTIR 6189. Gaithersburg, MD: National Institute of
Standards and Technology. For information on reductions in operations, maintenance, and energy costs (Goal 2), see Chapman, Robert E., and Roderick Rennison. 1998. An Approach for Measuring Reductions in Operations, Maintenance, and Energy Costs: Baseline Measures of Construction Industry Practice for
the National Construction Goals. NISTIR 6185 . Gaithersburg, MD: National Institute of Standards and
Technology. For information on reductions in construction worker illnesses and injuries (Goal 7), see Chapman, Robert E. 2000. An Approach for Measuring Reductions in Construction Worker Illnesses and Injuries: Baseline Measures of Construction Industry Practices for the National Construction Goals. NISTIR 6473. Gaithersburg, MD: National Institute of Standards and Technology.
11
3. Overview of the Construction Industry
The construction industry is a key component of the US economy and is vital to its continued growth. Investment in plant and facilities, in the form of construction activity, provides the basis for the production of products and the delivery of services. Investment in infrastructure promotes the smooth flow of goods and services and the movement of individuals. Investment in housing accommodates new households and allows existing households to expand or improve their housing. Clearly, construction activities affect nearly every aspect of the US economy.12
This chapter provides a snapshot of the US construction industry. The chapter contains three sections. Each section deals with a particular topic. The topics progress from general in nature to very specific, as described below.
Section 3.1 presents information on the value of construction put in place to show the size of the construction industry and each of its four sectors. The four sectors, which taken together define the construction industry, are residential, commercial/institutional, industrial, and public works. Data from the past seven years (i.e., 1994 through 2000) are used to highlight the magnitude of construction-related investments in each sector. Data from 1997 are then used to establish the relative shares of construction-related investments for each sector.
Section 3.2 uses information on the commercial/institutional sector both to focus on its importance within the overall construction industry and to define its key components. Information on investment activity, the number of commercial/institutional buildings, and the amount of commercial/institutional floorspace is used to identify both those characteristics that are changing and those that are remaining constant. Educational facilities are a key component of the commercial/institutional sector. Information showing the relative share of construction-related investments in educational facilities vis-à-vis the other components of the commercial/institutional sector is also presented. Section 3.3 places special emphasis on identifying and detailing the key characteristics of educational facilities. Information detailing key characteristics of educational facilities (e.g., building floorspace and year of construction) is crucial because investments in these facilities affect not only new construction activities, but additions and alterations and maintenance and repair activities as well.
12 Readers interested in learning more about construction statistics, their sources and interpretation, are
referred to the document by Rogers (Rogers, R. Mark. 1994. Handbook of Key Economic Indicators. Burr Ridge, IL: Irwin Professional Publishing).
12
3.1 Value of Construction Put in Place
This section provides information on a key indicator of construction activity—the value of construction put in place. Data published by the US Bureau of the Census are used to establish the composition of construction expenditures by type of construction/function (e.g., non-residential/office building). These expenditures are then assigned to the four key construction industry sectors. The reference document used throughout this section is the Current Construction Reports series C30 publication Value of Construction Put in Place.13 A brief description of the “C30 report” follows. Special attention is given to the organization of the data in the C30 report and how these data map into the four key construction industry sectors. The section concludes with tabular and graphical summaries of the value of construction put in place.
Construction expenditures data are published monthly in the Current Construction Reports series C30 publication Value of Construction Put in Place. Construction expenditures refer to actual construction rather than planned or just initiated activity. It is noteworthy that the C30 report covers both private residential and non-residential construction activities and public sector construction activities.
The value of construction put in place is a measure of the value of construction installed or erected at a site during a given period. For an individual project, this includes: (1) cost of materials installed or erected; (2) cost of labor and a proportionate share of construction equipment rental; (3) contractor’s profit; (4) cost of architectural and engineering work; (5) miscellaneous overhead and office costs chargeable to the project on the owner’s books; and (6) interest and taxes paid during construction. Expenses do not include the cost of land nor do they include maintenance and repairs to existing structures or service facilities.
The C30 data are compiled via survey and through indirect estimation. In the context of the C30 survey, construction includes the following: (1) new buildings and structures; (2) additions, alterations, conversions, expansions, reconstruction, renovations, rehabilitations, and major replacements (e.g., the complete replacement of a roof or a heating system); (3) mechanical and electrical installations (e.g., plumbing, heating, electrical work, and other similar building services); (4) site preparation and outside construction of fixed structures or facilities (e.g., sidewalks, highways and streets, water supply lines, sewers, and similar facilities which are built into or fixed to the land); (5) installation of boilers, overhead hoists and cranes, and blast furnaces; (6) fixed, largely site-fabricated equipment not housed in a building (e.g., petroleum refineries and chemical plants); and (7) cost and installation of construction materials placed inside a building and used to support production machinery (e.g., concrete platforms, overhead steel girders, and pipes).
13 US Department of Commerce. 2001. Current Construction Reports: Value of Construction Put in
13
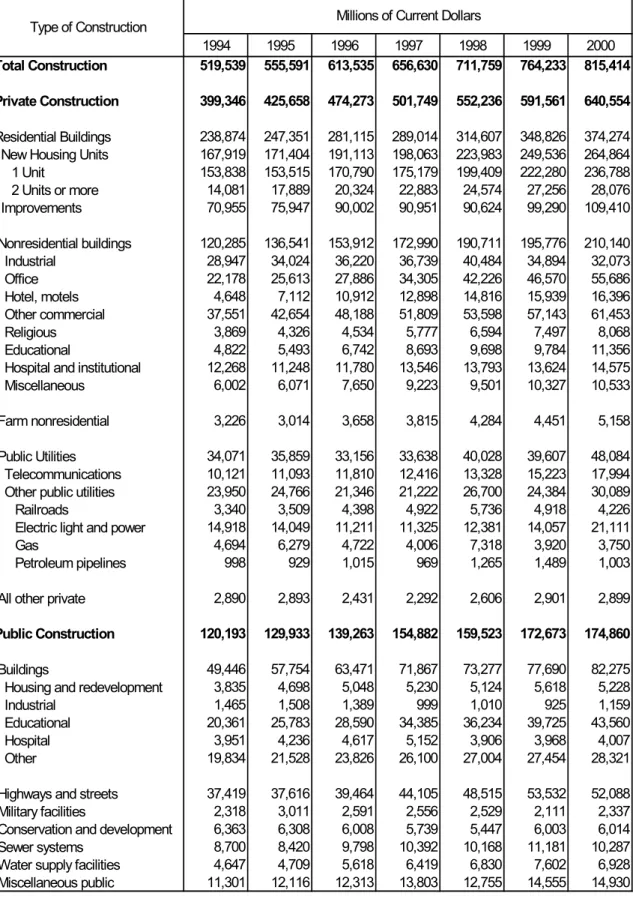
The data presented in the C30 report are summarized in Tables 3-1 and 3-2. To facilitate comparisons between this report and the C30 report, Tables 3-1 and 3-2 use the same row and column headings as are used in the C30 report.
Tables 3-1 and 3-2 record annual values for the years 1994 through 2000. Table 3-1 records annual values in millions of constant 1997 dollars. Table 3-2 records annual
values in millions of current dollars.14 Reference to Table 3-1 reveals that total
construction expenditures in real terms have increased modestly over the seven-year period (i.e., from $571.3 billion to $734.3 billion). When the effects of inflation are included, the rate of increase is more pronounced. Table 3-2 shows total construction expenditures in current dollars.
Tables 3-1 and 3-2 are organized to allow for in-depth analyses of the components/ subcomponents of total construction expenditures. To facilitate such analyses, the data presented in Tables 3-1 and 3-2 are initially divided into two parts: (1) private construction; and (2) public construction.
Private construction contains two major components--residential buildings and non-residential buildings--plus a number of subcomponents. Both the two major components and the various subcomponents are shown as headings in the first column of Tables 3-1 and 3-2.
The residential buildings component includes new private housing and improvements. New private housing includes new houses, apartments, condominiums, and town houses. New private housing units are classified as “1 unit” or “2 or more units.” The value of improvements put in place are a direct measure of the value of residential additions and alterations activities.
The non-residential buildings component includes industrial, office buildings, hotels and motels, and “other commercial” (e.g., shopping centers, banks, service stations, warehouses, and other categories). Also falling under the non-residential buildings component are religious, educational, hospital and institutional, and “miscellaneous” non-residential buildings.
14 Inflation reduces the purchasing power of the dollar over time; deflation increases it. When amounts are
stated in actual prices as of the year in which they occur, they are said to be in current dollars. Current dollars are dollars of any one year’s purchasing power, inclusive of inflation/deflation. That is, they reflect changes in purchasing power of the dollar from year to year. In contrast, constant dollars are dollars of uniform purchasing power, exclusive of inflation/deflation. Constant dollars indicate what the same good or service would cost at different times if there were no change in the general price level to change the purchasing power of the dollar. For additional information on conducting economic analyses using either constant dollars or current dollars, see Fuller, Sieglinde K., and Stephen R. Petersen. 1996. Life-Cycle
Costing Manual for the Federal Energy Management Program. NIST Handbook 135. Gaithersburg, MD:
14
Table 3-1. Value of Construction Put in Place in Millions of Constant 1997 Dollars
1994 1995 1996 1997 1998 1999 2000 571,271 586,538 633,670 656,630 692,876 715,203 734,273 439,110 449,367 489,838 501,749 537,585 553,609 576,813 262,659 261,129 290,341 289,014 306,260 326,447 337,030 184,639 180,951 197,385 198,063 218,041 233,527 238,508 169,156 162,066 176,395 175,179 194,119 208,020 213,225 15,483 18,885 20,991 22,883 23,922 25,507 25,282 78,020 80,177 92,956 90,951 88,220 92,920 98,523 132,262 144,146 158,963 172,990 185,651 183,216 189,229 31,829 35,919 37,409 36,739 39,410 32,655 28,881 24,386 27,040 28,801 34,305 41,106 43,582 50,145 5,111 7,508 11,270 12,898 14,423 14,916 14,764 41,290 45,030 49,769 51,809 52,176 53,477 55,338 4,254 4,567 4,683 5,777 6,419 7,016 7,265 5,302 5,799 6,963 8,693 9,441 9,156 10,226 13,490 11,875 12,167 13,546 13,427 12,750 13,125 6,600 6,409 7,901 9,223 9,249 9,664 9,485 3,547 3,182 3,778 3,815 4,170 4,165 4,645 37,464 37,856 34,244 33,638 38,966 37,066 43,299 11,129 11,711 12,198 12,416 12,974 14,246 16,203 26,335 26,145 22,047 21,222 25,992 22,820 27,095 3,673 3,704 4,542 4,922 5,584 4,602 3,805 16,403 14,832 11,579 11,325 12,053 13,155 19,010 5,161 6,629 4,877 4,006 7,124 3,669 3,377 1,097 981 1,048 969 1,231 1,393 903 3,178 3,054 2,511 2,292 2,537 2,715 2,611 132,161 137,170 143,833 154,882 155,291 161,595 157,460 54,370 60,971 65,554 71,867 71,333 72,706 74,088 4,217 4,960 5,214 5,230 4,988 5,258 4,708 1,611 1,592 1,435 999 983 866 1,044 22,388 27,219 29,528 34,385 35,273 37,176 39,225 4,344 4,472 4,769 5,152 3,802 3,713 3,608 21,809 22,727 24,608 26,100 26,288 25,693 25,503 41,145 39,711 40,759 44,105 47,228 50,098 46,905 2,549 3,179 2,676 2,556 2,462 1,976 2,104 6,997 6,659 6,205 5,739 5,302 5,618 5,416 9,566 8,889 10,120 10,392 9,898 10,464 9,263 5,110 4,971 5,802 6,419 6,649 7,114 6,239 12,426 12,791 12,717 13,803 12,417 13,621 13,444 Type of Construction Millions of Constant (1997) Dollars
Total Construction Private Construction
Residential Buildings New Housing Units 1 Unit 2 Units or more Improvements Nonresidential buildings Industrial Office Hotel, motels Other commercial Religious Educational
Hospital and institutional Miscellaneous
Farm nonresidential Public Utilities Telecommunications Other public utilities Railroads
Electric light and power Gas
Petroleum pipelines All other private
Public Construction
Buildings
Housing and redevelopment Industrial
Educational Hospital Other
Water supply facilities Miscellaneous public Highways and streets Military facilities
Conservation and development Sewer systems
15
Table 3-2. Value of Construction Put in Place in Millions of Current Dollars
1994 1995 1996 1997 1998 1999 2000 519,539 555,591 613,535 656,630 711,759 764,233 815,414 399,346 425,658 474,273 501,749 552,236 591,561 640,554 238,874 247,351 281,115 289,014 314,607 348,826 374,274 167,919 171,404 191,113 198,063 223,983 249,536 264,864 153,838 153,515 170,790 175,179 199,409 222,280 236,788 14,081 17,889 20,324 22,883 24,574 27,256 28,076 70,955 75,947 90,002 90,951 90,624 99,290 109,410 120,285 136,541 153,912 172,990 190,711 195,776 210,140 28,947 34,024 36,220 36,739 40,484 34,894 32,073 22,178 25,613 27,886 34,305 42,226 46,570 55,686 4,648 7,112 10,912 12,898 14,816 15,939 16,396 37,551 42,654 48,188 51,809 53,598 57,143 61,453 3,869 4,326 4,534 5,777 6,594 7,497 8,068 4,822 5,493 6,742 8,693 9,698 9,784 11,356 12,268 11,248 11,780 13,546 13,793 13,624 14,575 6,002 6,071 7,650 9,223 9,501 10,327 10,533 3,226 3,014 3,658 3,815 4,284 4,451 5,158 34,071 35,859 33,156 33,638 40,028 39,607 48,084 10,121 11,093 11,810 12,416 13,328 15,223 17,994 23,950 24,766 21,346 21,222 26,700 24,384 30,089 3,340 3,509 4,398 4,922 5,736 4,918 4,226 14,918 14,049 11,211 11,325 12,381 14,057 21,111 4,694 6,279 4,722 4,006 7,318 3,920 3,750 998 929 1,015 969 1,265 1,489 1,003 2,890 2,893 2,431 2,292 2,606 2,901 2,899 120,193 129,933 139,263 154,882 159,523 172,673 174,860 49,446 57,754 63,471 71,867 73,277 77,690 82,275 3,835 4,698 5,048 5,230 5,124 5,618 5,228 1,465 1,508 1,389 999 1,010 925 1,159 20,361 25,783 28,590 34,385 36,234 39,725 43,560 3,951 4,236 4,617 5,152 3,906 3,968 4,007 19,834 21,528 23,826 26,100 27,004 27,454 28,321 37,419 37,616 39,464 44,105 48,515 53,532 52,088 2,318 3,011 2,591 2,556 2,529 2,111 2,337 6,363 6,308 6,008 5,739 5,447 6,003 6,014 8,700 8,420 9,798 10,392 10,168 11,181 10,287 4,647 4,709 5,618 6,419 6,830 7,602 6,928 11,301 12,116 12,313 13,803 12,755 14,555 14,930 Type of Construction Millions of Current Dollars
Total Construction Private Construction Residential Buildings New Housing Units 1 Unit 2 Units or more Improvements Nonresidential buildings Industrial Office Hotel, motels Other commercial Religious Educational
Hospital and institutional Miscellaneous
Farm nonresidential Public Utilities Telecommunications Other public utilities Railroads
Electric light and power Gas
Petroleum pipelines All other private Public Construction Buildings
Housing and redevelopment Industrial
Educational Hospital Other
Water supply facilities Miscellaneous public Highways and streets Military facilities
Conservation and development Sewer systems
16
Rounding out the private construction component are farm non-residential, public utilities, and “all other private.” These are generally of a non-residential nature, but are not part of non-residential buildings. Farm non-residential construction includes structures such as barns, storage houses, and fences. Land improvements such as leveling, terracing, ponds, and roads are also a part of this subcomponent. Privately owned public utilities construction is categorized by industry rather than function of the building or structure. This subcomponent includes expenditures made by utilities for telecommunications, railroads, petroleum pipelines, electric light and power, and natural gas. “All other private” includes privately owned streets and bridges, sewer and water facilities, airfields, and similar construction.
For public construction, there are two major components--building and non-building. Both the two major components and the various subcomponents are shown as headings in the first column of Tables 3-1 and 3-2. The building component contains subcomponents similar to those for private construction, with educational buildings being the largest subcomponent. Expenditures for the non-building component overwhelmingly consist of outlays for highways and streets, with sewer systems being a distant second subcomponent.
To get the sector totals, each subcomponent was assigned to a sector and summed. The sector assignments are identical to those used in Chapman and Rennison.15 The sector totals and the overall total are recorded in Tables 3-3 and 3-4. Reference to the tables reveals that sector totals vary considerably, with residential being the largest and industrial the smallest.
Table 3-3. Value of Construction Put in Place: Sector Totals and Sum Total in Millions of Constant 1997 Dollars16
15 Chapman, Robert E., and Roderick Rennison. 1998. An Approach for Measuring Reductions in
Operations, Maintenance, and Energy Costs: Baseline Measures of Construction Industry Practices for the
National Construction Goals. NISTIR 6185. Gaithersburg, MD: National Institute of Standards and
Technology.
16 Note that due to rounding the values entered in the “Total – All Sectors” row in Table 3-3, differ slightly
from the values entered in the “Total Construction” row in Table 3-1.
1994 1995 1996 1997 1998 1999 2000 Residential 266,876 266,089 295,555 294,244 311,248 331,705 341,738 Commercial/ Institutional 152,521 165,828 184,237 205,703 215,774 221,308 233,329 Industrial 33,440 37,511 38,844 37,738 40,393 33,521 29,925 Public W orks 118,434 117,111 115,034 118,944 125,459 128,671 129,280 Total - All Sectors 571,271 586,539 633,670 656,629 692,874 715,205 734,272
17
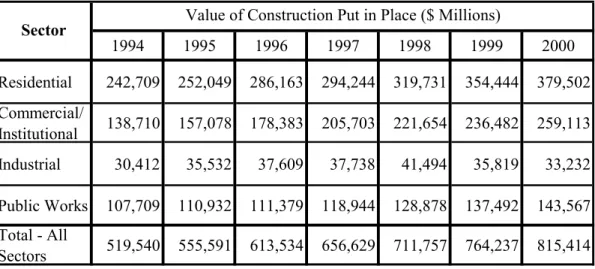
Table 3-4. Value of Construction Put in Place: Sector Totals and Sum Total in Millions of Current Dollars17
Table 3-3 reveals that the commercial/institutional sector is the only sector to have grown consistently in real terms over the entire seven-year period. In real terms, expenditures in the commercial/institutional sector grew from $152.5 billion in 1994 to $233.3 billion in 2000, an increase of almost 55 %. Real expenditures for two of the four sectors, industrial and public works, were essentially constant over the same seven-year period. Real expenditures for the residential sector exhibited a cyclical pattern.
The data contained in Tables 3-3 and 3-4 provide the basis for calculating each sector’s relative share of total construction expenditures. Each sector’s relative share of total construction expenditures is shown graphically in pie chart form in Figure 3-1. It was constructed using 1997 data from Table 3-4 (i.e., current dollar expenditures). Figure 3-1 reveals that in 1997 the commercial/institutional sector accounted for 31 percent of total construction expenditures (i.e., 31 % of $656.6 billion). The commercial/institutional sector’s relative share of total construction expenditures is exceeded only by the residential sector, which constitutes 45 % of the total. In addition, the commercial/institutional sector’s relative share exceeds the combined total for the industrial and public works sectors.
3.2 Overview of the Commercial/Institutional Sector
The commercial/institutional sector, defined in economic terms, consists of establishments that provide services. Defined in this way, the commercial/institutional sector is extremely varied. It includes office buildings, service businesses (e.g., retail and wholesale stores, hotels and motels, restaurants, and hospitals), as well as a wide range of facilities that would not be considered “commercial” in a traditional sense (e.g., public schools, correctional institutions, and religious and fraternal organizations).
17 Note that due to rounding the values entered in the “Total-All Sectors” row in Table 3-4 differ slightly
from the values entered in the “Total Construction” row of Table 3-2.
1994 1995 1996 1997 1998 1999 2000 Residential 242,709 252,049 286,163 294,244 319,731 354,444 379,502 Commercial/ Institutional 138,710 157,078 178,383 205,703 221,654 236,482 259,113 Industrial 30,412 35,532 37,609 37,738 41,494 35,819 33,232 Public Works 107,709 110,932 111,379 118,944 128,878 137,492 143,567 Total - All Sectors 519,540 555,591 613,534 656,629 711,757 764,237 815,414 Sector Value of Construction Put in Place ($ Millions)
18
Figure 3-1. 1997 Breakdown of $657 Billion Construction Market
Expenditures by establishments in the commercial/institutional sector for the built environment include construction expenditures (e.g., new construction and additions and alterations) as well as expenditures for facility operations, for maintenance and repair activities, and for energy. Consequently, it is instructive to first define what is included in each type of expenditure and then examine the characteristics of commercial/ institutional buildings that affect these expenditures.
Construction expenditures include both new construction activities and additions and alterations.
New construction activities include the complete original building of structures and essential service facilities and the initial installation of integral equipment (e.g., elevators and plumbing, heating, and air-conditioning supplies and equipment).
Additions and alterations include construction work that adds to the value or useful life of an existing building or structure, or which adapts a building or structure to a new or different use. Included are major replacements of building systems (e.g., installation of a new roof or heating system).
Facility operations include all non-process or end-product related activities required to operate a building or structure (e.g., water consumption, trash removal/environmental costs, cleaning services/janitorial, and security services/life safety costs), with the exception of maintenance and repair activities and energy. In some cases, fixed operations components may also be included (e.g., real estate and other taxes, insurance, and leasing expenses).
Residential 45% Industrial 6% Public Works 18% Commercial/ Institutional 31%
19
Maintenance and repair activities include incidental construction work that keeps a building or structure in ordinary working condition.
Energy is defined as including all non-process or end-product related energy consumption required to operate a building or structure. Energy consumption can be categorized by energy source (e.g., electricity, gas, and oil) and by end-use (e.g., space heating, cooling, and lighting).
Construction expenditures in 1997 for the commercial/institutional sector were $205.7 billion in current dollars (see Table 3-4). Total expenditures include expenditures from subcomponents listed under both the “private construction” and “public construction” headings in Tables 3-1 and 3-2. The subcomponents included under the private construction heading are: office, hotels and motels, other commercial, religious, educational, hospital and institutional, miscellaneous, and farm non-residential. The subcomponents included under the public sector heading are: educational, hospital, and other. Because the commercial/institutional sector is so varied, it is useful to group these subcomponents into a small number of key components. For convenience, these subcomponents are grouped into four key components, three of which are fairly homogeneous. The four key components are: educational, office, hospital, and other. The relative share of the overall commercial/institutional sector’s construction expenditures for each of the four key components is shown graphically in pie chart form in Figure 3-2. It was constructed using 1997 data from Table 3-2 (i.e., current dollar expenditures). Reference to Figure 3-2 reveals that in 1997 the educational facilities component accounted for 21 percent of the commercial/institutional sector’s construction expenditures.
A report18 by Chapman and Rennison included information on operations, maintenance,
and energy costs for the commercial/institutional sector. Wherever possible, Chapman and Rennison normalized data on a per unit area basis. If the data were sufficiently detailed, as was the case with energy data, they were classified into “bins” within which certain characteristics were homogeneous (e.g., building type, size, and age) and then normalized on a per unit area basis. Although there are a number of data sets which allow such in-depth analyses, the data associated with the Department of Energy’s (DOE’s) Commercial Building Energy Consumption Survey (CBECS) is the source of preference for summarizing the characteristics of the commercial/institutional sector’s stock of buildings.
18 Chapman and Rennison, An Approach for Measuring Reductions in Operations, Maintenance, and
20
Figure 3-2. 1997 Breakdown of $206 Billion Commercial/Institutional Sector
The CBECS collects information on physical characteristics of commercial buildings, building use and occupancy patterns, equipment use, conservation features and practices, and types and uses of energy in buildings. The survey also collects information on the amount of energy consumed and the costs for energy in commercial buildings. The survey is conducted in two stages, the Building Characteristics Survey and the Energy Suppliers Survey. The focus of this section and the next is on the Building Characteristics Survey. Readers interested in the CBECS and its associated micro-data files are referred to Section 4.1.
The most recent DOE Commercial Buildings Characteristics report19 provides detailed
information on the size, age, and other characteristics of commercial/institutional buildings. In 1995, there were 4.58 million commercial buildings and 5.46 billion square meters (58.78 billion square feet) of commercial floorspace in the United States. The mean size of all commercial buildings was 1,193 m2 (12,840 ft2).20 The DOE report grouped buildings into eight size categories and into eight age categories. The vast majority of commercial buildings were found in the smallest size categories, with more than half in the smallest category and three quarters in the two smallest categories. Most commercial buildings, once constructed, are expected to last for decades or longer. New buildings are constructed each year and older buildings are demolished, but the commercial buildings stock at any point in time is dominated by older buildings. More
19 US Department of Energy. 1997. Commercial Buildings Characteristics 1995. DOE/EIA-E024695.
Washington, DC: Energy Information Administration.
20 Values of floorspace expressed in square meters are denoted by m2. Values of floorspace expressed in
square feet are denoted by ft2.
O ffice 17% Educational 21% Hospital 9% O ther 53%