RESEARCH REPORT
Homeowners' Willingness To Take
Up More Efficient Heating Systems
By Ipsos MORI and the Energy Saving Trust
The views expressed in this report are those of the authors, not necessarily
those of the Department of Energy and Climate Change (nor do they reflect
Government policy).
Contents
Executive Summary ... 3
1. Background and methodology... 14
1.1Research background ... 14
1.2 Research objectives ... 14
1.3 Research methodology ... Error! Bookmark not defined.6 1.4 Presenting the findings ... 25
2. Attitudes towards current heating systems ... 300
2.1 Which heating systems are currently being used? ... 30
2.2 How well do current heating systems meet homeowners’ needs? ... 33
3. Attitudes towards replacing heating systems ... 35
3.1 How many homeowners have replaced their heating systems and why? ... Error! Bookmark not defined.35 3.2 How often do homeowners expect to replace their heating systems and why?Error! Bookmark not defined.46 4. Future preferences for heating systems ... 533
4.1 Must-haves for a future heating system ... Error! Bookmark not defined.3 4.2 Which heating systems are homeowners currently considering for the future? ... 55
4.3 How appealing are more efficient heating systems to homeowners? ... Error! Bookmark not defined.59 4.4 Which more efficient heating systems do specific groups of homeowners prefer? ... 68
4.5 What trade-offs do homeowners make between different more efficient heating systems and what encourages uptake of one over another? ... 69
4.6 Likely take-up of more efficient heating systems ... 74
4.7 How appealing is solar thermal for homeowners?... 97
4.8 How would homeowners finance a new heating system? ... 108
4
Executive Summary
Ipsos MORI was commissioned to conduct this quantitative and qualitative research programme by the Department of Energy and Climate Change (DECC). It explores the preferences and willingness to pay for more efficient heating options among homeowners in Great Britain.
Background, objectives and research methodology
The Strategic Framework for Heat, published in March 2012, examined how heat is supplied and used today, and how this would need to change to meet the Government’s 2050 carbon emissions targets and 2020 goal of supplying 15% of UK energy from renewable sources. A critical part of this will be
maximising the potential for more efficientdomestic heating technologies.
This research was designed to address specific research questions developed by DECC and to inform related modelling and analysis. In particular, it explored homeowners’ preferences and willingness to pay for seven more efficient heating systems:
Gas condensing boilers;
Micro-combined heat and power (micro-CHP); Air source heat pumps (ASHPs);
Ground source heat pumps (GSHPs);
Biomass boilers;
Heat networks; and
Solar thermal.
The study consisted of three phases as shown in Figure 1 below.
PHASE 1: Qualitative Workshops – July 2012
Aim: To explore the key factors desired in a heating system and to test the survey materials
PHASE 2: Quantitative Survey and Choice Experiment – Sept-Oct 2012
Aim: To explore homeowners’ preferences
between a range of more efficient heating technologies
• 3 x 2 ½ hour workshops with 9-12 participants in each. • Mix of plenary and breakout sessions to tailor
discussions to particular groups of homeowners. • Held in England (London), Wales (Cowbridge) and
Scotland (Glasgow).
P
ha
se
O
ne
Figure 1: Summary of research approach
• Mix of participants from a range of demographics, property types and on/off gas grid areas.
• Locations selected to provide coverage of urban, suburban and rural setting.
• A representative sample of 2900 owner-occupiers interviewed in England, Wales and Scotland, including a boosted sample of off gas homeowners. • Main sample split between 1,928 on gas grid and
920 off gas grid interviews.
• Data weighted by region, household type and composition and on/off gas grid.
• •
P
ha
se
Two • A 37 minute (on average) interview, including
discrete choice element where respondents made a series of trade-offs between more efficient heating systems.
• Owner-occupiers who only heat home with low carbon heating system or heat network (52) were excluded from the majority of survey.
All phases of the research were conducted with owner-occupiers (including those repaying a mortgage). Homeowners who were currently heating their homes mainly through a heat network, GSHP, ASHP or biomass boiler were only asked a reduced set of survey questions at Phase 2: their awareness of more efficient heating systems, how they currently heated their home and water, and when they last replaced the heating system in their home. They were not asked their future preferences / intentions for heating systems. These homeowners were also excluded from the Phase 1 workshops.
The rest of the Executive Summary presents the headline findings from this study, drawing on all three phases. All percentages reported are from the Phase 2 quantitative survey.
Attitudes towards current heating systems
What do homeowners like or dislike about their current heating system?
The most common heating system used by homeowners was a gas boiler (80%). Many were using any form of combination boiler (67%) and the initial workshops suggested that such devices were the best regarded for heating homes – being effective at reaching the required temperature, supplying instant hot water on demand, being easy to control and compact in size and shape. They were also the preferred
future means of heating, with 63% spontaneously saying they would next install a combination gas boiler. (This applied to 71% of ‘on gas grid’ homeowners and to 13% of those off the gas grid’1).
Off gas grid workshop participants were less satisfied with their current heating system – which was most likely an oil boiler or electric storage system. Many viewed these as very expensive, and in urban off gas grid areas such systems (most likely electric) were often criticised as difficult to use and poor at reaching and maintaining the desired temperature. Many off gas grid homeowners would connect to the gas grid if possible.
What are the ‘must-haves’ for new heating systems?
Purchase and running costs were the most important criteria, more so than effectiveness, reliability or aesthetics. Specifically, 24% said low energy bills were most important and 23% cited the system being cheap to run as most important. These were followed by low capital costs (a further 10% said the system being cheap to buy and 5% said being cheap to install was the most important).
Reliability was also a common ‘must-have’ and was the most likely criteria to appear in the top three important factors after low energy bills and a cheap to run system. One in ten (9%) said the most important factor for them was the system lasting a long time before breaking down.
1
These homeowners all lived in properties which are not currently connected to the mains gas grid. This includes both properties which cannot be connected to the grid and those which could be connected but are not currently. It also includes those who do not know if it is possible for their property to be connected or not. These homeowners are referred to as “off gas grid” throughout this report.
• 45 minute follow-up telephone interviews with 18 respondents to the Phase 2 survey.
PHASE 3: Qualitative Interviews – Oct 2012
Aim: To explore in depth the decision-making process dictating choices in the experiment
P
ha
se
Th
ree
• Three choice scenarios from the Phase 2 survey discussed with each participant, covering all the more efficient heating systems.
However, analysis of the trade-offs made between heating systems in the choice experiment showed a somewhat different pattern. Here, running costs generally did not have a decisive influence over the choice of system. The key determinant was the technology itself (dictating 54% of choices) followed by the upfront grant (driving 13% of choices). These drivers of preference are discussed later in this summary.
Triggers to replace heating system
How often do homeowners consider replacing / replace their heating system?
Just under two-thirds (64%) had replaced the heating system in their current home in the past, nearly half (47%) within the last ten years and 17% within the last three years.
Just over half (58%) expected to replace a heating system at least every fifteen years, although 19% anticipated waiting more than 20 years. By contrast, 27% expected to replace their system at least every five years.
What are the triggers for homeowners considering replacing their current system?
A system breakdown was the most common reason respondents had replaced their heating system in the past (30% gave this as the main reason). ‘Non-emergency’ situations where their system was still working but was coming towards the end of its life were also commonly cited as the main reason, either because they were told it would not last much longer (14%) it needed repairs too often (14%) or they were told the parts would no longer be available in the future (3%). The most common reason other than actual or anticipated breakdown was as part of a wider property renovation (13% gave this as the main reason).
What would encourage homeowners to replace their heating system earlier (i.e.
before it breaks down)?
Most (70%) would only consider a pre-emptive system replacement if their heating system started to need considerable repair/s. This was confirmed by the choice experiment which found that in a non-emergency scenario2 the majority of survey respondents would opt to do nothing.
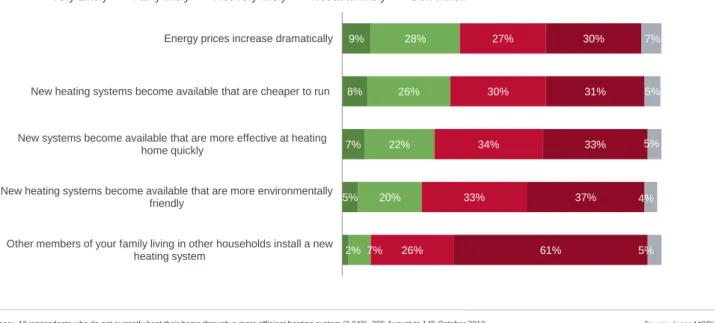
Again, running costs play some part in the decision: a third (37%) said they would be likely to replace if energy prices rose dramatically, and 34% if cheaper-to-run systems became available. Fewer (25%) would be encouraged by ‘more environmentally friendly’ systems. However, the choice experiment showed that in a gas price rise scenario, or when preferential tariffs were available for renewable heating systems, the majority of homeowners would still opt to do nothing in a non-emergency situation.
Lifestyle changes proved less of a likely trigger: only 12% thought that retirement would prompt a system replacement, and only 6% that extending a family would do so. One in ten (11%) felt it likely that moving home would lead them to install new equipment in their new home (down to 6% and 5% if renting out or selling an existing home). The follow-up interviews revealed that many homeowners did not believe an upgraded heating system would add value to a property, hence the lack of motivation to do so in these scenarios.
2
Survey respondents were asked to consider a scenario where their existing heating system was still working but was perhaps coming towards the end of its life or they were considering replacing it for another reason.
In what order do homeowners consider changing their heating system alongside
or separately from insulation measures or solar thermal?
The follow up interviews found often there was no clear sequence of events here; installation was generally driven by the availability of free, or heavily discounted, insulation measures. In many cases, insulation had not been actively sought, but passively accepted when offers were made.
However, most agreed with the principle of installing insulation prior to replacing a heating system, and 70% said they would be willing to do so in order to receive financial assistance towards a more efficient heating system. Most (67%) expected to reduce their energy bills by installing energy efficiency
measures, and 57% expected this to make their home warmer and more comfortable.
Too few of the respondents had installed solar thermal to draw any conclusions on the sequence of these changes.
Decision making process
What processes do homeowners go through when deciding whether to replace
their heating system?
Homeowners in all phases of this study had gone through a similar process. First of all, there generally needed to be some trigger to start considering it. As noted, this was usually either a complete breakdown, or signs that the system was coming to the end of its life (needing frequent repairs, starting to make noise, not reaching the desired temperature as quickly). For a smaller proportion, the trigger was making wider property renovations.
In non-emergency breakdown situations (i.e. not complete breakdown), the next key consideration for most was the age of the heating system. If it was less than ten years old, and not displaying any signs of breaking down, it was very unlikely that the homeowner would replace it. The availability of finance for the new system was also critical, and was often balanced against the urgency of replacement.
Among homeowners who had replaced the heating system in their current property, some (42%) had consulted their boiler serviceman for advice on what type of heating system to install, while 24% had consulted a friend (especially if that person had technical knowledge of heating or plumbing). Others consulted their energy supplier or a builder (14% each). These were all trusted sources of advice, but more so for energy companies if it was delivered face-to-face via a serviceman, rather than by generic printed or online information.
Once homeowners had decided to replace their heating system, most (68%) did so within a year, with two in five (39%) doing so within three months. By contrast, one in five (18%) waited longer than one year. The workshops and follow-up interviews revealed various reasons for postponement, ranging from specific family circumstances such as serious illness, to temporary moves away from the property for work. However, a common theme was saving up to pay the upfront costs.
What heating options would homeowners consider installing (unprompted)?
Gas boilers were the clear favourite for future installation. When asked spontaneously which heating system they would consider in the future, 90% of on gas grid respondents said a gas boiler (71% specifically a combination gas boiler). An oil boiler was most commonly mentioned by off gas grid homeowners (40%, with 25% specifically mentioning a combination oil boiler).
Few mentioned any other type of heating system: between 2% and 3% cited one of the more efficient heating systems other than a gas condensing boiler. This likely related in part to lower awareness of
other such systems (with only 27% aware of micro-CHP, against 86% for gas condensing boilers). The second most commonly recognised of the seven systems covered was solar thermal (83% had heard of this, although the workshops suggested this may often be confused with solar PV).
The next best known more efficient systems were the GSHP and biomass boiler (both heard of by 47%). A significant minority had heard of ASHPs (32%) or heat networks (31%).
Preferences for more efficient heating systems
Which more efficient heating systems do homeowners find most attractive?
Homeowners in all phases of the research were shown one page factsheets providing basic information on each of the more efficient heating systems which were feasible for their home. (At this stage, no cost information had been given about the options).
For those connected to mains gas, the most appealing technology at this stage was a gas condensing boiler (80% were positive and only 5% negative about this technology). This was considered a familiar, proven and trusted technology needing minimal maintenance and space. The second most appealing was micro-CHP (46% positive), which was liked for similar reasons to the gas condensing boiler, although relative lack of familiarity counted slightly against it.
The other systems had significantly less appeal. Two in five (38%) of those with private outside space were positive about GSHPs, with off gas grid homeowners the most positive (53%). The concept of using a readily available source of free energy from the ground appealed to many, but particularly to this group who often felt they had the space to make it viable.
A third (34%) of all homeowners were positive about heat networks, and more so still among those living in very high density areas (43%). They found the concept of a community network appealing both at an emotional and practical level, as they felt it increased the efficiency of generation and would therefore reduce household bills.
However, more homeowners felt negatively than positively towards ASHPs and biomass boilers. Both were felt to be visually unattractive, which reduced their appeal for many. The biomass boiler was considered as too much ‘hassle’ by many due to the regular fuel deliveries and maintenance. The ASHP lacked credibility as a reliable technology among some homeowners (particularly those living in colder parts of Great Britain) as they did not believe it would work at low temperatures.
On balance, the survey respondents were more positive than negative about using a solar thermal system to heat their water. Approaching half (45%) were positive whilst a third (32%) were negative. This is more favourable than reactions to the other renewable heating systems (GSHP – 38%, ASHP – 28%, biomass boiler – 26%), similar to micro-CHP (46% positive) but substantially lower than for gas
condensing boilers (80%). However, when making these comparisons it should be noted that the solar thermal system was assessed by respondents having seen factual and cost information3 whereas the other technologies were rated based only on the factual information contained in the factsheets and no cost information.
3
The cost information shown included the upfront installation cost, the estimated annual fuel saving and
maintenance cost. It also detailed the financial assistance available either in the form of a one-off upfront grant or as an annual tariff payment.
What information would homeowners want about potential suppliers of more
efficient heating systems and financial mechanisms to help pay for them?
Workshop and follow-up interview participants felt that the information provided on the one page
factsheets was important and useful in helping them assess the appeal of each technology. In particular, homeowners wanted to see information about the space required inside and outside the property,
including for the system itself and any fuel storage, and whether a hot water tank was required. The information on the level of responsibility to maintain, clean and fuel the system was also critical for many. Some focused on the expected lifetime of the system, but few wanted to know the installation time.
In addition to the information provided, a few homeowners would seek information about the proven reliability of the technology, by which they meant the expected time before needing repairs, length of warranty, any weather conditions which would prevent effective operation, and how widely used the systems were in domestic British properties. This information was particularly requested for air source heat pumps and micro-CHP.
Many homeowners with lower incomes, or limited savings, would need information on the financial assistance available to pay upfront installation costs. For those with available capital, who tended to be aged 55 and over, the key information was about any ongoing financial assistance to help reduce annual running costs. Such homeowners were particularly keen to know the new systems’ expected annual fuel bill.
Homeowners did not mention needing information about the suppliers of heating system technologies. They would trust the advice of a boiler serviceman or heating engineer, and would also follow word-of-mouth recommendations from friends and neighbours.
How likely are homeowners to take up more efficient heating systems, in
emergency and non-emergency situations? (results of the choice experiment)
Homeowners were asked to make a series of trade-offs between more different efficient heating systems – being given financial information to help them make a decision. For each trade-off they were asked to indicate the option they preferred, and then to rate how likely they would be to actually install their selected technology in a non-emergency scenario (where their existing heating system was still working but was either coming towards the end of its life or they were considering replacing it for another reason).
In this non-emergency scenario, the majority of homeowners involved in this research would not make a replacement (81% would do nothing in a ‘base scenario’ where heating systems were priced at their current market value and no financial incentives were available4). The choice experiment found there were considerable barrier costs to these homeowners replacing their current heating system with a more efficient system in this situation. The barrier costs represent the economic value homeowners would need to be compensated by to address their concerns about the new technology (whether due to perceptions of it being disruptive to install, a hassle to maintain etc). The barrier costs were calculated by examining the sensitivity of each choice made by respondents to the total installation cost of the technology5.
Among the on gas grid homeowners who would make a non-emergency replacement, the most popular option would be a gas condensing boiler, with 15% choosing this in a ‘base scenario’, compared to 80% who would do nothing. The most popular renewable option (from a biomass boiler, GHSP or ASHP)
4
This scenario did not offer a one-off upfront grant or an annual tariff payment on the gas condensing boiler, heat network, GSHP, ASHP or biomass boiler. It did, however, include a feed-in-tariff payment for micro-CHP.
5
Further information on the barrier costs calculated using the choice experiment results will be published separately.
would be a GSHP – although this was only opted for by 1%6 of survey respondents. Indeed, even if gas
prices increased by 40% and other fuel prices stayed at 2012 levels, the gas condensing boiler would be installed by the majority of homeowners.
Among off gas grid homeowners who would make a non-emergency replacement, the most popular option was a heat network (although 5% opted for a heat network this is unlikely to be a feasible option currently for most off gas grid homeowners). The proportion of homeowners likely to install one of the renewable options was similar for a biomass boiler, GSHP and ASHP (between 1% and 2%), and 91% would not make a replacement. Taking away the heat network as an option for off gas grid homeowners did not lead to a large rise in likely uptake of one of these renewable systems however. Instead, the share of respondents who had selected the heat network was spread across a ‘do nothing’ response and the other available heating systems.
Homeowners would be more likely to make a replacement in an emergency situation, when their heating system had broken down and they were without heating. However, in this situation the majority of on gas grid homeowners would only consider installing a gas condensing boiler with a small minority likely to install any of the other more efficient heating systems. Off gas grid homeowners were equally likely to be willing to install a heat network and a GSHP (34% likely) with slightly fewer likely to install an ASHP or biomass boiler (31% and 29%). These findings closely reflect those for a non-emergency scenario where the heat network and GSHP were also the most popular options7.
How is the likely take-up of more efficient heating systems affected by the balance
of upfront, running and maintenance costs?
The key determinant of choices between more efficient heating systems was the technology itself, rather than how much it cost to install or the financial incentive available. Analysis of all the choices made by all the survey respondents showed that this explained 54% of the trade-off decisions during the survey choice experiment (as shown in Figure 2). All the ways in which homeowners assessed the technologies could not be uncovered by this research, however, the workshops and follow-up interviews suggested that two key ways in which they did so were to assess how appropriately sized the system was for their particular property, and, at an intuitive level, how credible it sounded as a heating system which would be effective in a colder climate such as Great Britain.
The upfront grant proved more influential in affecting homeowners’ choice than did the upfront installation cost, annual fuel bill or annual tariff payments. The grant drove13% of the choices made, while the tariff amount and length each explained 9%, and the installation cost 8%. Finally, the estimated annual fuel bill explained 7% of the choices made.
6
Please note this is not intended to be a market forecast. Estimates are a short term measure of uptake based on the same offer being available to everyone at one point in time. Survey respondents received basic and unbiased information about each heating system. In reality there are a variety of other factors that could influence uptake e.g. marketing activity.
7 Please note that no ‘like-for-like’ replacement option was offered to off gas grid respondents (e.g. an oil boiler).
These respondents were only asked to consider their likelihood of installing a GSHP, ASHP, biomass boiler or a heat network connection in an emergency situation.
Figure 2: Drivers of preferences between more efficient heating systems
1
Internal Use Only © Ipsos MORI
Paste co-brand logo
here
Relative importance of attributes in driving trade-offs in survey choice experiment
Attribute drivers
54%
13% 9% 9%
8% 7%
Type of heating system
Tariff length (number of years receive annual payment)
One-off grant Annual tariff payment
Total installation cost
Annual fuel bill
Source: Ipsos MORI Base: All respondents who do not currently heat their home mainly using a GSHP, ASHP, biomass boiler or heat network (2,848),
28thAugust to 14thOctober 2012
The provision of an upfront grant for renewable heating technologies (biomass boilers, GSHPs and ASHPs)would encourage uptake of these in a non-emergency situation among both on and off gas grid respondents. The choice experiment results showed that as the value of the grant increased, the likely uptake of these systems also increased, and led to a greater share of homeowners opting for a
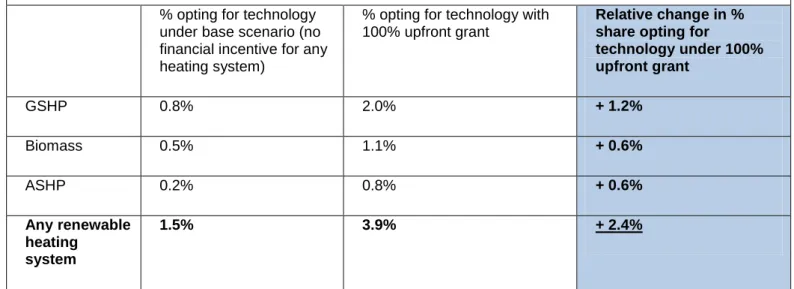
renewable system rather than micro-CHP or a heat network. A 100% grant led to an overall shift of +2.4% opting for renewable heat. The majority of this shift towards renewables came from respondents opting for one of these rather than a heat network (especially among off gas grid respondents). However, no additional uptake was created by raising the grant from 100% to 130% of the installation cost. The table below summarises the impact of a 100% upfront grant on interest in the three renewable heat technologies when compared with a base scenario where no financial incentive was offered.
Figure 3: Impact of 100% upfront grant on appeal of renewable heating systems in non-emergency scenario
SUMMARY OF SIGNFICANT CHANGES UNDER 100% UPFRONT GRANT (available for GSHP, ASHP or
biomass boiler) Figuresbased on all respondents, in non-emergency scenario
% opting for technology under base scenario (no financial incentive for any heating system)
% opting for technology with 100% upfront grant
Relative change in % share opting for
technology under 100% upfront grant
GSHP 0.8% 2.0% + 1.2%
Biomass 0.5% 1.1% + 0.6%
ASHP 0.2% 0.8% + 0.6%
Any renewable heating
system
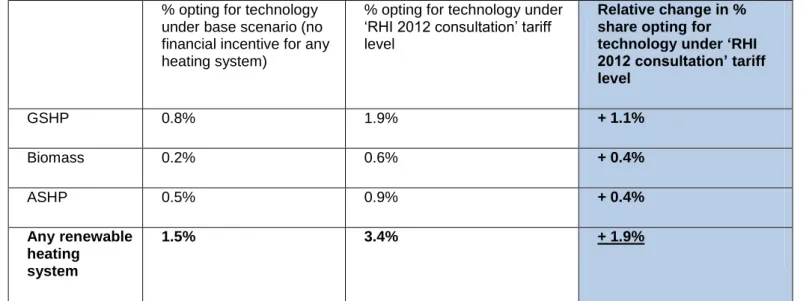
The provision of an annual tariff, but no upfront grant, for renewable heating technologies would also encourage a shift in the share of homeowners likely to install these heating systems in a non-emergency. As shown in the table below, the proportion of respondents selecting a GSHP increased by 1.1% with the availability of a seven year ‘RHI 2012 consultation’ tariff level8 (from a base scenario where no financial
incentive was offered). The overall change in the percentage share likely to take up any renewable heat option (GSHP, ASHP or biomass boiler) was +1.9% in this scenario.
Figure 4: Impact of seven year tariff on appeal of renewable heating systems in non-emergency scenario
SUMMARY OF SIGNFICANT CHANGES UNDER ‘RHI 2012 CONSULTATION’ TARIFF LEVEL (available for
GSHP, ASHP or biomass boiler for 7 years) Figuresbased on all respondents, in non-emergency scenario
% opting for technology under base scenario (no financial incentive for any heating system)
% opting for technology under ‘RHI 2012 consultation’ tariff level
Relative change in % share opting for technology under ‘RHI 2012 consultation’ tariff level
GSHP 0.8% 1.9% + 1.1%
Biomass 0.2% 0.6% + 0.4%
ASHP 0.5% 0.9% + 0.4%
Any renewable heating
system
1.5% 3.4% + 1.9%
Homeowners were presented with different tariff scenarios where an annual payment was made for either 3, 5, 7, 12 or 20 years. The monetary value of tariff payments increased in nominal terms as the payment length increased, but remained the same in real terms, using standard discounting. However, the results showed that a tariff paid over 20 years was more attractive than any of the other time periods. This suggests that respondents were not making discounted cash flow calculations themselves. The positive reaction to the 20 year tariff suggests a psychological rather than economic trigger. Under a scenario offering a 20 year tariff for renewable heating, the share of respondents opting for a GSHP (2.3%) overtook the share opting for micro-CHP (0.8%) and the heat network (1.6%).
Overall the analysis shows that the provision of financial assistance, whether in the form of a tariff or a grant, led to a statistically significant increase in the proportion of respondents opting for a renewable heating system compared to the base scenario. However, the difference between the figures for the ‘most-preferred’ tariff and grant are not significant and so it cannot be concluded that one form of finance is more or less effective than the other.
8 The domestic RHI consultation document launched in September 2012. The ‘RHI 2012 consultation tariff level’
was used to set the tariff ranges in this research. More information about the consultation is available here: https://www.gov.uk/government/consultations/renewable-heat-incentive-proposals-for-a-domestic-scheme
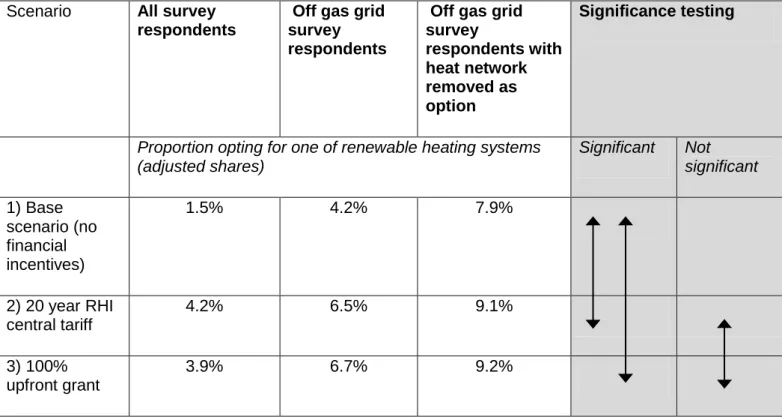
The table below summarises the proportion of survey respondents opting for any one of the three renewable technologies (GSHP, ASHP or biomass) during the choice experiment under three different scenarios9:
Base scenario: no financial incentives available for renewable heating systems;
20 year RHI central tariff: annual tariff payment made on GSHP, ASHP and biomass boiler for 20 years (tariff amount set to ‘RHI 2012 consultation’ tariff level); and
100% upfront grant: one-off payment equivalent to installation cost made on GSHP, ASHP and biomass boiler. No tariff payment offered.
Figure 5: Summary of impact of financial assistance on appeal of renewable heating systems in non-emergency scenario
Scenario All survey respondents
Off gas grid survey respondents
Off gas grid survey
respondents with heat network removed as option
Significance testing
Proportion opting for one of renewable heating systems (adjusted shares)
Significant Not
significant
1) Base scenario (no financial incentives)
1.5% 4.2% 7.9%
2) 20 year RHI central tariff
4.2% 6.5% 9.1%
3) 100% upfront grant
3.9% 6.7% 9.2%
How likely are homeowners to take up solar thermal, alongside their current
heating system or in combination with another more efficient system? (results of
solar thermal model)
The appeal of solar thermal was tested separately to the main choice experiment discussed above. As it is a system which only provides hot water and not heating it is difficult to compare on a like-by-like basis with the other technologies.
At current costs (without grant or tariff), the interest in solar thermal appeared low. Less than 1% would install it alongside their current heating system. However, the probability of respondents installing solar thermal increased significantly as the value of the upfront grant increased (up to 17% if a 100% upfront grant was offered). Any set-up of tariff payment also increased the proportion of respondents likely to
9
install solar thermal alongside their current system – in particular if they were offered a higher annual payment for a short period i.e. over three, five or seven years as opposed to over 12 or 20 years (10.5% said they would install solar thermal with a three year tariff, compared to around 5% if it was spread over 12 or 20 years).
It should be noted that extreme care should be taken when comparing the appeal of solar thermal in different grant scenarios and the appeal of the other more efficient heating technologies. This is due to the different ways in which respondents were asked about these technologies. Respondents were asked directly how likely they would be to install a solar thermal system or not, whereas they indicated their relative preference between a choice of two heating systems in the main experiment. Although the models have been developed on the same principles, ultimately one model is based on a decision where the homeowner needs to have at least some form of heating system, whereas the other is based on a discretionary decision. Comparisons should only be made where the full context of both choice situations are understood.
Survey respondents were also asked to imagine they already had one of the more efficient heating systems installed in their home (if they did not already) and how likely they would be to install solar thermal alongside this system to provide them with hot water. Homeowners would be most likely to combine it with a gas condensing boiler, but the majority would be unlikely to install solar thermal
alongside any type of more efficient heating system. No one of the renewable heating systems was felt to more or less suitable for combining with solar thermal than the others.
1. Background and methodology
This study explored potential domestic demand, and willingness to pay, for more efficient heating options. Ipsos MORI and the Energy Saving Trust were commissioned to conduct this quantitative and qualitative research by the Department of Energy and Climate Change.
1.1 Research background
In March 2012, DECC published a ‘Strategic Framework for Heat’. This examined how heat is supplied
and used today, but also considered how this would need to change in the future to meet the Government’s 2050 carbon emissions targets and 2020 goal of supplying 15% of UK energy from renewable sources . The Framework noted that, to drive this change, a market for low carbon and renewable heat needed to be built.
Initiatives have already begun to support the initial take-up of renewable heating technologies, particularly in areas not served by mains gas (off gas grid areas). For example, the Renewable Heat Premium
Payment Scheme which provides a one-off financial incentive to take up renewable heat technologies. Upcoming schemes such as the Renewable Heat Incentive Scheme have also been planned, following consultation from September to December 2012.
As well as the renewable heat technologies (air and ground source heat pumps, biomass boilers and solar thermal) encouraged in the Renewable Heat Premium Payment Scheme, DECC is also exploring the potential of heat networks as part of its ‘Strategic Framework for Heat’. These networks will offer to supply heat directly to homes and businesses through a piped network, rather than supplying the fuel for people to generate heat on-site within their homes. In addition to these renewable options, the efficiency of domestic gas boilers in the short and medium term needs to be maximised, and also the potential for domestic micro-CHP to replace gas boilers.
A key factor in achieving the UK’s renewable and carbon targets is consumers’ willingness to convert to more efficient heating options.
1.2 Research objectives
Understanding consumers’ attitudes, behaviours and preferences is key to recognising how Government can achieve the desired change towards low carbon and renewable heating options.
Research was needed that quantified the preferences for moreefficientheating options, and that
qualitatively understood consumers’ decision-making processes and preferences. The overall aim of this study was therefore to provide robust evidence on householder preferences for more efficient heating options, by addressing the research questions listed overleaf (see section 1.2.1). In turn, the work was intended to update and build on studies that have begun to explore the actions and choices of consumers (such as the Element Energy and Keeping FiT studies).
The study presented here explored the research questions in relation to seven more efficient heating technologies:
Gas condensing boilers;
Micro-combined heat and power (micro-CHP);
Ground source heat pumps (GSHPs);
Biomass boilers;
Heat networks; and
Solar thermal.
The research explored homeowners’ reactions to a range of heating option characteristics, such as financial (including upfront, running and maintenance costs) and non-financial (e.g. requirements for maintenance or fuel deliveries), as well as providing estimates of ‘barrier costs’ to help inform analysis of the domestic Renewable Heat Incentive (RHI).
1.2.1 Research Questions
Attitudes towards current heating system:
What do homeowners like or dislike about their current heating system?
What characteristics are ‘must-haves’ for any new heating system (e.g. reliability, ease of use/control)?Triggers to replace heating system:
How often do homeowners consider replacing/replace their heating system?
What are the triggers/reasons for considering replacing/replacing their current system?
What would encourage them to replace their heating system earlier (i.e. before it breaks down)?
Do homeowners consider changing heating system alongside or separately from insulation measures, and solar thermal (and, if separately, in what order?)
Decision-making process:
What process do homeowners go through to decide whether to replace their heating system?
Who and what factors influence their decision?
What information would they want to receive about potential suppliers, financial mechanisms, technologies?
Where do homeowners go for advice, if at all, and whose advice do they trust most?
What heating options would they consider (unprompted)?
Preferences based upon range of alternatives:
If given basic information about the range of options feasible for their home, which option would they now consider and why? Which would be most attractive?
How much would they be willing to pay (or need to be subsidised by) to take up each alternative technology, compared to a default cost of replacing their current heating system with the same type?
How is likely take-up affected by the balance of upfront, running and maintenance costs?
1.3 Research methodology
The research consisted of three distinct phases which built on one another to answer the research questions set out above. An overview of the stages is presented below in Figure 6. These phases are detailed in full in the following section.
1.3.1 Phase 1: Qualitative Workshops
The Phase 1 workshops were an essential first stage to this study. The qualitative in-depthdiscussions with homeowners started to explore many of the key research objectives, such as the ‘must-haves’ for a heating system, reasons for having replaced/not replaced a heating system, and what triggers might prompt this in the future. During the workshops homeowners were also presented with basic information about the seven more efficient heating systems and asked to discuss the level of appeal of each.
Critically, this workshop phase also informed the Phase 2 quantitative survey by exploring key issues around low carbon heating options, and by helping to develop the approach for the ‘choice experiment’.
Two key outputs from the workshops were cognitively tested: factsheets about each of the more efficient heating systems10 and the template for the choice card to be used in choice experiment11. The workshops explored the key pieces of information (attributes) which needed to be included on the choice card, the order in which they should be presented, and the most appropriate language to use to describe them. This was a critical stage to ensure the choices presented to the Phase 2 survey respondentswere meaningful and useful.
Phase 1 Sample design and recruitment
Three workshops were held in July 2012, one each in England (London), Wales (Cowbridge) and
Scotland (Glasgow). The workshops lasted 2.5 hours with 9 to 12 (local) participants attending each. The recruitment process screened out those employed in market research, non-homeowners, those with a specific interest or stake in low carbon issues, people who have experienced a ‘distress purchase’ scenario in the last three months, early adopters, and those with no responsibility for household decisions.
By setting quotas for particular characteristics, each workshop comprised a mixture of homeowners across:
Social-demographic factors: Notably in terms of age, gender and social class;
Dwelling type: A mix of flats, terraced and detached/semi-detached housing, as well as those living in pre-1944 housing stock and those living in post-1945/pre-1990 housing; and
Availability of space: Some participants were specifically recruited because they had outdoor
private space or because they owned their own roof. This was so that GSHPs and solar thermal could be discussed with homeowners living in properties appropriate for these.
Prior to arriving at the workshops, the homeowners were requested to complete a homework exercise. This was designed to capture their thoughts about their current heating system, and the types of system they would consider in future, prior to being potentially influenced by discussions at the workshops. The workshops involved a mixture of ‘plenary’ sessions (involving all 9 to 12 homeowners as one group), and smaller breakout groups which enabled those living in the same types of property, or types of area, to discuss the issues most relevant to their situation. Homeowners were divided into smaller groups as follows:
London: one group of homeowners living on the gas grid, and one group for off gas grid homeowners;
Scotland: all homeowners were on gas grid so the groups were divided according to property size – one group for owners of detached or semi-detached homes, and one group for owners of a flat or terraced home; and
Wales: all homeowners were off the gas grid so the groups were divided according to property size – one group for owners of detached or semi-detached homes, and one group for owners of a flat or terraced home.
10
All the factsheets tested at Phase 1 are provided in the Technical Annex and the final factsheets used in Phase 2 are presented in section 4.3 of this report.
11
1.3.2 Phase 2: Quantitative Survey and Choice Experiment
Sample design and fieldwork details
The Phase 2 quantitative survey was designed to provide robust statistical data on the attitudes of owner-occupiers towards their current heating system and their previous system replacement history. It also explored relative preferences between, and likely uptake of, more efficient heating systems in both emergency and non-emergency situations. This was achieved through a 37 minute (average length) survey of a nationally representative sample of owner-occupiers (including both those who owned their property outright and those re-paying a mortgage).
Those who already used a biomass boiler, ground source heat pump, air source heat pump or heat network as the primary means of heating their home were screened out after a few questions about when they last replaced their heating system.
Homeowners were included in the complete survey if they used any of these technologies only as a
supplementary way of heating their home, or if they had a gas condensing boiler, micro-combined heat and power, or solar thermal system installed. The rationale for including these homeowners was that they could still make worthwhile heating improvements to their home.
The first stage of Phase 2 was a pilot survey of 21 homeowners. This was conducted across four different sample points between 15 and 21August 2012 to test whether the survey questions were understood by homeowners, to provide an accurate timing for the survey and to gauge the likely response rate. Some of the pilot interviews were observed by the project team so that they could see first-hand how the survey worked in practice. Following the pilot, all members of the project team and the interviewers held a de-brief to discuss their observations and to agree the changes required ahead of the main fieldwork stage.
The main fieldwork was carried out across Great Britain between 28August – 14October 2012. It used a random location sampling approach12. The interviews were conducted face-to-face in respondents’ homes. The fieldwork was split between a nationally representative sample and a second sample which was ‘boosted’ to achieve more interviews in off gas grid areas. Quotas were set at a localised level to ensure a representative sample across key household and individuals characteristics. These focused on a few key variables to ensure the fieldwork could be completed within the time available, and due to the challenges of accessing owner-occupier demographic profiles.
The quotas were set on:
Whether the property was on or off the mains gas grid;
A minimum target for interviews with homeowners aged 18-34; and
A minimum target for interviews with flat owners.
Other demographic factors, such as gender, social grade, work status and ethnicity were allowed to fall out naturally across the sample.
In all, 2,900 owner-occupiers, aged 18+ and at least jointly responsible for household decisions, were interviewed across England, Scotland and Wales.
12
A random location sampling approach means that survey areas (at a double output area level) were selected and quotas were set within these areas on the types of respondents to interview. The random location approach is more rigorous and controlled than a standard quota survey which allows interviewers to conduct interviews in a much wider area.
In total, 52 of these homeowners were classified as ‘early adopters’ of more efficient heating systems (and so excluded from most of the questions),leaving 2,848 as the main sample for this research. The number of interviews achieved in each nation, and by on and off gas grid, is presented in Figure 7 below.
Figure 7: Breakdown of Phase 2 survey interviews by nation and on/off gas grid
England Scotland Wales Total Sample
On gas grid13
1,492
283
153
1,928
Off gas grid
563
152
205
920
Column Totals
2,055
435
358
2,848
The data presented in this report has been weighted by a number of different demographic and
geographic variables to ensure the findings are representative of the homeowner population based on the best available data with known correlations with home ownership. The data was weighted by:
Region to ensure it reflected the population size of the former nine Government Office Regions in England and the total population of Scotland and Wales;
The known profile of household type and household composition across Great Britain; and
Whether the property was currently connected to the mains gas grid or not.
More information about the sample design and weight specification is included in the Technical Annex.
Phase 2 Questionnaire design
The questionnaire was designed to answer the key research questions listed in section1.2.1.
The questions were developed using the findings from the Phase 1 workshops, and refined following the pilot survey. Both of these helped develop the terminology used in the questions and the range of answer categories offered to survey respondents. The interviewers used CAPI (Computer Assisted Personal Interviewing) laptops to show the questionnaire to participants and to collect their responses. This enabled interviewers to show stimulus material about the more efficient heating systems and allowed homeowners to enter responses to sensitive questions (e.g. household income) directly into the CAPI laptop without interviewer involvement.
This system also enabled the questionnaire to be routed and administered correctly, minimising the possibility of interviewer error. To ensure greater accuracy of the CAPI scripts, both ‘hard’ checks (where the interviewer will be required to correct values that were definitely wrong) and ‘soft’ checks (where potentially incorrect values are brought to the attention of the interviewer for confirmation or correction) were carried out.
The full Phase 2 survey questionnaire is included in the Technical Annex.
13
Fourteen of the Phase 2 homeowners said they did not know if they were on or off the gas grid. This was split between 12 in England and 2 in Scotland. For the purposes of the table above, and the choice experiment conducted during Phase 2, these homeowners were considered as being on the gas grid.
Choice experiment design
The Phase 2 questionnaire included a ‘choice experiment’ which was selected as the best method of measuring the attractiveness of more efficient heating systems relative to each other.
A discrete choice-based approach was used, presenting homeowners with information about different heating systems and asking them to make a choice between them. This required homeowners to trade-off the different benefits associated with the different options and so uncovered their priorities and views towards each of the technologies. Homeowners were asked to make up to eight choices between pairs of more efficient heating systems. The more efficient heating systems included in the choice experiment were:
Gas condensing boiler (only shown to those connected to the gas grid);
Micro-combined heat and power (only shown to those connected to the gas grid);
Ground source heat pump (only shown to those with private outside space);
Air source heat pump (shown to all);
Biomass boiler (shown to all); and
Heat network (shown to all).
Although heat networks are currently only likely to be available in high density urban areas, they were shown to all homeowners during the choice experiment to future proof this research.
Homeowners were asked to make their choice on the premise of a non-emergency situation where their current heating system still worked but was possibly coming towards the end of its life, or that they wanted to replace it for another reason. The approach mimicked, as closely as possible in survey research, the real life decision situation homeowners would go through and the information they would use to make their decision.
The outputs from the choice experiment were used to explore the share of the population likely to take up one type of more efficient technology over another in a range of cost, grant and tariff scenarios. The analysis provides an order of preference between different heating systems when homeowners were in the scenario of considering replacement of their current heating system.
It is important to note that the choice experiment does not offer a market forecast. It was based on homeowners receiving basic and unbiased information about each system – and there are a variety of other factors that could influence uptake. These include marketing activity by providers, reputation, word-of-mouth, whether the homeowner is at a key ‘trigger point’, tailored advice, competitive activity and government awareness-raising activities.
Estimates are a short term measure of current appeal, based on the offer being available to everyone at one point in time. The results offer a snapshot based on homeowners’ current financial, economic and household situation.
Figure 8 sets out the stages in the survey which led up to the choice experiment. Further information about the choice experiment methodology is presented in the Technical Annex.
Figure 8: Sequencing of Phase 2 survey and choice experiment
5
Version 1 | Internal Use Only © Ipsos MORI
Phase 2 choice experiment – build up to asking trade-offs
Asked level of awareness of lower carbon technologies– based only on name of technology, with no information given
Shown factsheets with basic information about each technology. – only shown
options suitable for their property type. Asked how positive/negative feel about each.
Shown list of attributes and given explanation of each one e.g. annual payment Asked to consider scenario where they had decided to replace existing heating system - not emergency, still works but maybe coming towards end of its life or want to replace for another reason
Told cost info they were about to see was based on a property of a similar type
to theirs. If had no radiators told it included cost of installing radiator system if required.
Shown pairs of choices between lower carbon technologies and asked to select the one they would prefer to install in their home.
Figure 9: Example factsheet shown to survey respondents
Air Source Heat Pump
Key Facts
• Estimated to last 20 years.
• Typically takes 0.5 -1 day to install.
• Space needed on the outside wall.
• Needs little maintenance.
• Uses renewable fuel source and electricity.
• Emits some noise outside of the building.
• Space is needed for a hot water tank
Air source heat pumps extract heat from
the outside air. The heat is circulated
using radiators or underfloor heating.
They provide all your heating, and all or
some of your hot water.
See Figure 9
See Figure 10
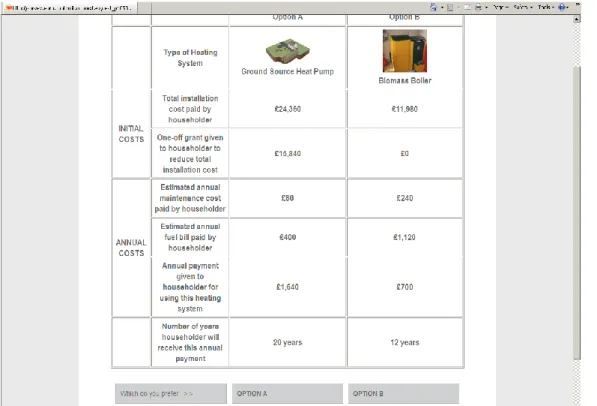
Figure 11: Example choice screen shown to survey respondents during the choice experiment
The values presented next to each of the attributes shown in Figure 11 varied between choice screens. This enabled the choice experiment to test the trade-offs made by homeowners in a very large number of cost scenarios. Figure 12 below shows the range of levels assigned to each attribute.
Figure 12: Range of attributes shown to survey respondents during the choice experiment
Attribute Level 1 Level 2 Level 3 Level 4 Level 5
Total installation cost Large decrease
Medium decrease
Current Medium increase
Large increase One-off grant (as
proportion of installation cost)
0% 10% 65% 100% 130%
Annual maintenance cost
Fixed variable – single figure for each technology
Annual fuel bill Large decrease
Medium decrease
Current Medium increase
Large increase Annual payment given
to householder
0% of RHI consultation tariff level
35% of RHI consultation tariff level
65% of RHI consultation tariff level14
100% - RHI consultation tariff level
135% of RHI consultation tariff level Number of years
householder receives annual payment
3 years 5 years 7 years 12 years 20 years
14The domestic RHI consultation document launched in September 2012. The ‘RHI 2012 consultation tariff level’
was used to set the tariff ranges in this research. More information about the consultation is available here:
https://www.gov.uk/government/consultations/renewable-heat-incentive-proposals-for-a-domestic-scheme. The tariff amounts can be tested with any tariff length as the model incorporates a discount as the tariff value is spread over an increased number of years.
During the choice experiment homeowners were not able to give a neutral or ‘don’t know’ answer. They were however asked a follow-up question after each choice screen. This asked:
- How likely they would be to actually install their selected technology in their current property in a non-emergency situation when their existing heating system still works but was maybe coming towards the end of its life (or they wished to replace it for another reason).
Where the results of the choice experiment are discussed in this report, the preference results between the technologies have been adjusted to account for likely over claim. This has been done using
homeowners’ stated likelihood of installing their selected technology which has been converted into a probability of uptake using an average down-weighting variable. This down weighting variable has been created by Ipsos MORI and is frequently used in customer and brand loyalty research to adjust consumer claims about purchasing high price ticket products or switching services.
The results of the choice experiment were also used to calculate a ‘barrier cost’. That is the critical price or discount (the ‘tipping point’) at which homeowners would be persuaded to switch from their current heating system to a more efficientoption15.
Likely uptake of solar thermal was tested separately to the main choice experiment, as a solar thermal system would only provide hot water and not central heating. It could not therefore be compared like-for-like with the other systems. The appeal of solar thermal, and the relative like-for-likelihood of installing it, was only explored with homeowners who owned the roof on their building. Respondents were again presented with a one page factsheet about the technology and its allied costs.
1.3.3 Phase 3: Qualitative Follow-up Interviews
Phase 3 involved 18 qualitative in-depth telephone interviews with homeowners who had already completed the Phase 2 survey and were willing to be re-contacted for further research. Each interview lasted approximately 45 minutes.
The purpose of these interviews was to provide a deeper understanding of decision-making, influences and preferences dictating answers in the earlier choice experiment. Wider issues were also covered – such as how homeowners would finance a new heating system, their reasons for postponing installation in the past, and to understand in greater detail the related decision-making process. The interview guide used in these discussions is included in the Technical Annex.
Two or three choice scenarios from Phase 2 were discussed in detail during each telephone interview. This ensured that each technology was discussed with at least six homeowners.
The demographic details of the follow-up interviewees are also given in the Technical Annex. As a qualitative exercise, this was not designed to be representative of all owner-occupiers, but rather reflective of the range of views expressed in Phase 2.
The fieldwork took place between 15 and 26 October 2012.
15
Further information on the barrier costs calculated using the choice experiment results will be published separately.
1.4 Presenting the findings
1.4.1 Report structure
This report draws on all three phases of the research to answer the research questions stated in section 1.2.1. The evidence is clearly referenced to the appropriate phase of the research throughout and where views varied either between phases, or between different groups of homeowners this is clearly stated. The main body of the report consists of the following chapters:
Chapter 2: Attitudes towards current heating systems – Examines the heating systems currently
being used by homeowners and the extent to which they are meeting household needs.
Chapter 3: Attitudes towards replacing heating systems – Examines the frequency with which
homeowners have replaced their heating systems – and reasons for not doing so. It also discusses the expected future replacement of systems.
Chapter 4: Future preferences for heating system – Discusses the level of appeal of more efficient
heating technologies. It presents the relative preference between these technologies and the key drivers affecting likely uptake. It also explores homeowners’ reactions to financial assistance in the form of either a one-off upfront grant or an ongoing tariff payment.
Chapter 5: Conclusions – Draws together the findings presented throughout the report to reach overall
conclusions about the likely uptake of more efficient heating systems, key barriers and triggers.
1.4.2 How generalisable are the findings from this research?
Throughout this study, each phase has been designed to produce high quality and robust results. The workshops and follow-up interviews draw upon qualitative research designed to reveal the breadth of views that exist across the owner occupier population. However, as with any qualitative research, it is not possible from these phases to determine what proportion of the population hold each of these views. The initial workshops and follow-up telephone interviews were used to shed light on why homeowners
express particular views, rather than how many hold those views (provided by the Phase 2 survey). The results from the workshops and interviews are therefore intended to be illustrative rather than statistically reliable.
Representative data on the attitudes and behaviours of owner-occupiers is provided by the Phase 2 survey and choice experiment. This provides representative results across Great Britain. The data has been weighted to be balanced by region, however, the results for Scotland or Wales alone are not representative of these nations.
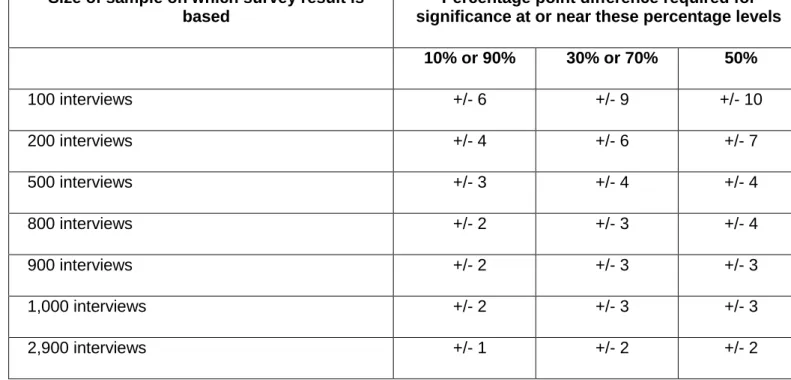
As a sample of homeowners, rather than the entire population, was interviewed the results are subject to sampling tolerances which means that not all differences between results are statistically significant. For example, for a question where 50% of the respondents in a weighted sample of 1,000 respond with a particular answer, the chances are 95 in 100 that this result would not vary more than plus or minus three percentage points from the result that would have been obtained from a census of the entire population (using the same procedures). Indications of approximate sampling tolerances for the Phase 2 survey, and for surveys of smaller groups of respondents, are provided Figure 13. As shown, sampling tolerances vary with the size of the sample and the size of the percentage results. This survey used a quota sampling approach. Strictly speaking the tolerances applied here apply only to random samples with an equivalent design effect. In practice, good quality quota sampling has been found to be as accurate.
Figure 13: Confidence intervals for Phase 2 survey
Size of sample on which survey result is based
Percentage point difference required for significance at or near these percentage levels
10% or 90% 30% or 70% 50%
100 interviews +/- 6 +/- 9 +/- 10
200 interviews +/- 4 +/- 6 +/- 7
500 interviews +/- 3 +/- 4 +/- 4
800 interviews +/- 2 +/- 3 +/- 4
900 interviews +/- 2 +/- 3 +/- 3
1,000 interviews +/- 2 +/- 3 +/- 3
2,900 interviews +/- 1 +/- 2 +/- 2
The Phase 2 survey results allow robust comparisons in the findings for particular groups of
homeowners. For instance, the attitudes of homeowners living off the gas grid about air source heat pumps can be compared robustly with the views of this technology held by those living on the gas grid. A difference in the findings for two groups of homeowners needs to be of a certain size in order to be statistically significant however. The difference in results must be greater than the values provided in Figure 14 below. Again, strictly speaking the sampling tolerances shown here apply only to random samples with an equivalent design effect. In practice, good quality quota sampling has been found to be as accurate. Where differences in the Phase 2 survey results between particular groups of homeowners are discussed in this report these are statistically significant differences at the 95% confidence interval.
Figure 14: Interpreting Phase 2 subgroup findings
Size of sample on which survey result is based
Percentage point difference required for significance at or near these percentage levels
10% or 90% 30% or 70% 50%
100 and 100 +/- 8 +/- 13 +/- 14
200 and 200 +/- 7 +/- 10 +/- 11
200 and 500 +/- 5 +/- 8 +/- 8
500 and 500 +/- 4 +/- 6 +/- 6
1,928 and 920 (on and off gas grid) +/- 2 +/- 4 +/- 4
The figures produced by the Phase 2 choice experiment are probabilities rather than mean scores or percentages and so it is not generally appropriate to conduct significance testing on these estimates.
However,a rule of thumb to guide interpretation of the choice experiment results is presented below. Three findings from the model are presented as examples of the difference in results needed to consider the variation significant.
Figure 15: Interpreting Phase 2 choice experiment findings
Adjusted share percentage Confidence interval at 95% level (i.e. possible range this finding could fall
within)
1% of all survey respondents (2,848) opting for a ground source heat pump
+/- 0.13
1.5% of all off gas grid survey respondents (906) opting for an air source heat pump
+/- 0.31
15% of all on gas grid survey respondents (1,911) opting for a gas condensing boiler
+/- 0.68
1.4.3 Terminology used in the report
Throughout this report the evidence being discussed is clearly referenced back to the appropriate phase of the research using the following terminology:
Phase 1 homeowners are referred to as workshop participants;
Phase 2 homeowners are referred to as survey respondents; and
Phase 3 homeowners are referred to as follow-up interview participants.
Where this distinction is not made it is because the finding being discussed applied to homeowners from several phases of the study.
Where the report presents percentages these are all taken from the Phase 2 survey. As stated in section 1.4.2 above, it is not possible in qualitative research to provide percentages of respondents who gave one view or another. However, where possible this report does provide a sense of how prevalent views were in the workshops and follow-up interviews. Terminology such as ‘most homeowners felt….’ is used to indicate that a view was widely shared. Where the report refers to ‘most’ homeowners this indicates that this view was held by nearly all the homeowners involved in the Phase. ‘Many’ homeowners refers to a significant proportion of homeowners, while ‘some homeowners’ will usually refer to a particular group of respondents who held one view in contrast to another group holding a different view.
The report does also include the views expressed by only a few workshop or follow-up interview participants. These could be considered minority views but are still pertinent to include if they were strongly held views by a small number of individuals, or if they represented emergent discourses. The report therefore sometimes refers to ‘a few’ or ‘a couple’ of homeowners to illustrate the presence of important minority views. Any quantification such as this used in the reporting should always be considered indicative, rather than exact.Verbatim comments have been included in this report to illustrate and highlight key points, whether they are key because they are shared by a large number of homeowners or because they reflect the strong views of a smaller subset.