From:
Education at a Glance 2012
Highlights
Access the complete publication at:
http://dx.doi.org/10.1787/eag_highlights-2012-en
How many students study
abroad and where do they go?
Please cite this chapter as:
OECD (2012), “How many students study abroad and where do they
go?”, in
Education at a Glance 2012: Highlights
, OECD Publishing.
http://dx.doi.org/10.1787/eag_highlights-2012-9-en
This document and any map included herein are without prejudice to the status of or
sovereignty over any territory, to the delimitation of international frontiers and boundaries and to
the name of any territory, city or area.
1. EDUCATION LEVELS AND STUDENT NUMBERS
EDUCATION AT A GLANCE 2012: HIGHLIGHTS © OECD 2012
24
How many students study abroad and where do they go?
– More than 4.1 million tertiary-level students were enrolledoutside their country of citizenship in 2010.
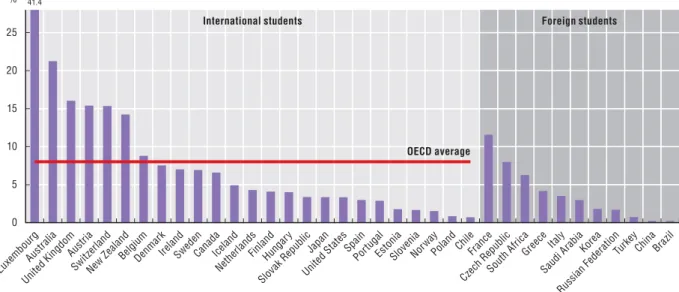
– Australia, Austria, Luxembourg, New Zealand, Switzerland and the United Kingdom have the highest percentages of international students among their tertiary students.
– Asians account for 52% of all students studying abroad world-wide. In absolute terms, the largest numbers of international students are from China, India and Korea.
– Some 77% of students worldwide who study abroad do so in OECD countries. This proportion has remained stable during the past decade.
Significance
This section looks at the extent to which students are studying abroad and their preferred destinations. Pursuing higher-level education in a foreign country allows students to expand their knowledge of other cultures and languages, and to better equip themselves in an increasingly globa-lised labour market. Beyond its social and educational effects, studying abroad has a considerable economic impact. The internationalisation of education is likely to have a growing impact on some countries’ economy as a result of revenue from tuition fees and domestic consump-tion by internaconsump-tional students.
Findings
OECD countries attract the bulk of students who study abroad worldwide – almost four out of five. Many of these come from other OECD countries, mainly Canada, France, Germany, Japan, Korea, Turkey and the United States. In terms of where students choose to study, the United Kingdom and the United States each receive more than 10% of all foreign students worldwide. Europe is the preferred destination for students studying outside their country, with 41% of all international students. North America has 21% of all international students. Nevertheless, the fastest growing regions of destination are Latin America and the Caribbean, Oceania, and Asia mirroring the internationali-sation of universities in an increasing set of countries (see Chart C4.1 and Table C4.6 in Education at a Glance 2012). In a number of countries, especially in Australia and New Zealand, the large presence of international students has a significant impact on tertiary graduation rates (see Chart A3.1 in Education at a Glance 2012). If data from inter-national students are excluded, Australia’s graduation rate
from university-level first degree programmes drops by 16 percentage points and New Zealand’s by 7 percentage points.
Trends
Over the past three decades, the number of international students has increased fivefold from 0.8 million worldwide in 1975 to 4.1 million in 2010. This growth has accelerated during the period, mirroring the processes of economic and social globalisation. The global increase in the number of international students also reflects the overall increase in tertiary enrolment.
Since 2000, the number of foreign tertiary students enrolled worldwide has increased by 99%, for an average annual growth rate of 7.1%. The number of foreign tertiary students enrolled in OECD countries doubled since 2000, for an average annual growth rate of 7.2%.
Definitions
Data on international and foreign students are based on the UOE data collection on education statistics, adminis-tered annually by the OECD. Data from the UNESCO Insti-tute for Statistics are also included. Students are classified as “international” if they left their country of origin and moved to another country to study. Students are classified as “foreign” if they are not citizens of the country in which they are studying. This latter category includes some stu-dents who are permanent resistu-dents, albeit not citizens, of the countries in which they are studying (for example, young people from immigrant families).
Information on data for Israel: http://dx.doi.org/10.1787/888932315602.
Going further
For additional material, notes and a full explanation of sourcing and methodologies, see Education at a Glance 2012 (Indicator C4).
Areas covered include:
– Distribution of students by country of origin and destination.
1. EDUCATION LEVELS AND STUDENT NUMBERS
EDUCATION AT A GLANCE 2012: HIGHLIGHTS © OECD 2012
25
How many students study abroad and where do they go?
Figure 1.13. Trends in international education market shares (2000, 2010) This figure shows the distribution of foreign and international students in tertiary education, by destination.
Source:OECD (2012), Education at a Glance 2012, Table C4.7, available at: http://dx.doi.org/10.1787/888932667349.
Figure 1.14. Student mobility in tertiary education, 2010 This figure shows the percentage of international students at the tertiary level in each country.
Source:OECD (2012), Education at a Glance 2012, Table C4.1, available at: http://dx.doi.org/10.1787/888932667235.
25 20 15 10 5 0
OECD countries 2000 2010 Other G20 and non-OECD countries 2000 2010 Market share (%)
Unite d Sta
tes
Unite d Ki
ngdom
Aus tral
ia Ger
man y
Fran ce
Can ada
Rus
sian
Fede
ratio n Japa n Spai n Chin a
New Z eala
nd Italy
Aus tria
Sou
th Af
rica
Kor ea
Belg ium
Swit
zerla
nd
Nethe
rland
s Swede
n
Othe
r OEC
D
Othe
r G20 a
nd n
on-O ECD 25 20 15 10 5 0 % 41.4
Luxemb our
g Aus
tralia
Unite d Ki
ngdomAus
tria
Swit
zerla
nd
New Z eala
nd
Belg ium
Den mar
k Irela
nd Swede n Can ada Icel and Nethe
rlan
ds Finla
nd
Hun gary
Slova
k Rep
ublicJapa n
Unite d Sta
tes
Spai n
Por tugal
Esto
nia Slove nia Nor way Pola nd Chil e Fran
ce
Czec h R
epu blic
Sou
th Af
rica
Greece It aly
Sau
di A
rabiaKor ea
Rus
sian
Fede
ratio
n
Turke y
Chin a
Braz il
Foreign students International students
EDUCATION AT A GLANCE 2012: HIGHLIGHTS © OECD 2012