High-thr
oughput Pr
ocess Dev
elopment with Pr
eDictor Plates –
Principles and Methods
High-throughput
Process Development
with PreDictor
™
Plates
Principles and Methods
GE Healthcare
imagination at work
imagination at work
GE, imagination at work, and GE monogram are trademarks of General Electric Company. ÄKTA, ÄKTA avant, AxiChrom, BioProcess, Capto, Deep Purple, Drop design, HiScreen, HiTrap, MabSelect, MabSelect SuRe, MabSelect Xtra, PreDictor, ReadyToProcess, Sepharose, and Tricorn are trademarks of GE Healthcare companies.
Capto ViralQ: Separating viral particles with Capto Q products may require a license under
United States patent number 6,537,793 B2 and equivalent patents and patent applications in other countries owned by Centelion SAS. Such a license is not included with the purchase of Capto Q but is included with the purchase of Capto ViralQ products.
With the purchase of Capto ViralQ the customer is granted a free limited license under US patent 6,537,793 B2 and equivalent patents and patent applications in other countries owned by Centelion SAS to separate viral particles solely through use of the product purchased.
Deep Purple Total Protein Stain: Deep Purple Total Protein Stain is exclusively licensed
to GE Healthcare from Fluorotechnics Pty Ltd.Deep Purple Total Protein Stain may only be used for applications in life science research. Deep Purple is covered under a granted patent in New Zealand entitled “Fluorescent Compounds”, patent number 522291 and equivalent patents and patent applications in other countries.
Tricorn Columns: The Tricorn column and components are protected by US design patents
USD500856, USD506261, USD500555, USD495060 and their equivalents in other countries. All third party trademarks are the property of their respective owners.
© 2009 General Electric Company – All rights reserved. First published Dec. 2009.
All goods and services are sold subject to the terms and conditions of sale of the company within GE Healthcare that supplies them. A copy of these terms and conditions is available on request. Contact your local GE Healthcare representative for the most current information.
GE Healthcare UK Ltd Amersham Place Little Chalfont
Buckinghamshire, HP7 9NA, UK GE Healthcare Bio-Sciences Corp 800 Centennial Avenue P.O. Box 1327
Piscataway, NJ 08855-1327, USA GE Healthcare Europe GmbH Munzinger Strasse 5 D-79111 Freiburg, Germany GE Healthcare Japan Corporation Sanken Bldg. 3-25-1 Hyakunincho, Shinjuku-ku, Tokyo 169-0073, Japan
For local office contact information,
please visit www.gelifesciences.com/contact
www.gelifesciences.com/predictor
GE Healthcare Bio-Sciences AB
Björkgatan 30
751 84 Uppsala
Sweden
Handbooks
from GE Healthcare
GST Gene Fusion System
Handbook 18-1157-58
Affinity Chromatography
Principles and Methods 18-1022-29
Antibody Purification
Handbook 18-1037-46
Ion Exchange Chromatography and Chromatofocusing
Principles and Methods 11-0004-21
Cell Separation Media
Methodology and Applications 18-1115-69
Purifying Challenging Proteins
Principles and Methods 28-9095-31
Isolation of mononuclear cells
Methodology and Applications 18-1152-69
High-throughput Process Development with PreDictor Plates
Principles and Methods 28-9403-58
Gel Filtration
Principles and Methods 18-1022-18
Recombinant Protein Purification Handbook
Principles and Methods 18-1142-75
Protein Purification
Handbook 18-1132-29
Hydrophobic Interaction and Reversed Phase Chromatography
Principles and Methods 11-0012-69
2-D Electrophoresis using immobilized pH gradients
Principles and Methods 80-6429-60
Microcarrier Cell Culture
Principles and Methods 18-1140-62
Nucleic Acid Sample Preparation for Downstream Analyses
Principles and Methods 28-9624-00
High-throughput
Process Development
with PreDictor Plates
Contents
Introduction...3
1... Process.development.in.PreDictor.96-well.plates...5
1.1 Why use PreDictor 96-well plates as part of a process development workflow? ... 5
1.2 Screening experiments in PreDictor plates vs small-scale columns ... 5
1.3 What types of studies can be performed? ... 6
1.4 How PreDictor plates work and how screening experiments are performed ... 6
2.. Batch.experiments.using.PreDictor.plates...7
2.1 Batch experiments using PreDictor plates vs column chromatography ... 7
2.2 The batch experiment ... 7
2.3 Capacity determinations... 8
2.4 The adsorption isotherm ... 9
2.5 Incubation time ...10
2.6 Phase ratio ...11
2.7 Sample concentration and media volume ...11
2.8 Mixing ...12
2.9 Types of studies ...12
3.. Practical.considerations...17
4.. Application.examples...19
4.1 Screening binding conditions on Capto S using PreDictor plates ...19
4.2 Effect of incubation time, pH, and ionic strength on the binding of amyloglucosidase to Capto DEAE ...20
4.3 Optimization of the wash step for MabSelect SuRe ...22
4.4 Screening elution pH on MabSelect SuRe ...24
4.5 Rapid development of CIP protocols for affinity media ...26
4.6 Adsorption isotherms with PreDictor plates ...28
5.. Quality.aspects.of.the.PreDictor.plate.workflow...31
5.1 Functional testing of reproducibility ...31
5.2 Increasing the robustness of experiments ...31
5.3 Method variability vs chromatography media volume variability ...32
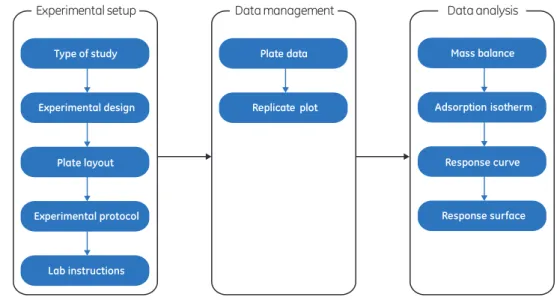
6.. Assist.software...35
6.1 Assist software workflow ...35
7.. PreDictor.plate.selection...39
. 7.1 PreDictor Plate selection guide ...39
7.2 Available plates ...41
8.. Experimental.designs/setups...43
9.. Steps.in.process.development.following.screening...45
9.1 HiScreen and HiTrap columns ...45
9.2 ÄKTA chromatography systems and UNICORN control software...46
9.3 BioProcess media ...46
10.. References...47
11.. Nomenclature...49
12.. Ordering.information...51
PreDictor plates ...51
Software ...52
Related products ...52
Introduction
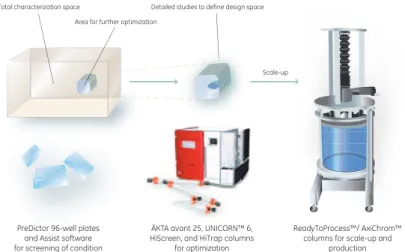
Time-to-clinic and time-to-market are two key factors for successful biopharmaceutical development. Efficient development of the manufacturing process is a crucial component of the overall project plan. However, screening optimal process conditions can be time-consuming and tedious. In addition, steadily increasing demands from regulatory authorities for better understanding and control of manufacturing processes put even more pressure on development work. Employing high-throughput tools for process development helps address these challenges. High-throughput process development (HTPD) shortens development time at the same time as it increases the amount of information available during early process development. Evaluating chromatographic conditions can be performed in parallel using 96-well filter plates. As a result, a large number of experimental conditions can be evaluated simultaneously. This allows a large experimental space to be characterized and supports the definition of a well-established process design space where process parameters that need to be monitored and controlled are understood (Fig 1).
This handbook focuses on process development work in PreDictor 96-well filter plates, which are prefilled with chromatography media (resins). The handbook describes how results obtained using PreDictor plates can be used to define process conditions for large-scale chromatography. Applications of PreDictor plates are provided, as well as practical hints and tips. Assist software, dedicated to allow high-throughput methodology using PreDictor plates, is also described.
1. Process development in
PreDictor 96-well plates
1.1 Why use PreDictor 96-well plates as part of a process
development workflow?
In the past, process development was either performed using tedious and time-consuming column experiments, or such experiments were simply not performed. This resulted in a less well understood and less well optimized process. With PreDictor plates, many types of experiments can be performed in parallel, which result in significant time-savings and lower consumption of sample and other reagents. The high-throughput format allows rapid screening of a wide range of conditions and thus allows generation of large amounts of valuable process data.
The workflow in a PreDictor experiment comprises the same steps as any column experiment. When using PreDictor plates, the fundamental interactions between the chromatography medium and the target molecule are the same as in chromatography columns. Basic concepts such as mass balance, rate of uptake, and adsorption isotherms are the same for PreDictor plates and chromatography columns. Successful application of PreDictor experiments does not require in-depth knowledge of these concepts nor of the equations presented later in this handbook. The applications presented show that data obtained in PreDictor experiments are relevant for full-scale process design and characterization.
1.2 Screening experiments in PreDictor plates vs small-scale columns
High-throughput tools such as PreDictor plates and Assist software are suitable for early chromatographic screening experiments. They can be used for the initial screening of process conditions, or for a more thorough investigation of a defined space as a basis for detailed process understanding and/or robustness studies.
After scouting and screening with PreDictor plates, verification and fine-tuning are still performed with ÄKTA™ design systems such as ÄKTA avant™ 25 at a smaller scale than the expected manufacturing process, see Section 9. Prepacked formats such as HiScreen™ 10 cm bed height columns are recommended, or HiTrap™ 1 ml and 5 ml columns if sample volumes are low, see Ordering information.
Figure 1 shows a conceptual workflow for process development with PreDictor plates as the starting point.
PreDictor 96-well plates and Assist software for screening of condition
ÄKTA avant 25, UNICORN™ 6, HiScreen, and HiTrap columns
for optimization
ReadyToProcess™/ AxiChrom™ columns for scale-up and
production
Total characterization space Detailed studies to define design space
Scale-up Area for further optimization
1.3 What types of studies can be performed?
PreDictor plates are used to:
• Screen chromatographic conditions. This includes all parts of the chromatographic cycle: Binding, wash, elution, and cleaning-in-place. Screening can be performed for different media simultaneously, or for a single selected medium.
• Determine adsorption isotherms. Briefly, the adsorption isotherm describes the relationship between the concentrations of protein(s) in the liquid and solid phases at equilibrium under a given set of experimental conditions. This helps understand and correctly describe what happens during protein uptake under different conditions. It also helps to determine optimal phase ratios (ratio between sample volume and volume of chromatography medium) for capacity, wash, or elution studies.
Typical applications for PreDictor 96-well plates are shown in Table 1.
Table.1. Studies that can be performed with PreDictor plates
Study Factors Comments..
Binding conditions Protein concentration, conditions
(salt, pH, etc.), incubation time Qualitative and quantitative analyses of capacity Wash conditions Protein concentration, conditions
(salt, pH, additives, etc.) Intermediate wash step(s) can improve purity of the next step, i.e., elution Elution conditions Conditions (salt, pH, additives, etc.) Conditions for step elution and also
gradient elution can be studied. Small systematic differences in conditions can be used to mimic a chromatography gradient elution.
Cleaning-in-Place (CIP) Conditions (salt, pH, additives, etc.), time Effectiveness of different CIP solutions can be tested
Adsorption isotherms Conditions (salt, pH, additives, etc.) Utilizes the convenience of the 96-well plate format for constructing adsorption isotherms
Determination of optimum phase ratio for capacity/wash/elution studies
1.4 How PreDictor plates work and how screening experiments
are performed
Each well in a PreDictor plate represents a batch. The main difference between a batch and a column is that in the batch, each separation only occurs once. In the column, we see a cascade of stages, sometimes referred to as theoretical plates.
The batch system can be used to investigate the distribution of target protein between the chromatography medium and the liquid phase. The batch experiment involves the same steps of equilibration, sample addition, wash, and elution as a column chromatographic separation. Experimental setups using high-throughput PreDictor 96-well plates allow simultaneous testing of many different conditions (factors) such as pH, salt, etc. Experimental setups such as Design of Experiments (DoE), which uses statistics to identify and define factors having the greatest impact on the process or product, facilitate complex screening of conditions using PreDictor plates. Other experimental setups can, however, also be used.
In summary, applying high-throughput techniques means that future-generation processes can be developed quicker and more thoroughly.
2. Batch experiments using PreDictor plates
2.1 Batch experiments using PreDictor plates vs column
chromatography
In a typical adsorption process, both the mass transfer mechanism (responsible for protein transport) and ligand selectivity are independent of the mode of operation, that is, the adsorption process is the same whether it occurs in a batch system or in a packed column. In a column however, the adsorption process occurs continuously during the transport of protein through the column. This repeated adsorption process is described as a cascade of stages (column theoretical plates) where adsorption occurs. One well in a PreDictor 96-well plate can be regarded as a single stage in such a cascade.
In a chromatography column, any separation taking place in a single stage is further magnified by the next stage in series. However, as long as a difference in adsorption capacities/rates for different constituents of a sample can be quantitated in a single well, the results obtained using PreDictor plates can be used to describe the same separation occurring in a column. The workflow in a batch experiment comprises the same steps as any column experiment - equilibration of the medium with the desired buffer, sample application, wash, and elution (Fig 2) - and therefore the same types of study can be performed on both formats (Table 1).
Medium
in well EquilibrationWash/ additionSample 1–3 timesWash
Analysis
Elution 1–3 times
Incubation
Mixing Mixing Mixing
Vacuum filtration or centrifugation Vacuum filtration or centrifugation
Waste
Fig.2. Schematic illustration of the workflow of a batch experiment in the wells of a PreDictor plate. The same steps would
be employed in a column experiment, i.e., equilibration, sample addition, wash, and elution. The gray color in the wells is chromatography medium, red shades (red and pink) describe different concentrations of protein solution, brown is medium with bound sample.
2.2 The batch experiment
Batch experiments investigate the distribution of target protein(s) between the solid phase (chromatography medium) and the liquid phase. In a finite bath (batch) system, the amount of target protein is constant and is either free in solution or bound to the medium in the well. Initially when sample is added, none of the target protein is bound to the medium. After a certain incubation time, however, it becomes distributed between the liquid and solid phases (Fig 3).
Filter-plate well
Phase separation
Collection plate well
Incubation time
tstart tfinal
Mass added = mass unbound + mass bound
Filter-plate well
Fig.3. Schematic illustration of the mass balance in a single well. At tstart, all protein is in liquid phase. At tfinal, the protein is distributed between the solid and liquid phases.
Two different approaches can be used to determine the distribution of a protein between the phases: 1). Calculate the amount of protein bound to the solid phase (mbound) as the difference between
the amount added to the well (madded) and the amount remaining in the liquid phase (munbound):
m
bound= m
added− m
unbound (1)2). Perform a number of consecutive wash and elution steps to elute the protein. The amount of eluted protein (meluate) is the amount of protein bound (mbound) to the solid phase:
m
bound= m
eluate (2)When performing a full experiment with all steps, the full mass balance can be obtained by collecting and analyzing all fractions (flowthrough [FT], wash, elution). The amount added should be found either as unbound or bound protein:
m
added= m
bound+
m
unbound↔
m
added= m
eluate+ m
FT+ m
wash (3)The recovery can be calculated from the amount bound, unbound, and added:
Recovery (%) = 100 ×
m
bound+
m
unboundm
added(4)
Yield can be calculated from the amount of protein eluted from the solid phase and the amount bound:
Yield (%) = 100 ×
m
eluatem
bound (5)2.3 Capacity determinations
The two different approaches described above for determining the amount of protein bound to the medium can be used to calculate the capacity of a medium under a given set of experimental conditions.
Equation 1 can also be expressed in terms of concentration (Eq. 6):
m
bound= m
added–
m
unboundV
↔
medium×
q = V
liq×
(
c
o–
c
unbound)
(6)where q is the binding capacity of the medium under given conditions at termination of incubation,
Vmedium is the volume of medium in the well, Vliq is the volume of liquid in the well, co is the concentration of target protein at the start of the experiment (t=0), and cunbound is the concentration of target protein found in the flowthrough (liquid phase) at termination of incubation.
Binding capacity can also be calculated from the protein concentrations found in the eluate(s):
q =
V
medium i
1
V
eluate, i×
eluate, ic
(7) where i = each individual elution operation
Always calculate capacities using flowthrough data unless the experimental conditions are such that all of the bound material is recovered in the eluate fractions.
For most accurate results in the calculations, the volume of retained liquid in a well (Vr) has to be accounted for. Vacuum filtration and centrifugation do not entirely eliminate all liquid from PreDictor plate wells; liquid always remains both in the pores of the chromatography medium and in the filters of the plate wells after these procedures. With PreDictor plates, measurements have shown that the volume of liquid retained by the medium is approximately 60% of the medium volume (Vmedium), and that about 6 µl of liquid is retained in the filter. The retained liquid volume, Vr is therefore a function of the medium volume (Vmedium) in the well:
Vr = 6 µl + 0.6 Vmedium (8)
When accounting for retained volume in, for example, Equation 6, use
co csample × Vsample
Vsample + Vr
= (9)
instead of
co = csample (10)
and
Vliq = Vsample + Vr (11)
instead of
Vliq = Vsample (12)
2.4 The adsorption isotherm
A good understanding of thermodynamic and kinetic effects is needed to correctly describe a chromatographic separation. The thermodynamics of protein adsorption is described by the adsorption isotherm, which describes the relationship between concentration of protein in the liquid and solid phases at equilibrium under a given set of experimental conditions. Among many types of adsorption isotherms, the Langmuir isotherm is frequently used to describe protein adsorption. It is the only type of isotherm discussed in this handbook. Equation 13 describes the Langmuir isotherm for a single-component system.
q
=
q
max×
c
eqwhere qmax is the maximum saturation capacity, Kd is the equilibrium dissociation constant, ceg
is the concentration of target protein in the liquid phase at equilibrium, and q is the binding capacity of the medium (concentration of target protein in the solid phase). The isotherm thus describes how q changes with ceq as illustrated in Figure 4.
The isotherm provides information about the maximum capacity (qmax) of the medium for a given target molecule under given conditions. It also provides information on the binding strength (Kd). With good binding conditions (low Kd), the isotherm is relatively ”rectangular”, that is, it has a large plateau in which the capacity is relatively independent of the equilibrium concentration. The linear part of the isotherm is reached at low equilibrium concentrations. In this region, capacity is proportional to the equilibrium concentration (Fig 4).
120 100 80 60 40 20 0
Binding capacity (solid phase),
q
(g/l)
Conc. of target protein at equilibrium (liquid phase), ceq
Kd = concentration at which q = Plateau region
qmax
0 1 2 3 4 5
qmax
2
Fig.4. A Langmuir isotherm where the maximum binding capacity, qmax=100 g/l and dissociation constant, Kd=0.1 g/l are both
indicated by red lines. The plateau region where capacity is relatively independent of equilibrium concentration is indicated.
2.5 Incubation time
Incubation time (also known as contact time) describes how long the target protein is in contact with the medium. Note that capacity varies with incubation time. For long incubation times, capacity will approach the equilibrium dictated by the isotherm (Fig 4). For shorter times, it will depend on the kinetics of uptake (Fig 5). If these kinetics are fast, the capacity difference between the two incubation times will be small. If slow, this difference will be large.
If plate incubation times are compared with column residence times, incubation times are generally longer. This difference relates to differences in the techniques. Incubation time corresponds better to the total loading time in columns since it reflects the total time chromatography media beads are in contact with the sample.
An incubation time of 60 min in PreDictor plate experiments will generally give a good estimate of the potential binding capacity. Shorter times may suffice, depending on the uptake kinetics.
For adsorption isotherm studies, longer incubation times (e.g., 3 h) are preferable. Some systems will nevertheless give an adequate estimation of the isotherm with an incubation time of just 60 min.
Binding capacity, q (g/l) 2 5 10 15 30 60 160 0 20
0 5 10 15 20 25
Incubation time (min) 30 35 40 45 50 55 60 40 80 100 120 140 60
Kinetics of uptake
2.6 Phase ratio
An important aspect to consider when setting up an experiment is the phase ratio ( ), which is the ratio between liquid volume and media volume. The mass balance equation (Eq. 6) can be rewritten with the phase ratio.
q =
c
o– c
(14)where
=
V
liqV
mediumFor a given system, and co are constants, and q is therefore a linear function of the
concentration of target protein in the liquid phase, c. The line described by the equation is called the operating line (Fig 6). Any measurement with the given system will be found along this line.
Binding capacity,
q
(g/L)
2 5 10 15 30 60
160
0 20
0 1
Conc. of target protein (liquid phase), c (g/l)
2 3 4
40 80 100 120 140
60
Adsorption isotherm
c = co
Fig.6. A graphical illustration of capacity vs concentration. The adsorption isotherm, the operating line and incubation times
along the operating line are shown. The operating line (red) is given by the experimental setup (Vliq, Vmedium, co). The operating
line starts at c=co and ends at q defined by the isotherm. The slope of the operating line is equal to the negative of the phase ratio in the system, - = -Vliq/Vmedium.
The operating line starts at c = co (time 0) and has a slope that equals - . During the experiment, the capacity will increase along this line. For short incubations, the capacity obtained will be located far down on the operating line, while for very long incubations (where equilibrium is approached), the capacity will approach the capacity dictated by the isotherm. If the phase ratio is low (i.e., large volume of medium per well or small liquid volume), the potential capacity of the medium is not being explored, because the intercept between the operating line and the underlying isotherm is not in the plateau region of the isotherm. In simple terms, there is too much medium to reach the maximum capacity of the medium, qmax.
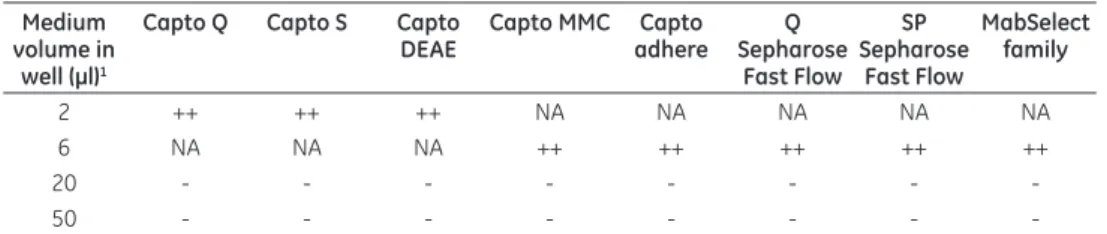
1) The type of study will determine the medium volume to use. 2) Use small volumes for capacity studies.
3) Use larger volumes for wash and elution studies.
Several different types of PreDictor plates have been developed for different applications. To select the relevant plate type, see Section 7.
2.7 Sample concentration and media volume
The underlying adsorption isotherm strongly influences the capacity of the medium. For capacity studies, operations should take place in the plateau region of the isotherm, that is, where capacity is relatively independent of the concentration of target protein in the liquid phase. Set up the system so that the final concentration in the liquid phase corresponds to the capacities in the plateau region (refer to the operating line in Fig 6). Once the favorable binding conditions
have been found, the isotherm is relatively rectangular; only at very low concentrations will the capacity be dramatically affected by the concentration.
For capacity experiments, ensure that an excess of target protein is added to the well so that the chromatography medium is overloaded (see the example in Section 2.9.1). For wash and elution studies, a somewhat larger medium volume in the wells is often
advantageous to ensure that sufficient amounts of protein and/or impurities for detection and analysis are obtained. When larger volumes are used, multiple loads can be required to reach the desired amount bound (see Section 4.3).
Understanding the effects of the phase ratio and the isotherm on capacity facilitates study planning.
2.8 Mixing
In batch experiments, agitation is essential. Without sufficient agitation, the rate-limiting mass transfer will be different in wells compared with a chromatography column. Many factors affect mixing efficiency, for example, well diameter, liquid volume, liquid viscosity/density, particle density, and orbital amplitude of the shaking table. Figure 7 illustrates the effects of liquid volume and agitation speed.
Use an agitation speed of 1100 rpm with a 3 mm circular centripetal movement and a liquid volume of 100 to 300 µl in the wells. Mix in all steps (equilibration, loading, wash, and elution)!
Volume too large. Mixing too slow
Mixing speed and volume optimized
Volume correct. Mixing too slow
A B C
Liquid volume
decreased Stirring speed increased
Fig.7. Schematic illustration of the effect of liquid volume and agitation speed on mixing efficiency. The situation before (red)
and during (blue) mixing is shown. A) Liquid volume too large, B) liquid volume and agitation speed optimized, C) agitation speed too low.
2.9 Types of studies
The examples below refer to studies performed in PreDictor plates.
2.9.1.Binding.studies.
Binding studies can be performed in single-medium plates, screening plates, or adsorption isotherm plates (see Section 7). With single-medium plates, 96 wells per plate are available for the experiment, while with screening plates, 24 or 32 wells are available per chromatography medium and plate. If isotherm plates are used, the response per condition is a whole isotherm and not just a capacity value. With isotherm plates, a maximum of 16 different conditions can be studied per plate.
Use low-volume plates (2 or 6 µl) for binding studies in single-medium plates or screening plates. Low media volumes are easier to saturate, that is, load to maximum capacity.
When planning the binding study, make sure to load enough protein. At termination of the incubation, the sample concentration should not decrease to less than 50% of the initial concentration. This ensures working in the plateau region of the adsorption isotherm and achieves the highest precision in analysis and calculations.
Decreasing to 80% of initial concentration is, however, acceptable when still working in the plateau region of the adsorption isotherm. Here, capacity is relatively independent of equilibrium concentration. By rearranging Equation 6, the excess of protein used in the experiment can be calculated:
c
q × V
100 g/l × 2 µl
___
= 1–
____
___
_
= 1–
___________ = 0.75
c
oV
liq× c
o200 µl × 4 g/l
medium
(15)
assuming a binding capacity of 100 g/l, feed concentration of 4 g/l, 200 µl of liquid volume, and 2 µl of chromatography medium.
Use an incubation time of 60 min. Shorter times may suffice if the uptake kinetics are fast. See the application example in Section 4.1.
2.9.2.Binding.studies.–.time-dependent.
In the batch system, the chromatography medium is incubated for different periods of time in the presence of the feed/sample (Fig 8).
End Start End Sample Sample Sample Flowthrough Elution Time Si m ul ta ne ou s se pa ra tio n of p ha se s an d su bs eq ue nt c on ce nt ra tio n m ea su re m en ts Wash/Equilibration Medium Vacuum filtration Waste
× Nconditions
1 2 3 4 5 6 7 8 9 10 11 12
A B C D E F G H A) B)
2.5 min 2.5 min 5 min 5 min 10 min 10 min 15 min 15 min 30 min 30 min 60 min 60 min 2.5 min 2.5 min 5 min 5 min 10 min 10 min 15 min 15 min 30 min 30 min 60 min 60 min 2.5 min 2.5 min 5 min 5 min 10 min 10 min 15 min 15 min 30 min 30 min 60 min 60 min 2.5 min 2.5 min 5 min 5 min 10 min 10 min 15 min 15 min 30 min 30 min 60 min 60 min 2.5 min 2.5 min 5 min 5 min 10 min 10 min 15 min 15 min 30 min 30 min 60 min 60 min 2.5 min 2.5 min 5 min 5 min 10 min 10 min 15 min 15 min 30 min 30 min 60 min 60 min 2.5 min 2.5 min 5 min 5 min 10 min 10 min 15 min 15 min 30 min 30 min 60 min 60 min 2.5 min 2.5 min 5 min 5 min 10 min 10 min 15 min 15 min 30 min 30 min 60 min 60 min
Fig.8. A) Outline of experimental protocol for the high-throughput batch uptake method with variable incubation time.
B) Example of a PreDictor 96-well plate layout that can be used. Four different conditions (indicated by green, yellow, orange, and blue shading) with six different incubation times (2.5, 5, 10, 15, 30, and 60 min) in quadruplicate are studied. Recommended incubation times (in minutes) are shown in each well.
Studying dynamic binding capacity (DBC) as a function of process conditions (pH, conductivity, residence time, feed concentration, etc.) is typically one of the first investigations of downstream development. The aim is to optimize conditions with respect to DBC and robustness, yet the work, when performed using columns, is laborious and requires a substantial amount of valuable sample.
PreDictor plates can be used for time-dependent studies and as outlined in Figure 8, the chromatography medium is incubated for different periods of time in the presence of the feed/ sample. Low-volume, single-medium plates (2 or 6 µl) work best (see Plate selection guide, Section 7.1). Using PreDictor plates to investigate time-dependent protein uptake on chromatography media (Fig 8A) allows prediction of DBC data as a function of residence time in a chromatography column. Studies can either be quantitative or qualitative, that is, enable relative ranking of rate of uptake.
Qualitative.study:.Using different incubation times in the batch uptake system (e.g., 5 and 60 min)
provides valuable information that can indicate the effect of residence time in a column, as schematically illustrated in Figure 9.
Binding capacity (solid phase),
q
Dynamic binding capacity (DBC
)
Incubation time
Residence time Long Short
Fig.9. Batch experiments (left), performed with a short and a long incubation time, give qualitative information on trends that
can be observed in column experiments (right).
Quantitative.study:.DBC versus residence time can be predicted based on data from a batch
system, using a combination of modeling and experimental approaches (1–5).
The rate of uptake of the target protein (and other components if desired) onto the chromatography medium is measured and subsequently described in a mathematical model. A similar model is then used to describe protein adsorption in a chromatography column and the DBC versus residence time relationship is simulated. The method is schematically illustrated in Figure 10. An application example that predicts the DBC of human IgG on MabSelect SuRe™ is described in Reference 6.
In addition to determining DBC data, the method can be used to study the effect of incubation time on the purity of the target protein by monitoring changes in contaminant concentration with time.
Binding capacity (solid phase),
q
Binding capacity (solid phase), DBC
Incubation time Residence time
Batch model parametersModel Column model
Batch
correlations correlationsColumn
Fig.10. Outline of data and information flow for a quantitative method for determining the effect of residence time on DBC.
The dashed line represents an optional method expansion. Batch experiments are shown on the left and the predicted DBC on the right.
2.9.3.Flowthrough.studies.(non-binding.mode).
Studies of chromatographic steps using flowthrough mode are performed where, instead of maximizing (or optimizing) the binding of the target protein, the focus is on maximizing contaminant binding while maintaining a high yield of the target protein in the flowthrough fraction.
2.9.4.Wash.and.elution.studies.
Wash and elution studies are performed to optimize the purity and/or yield of the target protein. When the effect of load can influence the results, use similar loads in the plate and in the column experiments.
Based on the specific application, the desired column load (in terms of percent of DBC) should be defined. In PreDictor plates (batch mode), this load is obtained from binding experiments in low-volume plates (2 or 6 µl). Note that the phase ratio changes when scaling up to recommended plate volumes of 20 µl (first choice) or 50 µl (second choice) for wash and elution studies. Multiple loadings may be required to obtain the desired load with 20 or 50 µl plates as the maximum volume per load is 300 µl. An example using multiple loads is shown in Section 4.3. For some studies, the load is not necessarily critical. Section 4.4 shows such an elution study example.
2.9.5.Cleaning-in-Place.(CIP).studies.
Traditionally, small-scale columns are used for CIP studies. However, such studies are labor intensive and time- and sample-consuming. In addition, small-scale columns are limited to evaluation of one CIP condition at a time. By using PreDictor plates, several cleaning protocols can be evaluated in parallel. Section 4.5 shows the development of a CIP protocol for a protein A affinity medium in PreDictor plates.
2.9.6.Adsorption.isotherm.studies.
Adsorption isotherms give information about binding strength (Kd) and potential binding capacity (qmax) under the conditions studied. With PreDictor plates, different approaches can be used to obtain adsorption isotherms. For example:
1) sample concentration is kept constant while the phase ratio is varied, 2) phase ratio is kept constant and the sample concentration is varied, and 3) combination of approaches 1 and 2.
The use of adsorption isotherm plates (Approach 1) simplifies the experimental protocol as no sample manipulation is necessary. The adsorption isotherm plates contain variable amounts of medium in the wells (Fig 11A). The same sample (same concentration and volume) is applied to all wells. Approach 2 uses single-volume plates and the initial concentration of sample is varied while the phase ratio is kept constant (Fig 11B). Thus, if single-volume plates are used, dilution of the sample is necessary in order to obtain different initial concentrations. For both approaches, varying the sample volume added to the wells is also possible. Note, however, that as the recommended Vsample is limited to between 100 and 300 µl, this technique must be used in combination with Approach 1 or 2 in order to cover the whole isotherm. An application example is given in Section 4.6.
Medium volume Sample conc.
A B C D E F G H A B C D E F G H
Binding capacity (solid phase),
q
Binding capacity (solid phase),
q
Conc. of target protein (liquid phase), c
Conc. of target protein (liquid phase), c
Medium volume Sample conc.
-β -β A B C D E F G H A B C D E F G H A) B)
Fig.11. Illustration of two methods to determine adsorption isotherms in a batch system. A) Constant initial concentration (co) and varying phase ratio ( ), B) Constant and varied initial concentration, co. Colored bars show variables and constants in
2.9.7.Chromatography.media.screening.
PreDictor plates can be used to compare different chromatography media. PreDictor anion exchange (AIEX) and cation exchange (CIEX) media screening plates are available (see PreDictor plate selection, Section 7). Each type of screening plate is available either in low-volume (2 µl/6 µl) or high-volume formats (20 µl). The workflow used is the same as with the single-medium plates, except that 24 or 32 wells are available for each medium instead of 96 (Fig 12).
1 2 3 4 5 6 7 8 9 10 11 12
A Capto™ Q 2 µl Capto DEAE 2 µl
Q Sepharose™ Fast Flow 6 µl Capto adhere 6 µl B C D E F G H A Capto Q 20 µl Capto DEAE 20 µl Capto adhere 20 µl B C D E F G H
1 2 3 4 5 6 7 8 9 10 11 12
Capto S
2 µl SP Sepharose Fast Flow 6 µl Capto MMC 6 µl
Capto S 20 µl
SP Sepharose
Fast Flow 20 µl Capto MMC 20 µl Q Sepharose
Fast Flow 20 µl
PreDictor AIEX media screening plates PreDictor CIEX media screening plates
Fig.12. Plate layout of PreDictor AIEX and CIEX media screening plates. Low-volume plates contain 2 µl of medium/well
(high-capacity Capto media) and 6 µl of medium/well (other media). High-volume plates contain 20 µl of medium/well for each of the media shown.
Note that a multimodal ion exchanger (Capto adhere and Capto MMC) is included in each type of plate. Because of their special properties (7, 8), Capto adhere and Capto MMC can have a different optimal operation window than traditional ion exchangers. Capto adhere, for example, has been shown to bind the target protein at pH values significantly below the isoelectric point (Fig 13). The optimal conductivity can also differ from that of traditional ion exchangers.
Net charge
pH
+
-Traditional anion exchanger
Net charge pH
+
-Capto adhere pI pIBinding pH Binding pH
Fig.13. Schematic illustration of a titration curve for a protein. Different binding pH should be expected on traditional ion
3. Practical considerations
Sample.prerequisite:.Samples should be clarified prior to application using normal-flow filtration
since unclarified samples can clog the wells.
Analytics:.The precision and sensitivity of the analytical method used can influence what can be
achieved with a given experimental setup.
Capacities can, for example, be calculated using flowthrough data or from elution data, as discussed in Section 2.3. If the amount bound is measured via the mass balance equation (Eq. 6), the analytical method must quantitate c = co – c. If the amount bound is measured from eluted fraction(s), the concentration in the eluate fractions must be quantifiable. A requirement for estimating capacity from eluted material is that close to 100% of the bound amount is eluted with the chosen elution conditions. For further discussion on the quality of data, see Section 5. The 96-well plate format allows a large number of conditions to be studied in parallel, which puts pressure on the analytical methods used and resources available. With this in mind, a sequential approach to the experimental setup can be considered. This can be a funnel approach, where the initial broad screening is performed on responses with rapid analytical methods. From this initial screening, conditions can be selected for responses that require more advanced (or laborious) analytical methods.
Incubation.time.vs.residence.time:.Incubation time (contact time) is not quantitatively
comparable to residence time in columns. Incubation time better corresponds to the total loading time in columns since this reflects the total time the medium particles are in contact with the sample. If long incubation times are used, the measured capacity better reflects the equilibrium capacity of the medium. For short incubation times, the rate of mass transfer will affect the measured capacity (Fig 5).
Pipetting,.buffer.preparation,.and.sample.preparation:.Buffer and sample preparation can
be relatively time-consuming with a manual workflow. If a robotic system is available, buffer preparation can be set up on the robot, thus simplifying this labor-intensive activity. Pipetting should be performed with multipipettes (8- or 12-tip) or by a robot. For practical transfer in a reasonable time, buffers and samples should be prepared in and dispensed from deep-well plates (4, 8, 12, 48 wells) according to the experimental plate layout.
Minimizing.leakage.from.the.plate.during.operation: To minimize risk of leakage through the
bottom filter, it is important to avoid direct contact between the PreDictor plate outlets (the drips on the bottom) and any surface. Repeated loadings and long incubation times using buffers or samples containing certain detergents can induce leakage through the filter. Recommendations for minimizing leakage when working with detergents are provided in the PreDictor plate Instructions (Instructions 28-9258-34).
Mixing.during.incubation:.Adequate mixing must be used during all incubation steps in order
to keep the chromatographic medium suspended in the liquid phase (see Section 2.8 and Reference 6).
UV.as.quantitation.method:.If UV absorbance is used to determine concentrations, ensure
that the calibration curve is linear and covers the range of concentrations to be measured; extrapolation is not recommended. Use standard procedures to compensate for potential light scattering effects, blank absorbance, and pathlength.
Transferring.experiments.from.low-.to.high-medium.volume.plates:.When transferring
different phase ratios obtained with the different plates containing different media volumes. Multiple loading will possibly have to be performed in order to reach the desired load (Fig 17).
Evaporation.and.sealant:.When longer incubation times are used (more than 60 min) as in, for
example, adsorption isotherm studies, consider sealing the plates to prevent evaporation. GE Healthcare microplate foils (96 well), code number BR-1005-78 can be used. These microplate foils are transparent, self-adhesive plastic films where the adhesive does not cover the well. (avoids contact between the sample and the adhesive).
Liquid.compatibility:.PreDictor plates and the chromatography media with which they
are prefilled are compatible with all solutions commonly used in the purification of biopharmaceuticals, see Instructions 28-9258-34 for details.
Plate.re-use:.PreDictor plates are disposable items. Repeated use can cause leakage as well as
4. Application examples
4.1 Screening binding conditions on Capto S using PreDictor plates
This application presents a binding study performed with a 60 min incubation. The binding capacity of Capto S for two proteins, conalbumin and α-chymotrypsin, was investigated at different ionic strengths and pH. The data obtained were compared to results obtained with column experiments (9).
Experimental:.PreDictor.plate.
Plate: PreDictor Capto S, 2 µl
Sample: 3.5 g/l conalbumin or α-chymotrypsin in each equilibration buffer
Equilibration/loading
buffers: Fifteen different buffers comprising 20 mM sodium acetate at three pH
levels (4.25, 4.75, 5.25) supplemented with sodium chloride to obtain the desired ionic strengths (0.02, 0.05, 0.08, 0.12, 0.15)
Steps:..
Equilibration 1–3: 200 µl equilibration buffer, 1 min incubation
Sample loading: 200 µl sample solution, 60 min incubation
Mixing was performed on an orbital shaker at 1100 rpm during all incubation steps. Liquids were removed by vacuum filtration.
The concentration of unbound protein was quantitated in the flowthrough from the loading step by reading UV absorbance. The amount bound was determined from the mass balance equation (Eq. 6). Experimental design and plate layout is shown in Figure 14.
Conalbumin α-Chymotrypsin
Fig.14. Plate layout for the experiment described in section 4.1. The 15 different conditions are shown in different colors.
Six wells (empty cells) were not used.
Experimental:.Column.chromatography.
Column: 2 ml of Capto S packed in a Tricorn™ 5/100 column
Sample: Approx. 4 g/l conalbumin or α-chymotrypsin in each equilibration buffer
Equilibration/loading
buffers: 15 different buffers. 20 mM sodium acetate at three pH levels (4.25, 4.75, 5.25) supplemented with sodium chloride to obtain the desired ionic strengths (0.02, 0.05, 0.08, 0.12, 0.15)
By recording the UV-signal during sample load the dynamic binding capacity at 10% breakthrough was calculated.
Results.and.discussion.
The two proteins behave differently with respect to ionic strength. α-Chymotrypsin behaves in a traditional manner with the highest capacity obtained at low conductivity (Fig 15A and C). Conalbumin, on the other hand, behaves in a non-traditional manner (Fig 15B and D) (9, 10, 11). The trends observed with PreDictor plates (Fig 15A and B) are essentially the same as those obtained in column experiments (Fig 15C and D). Binding capacities in plates obtained with a 60 min incubation correspond very well to dynamic binding capacities obtained in columns with a residence time of 2 min. This is because incubation time better corresponds to the total loading time in columns since it reflects the total time the media particles are in contact with the sample.
250
200 150 100 50
Binding capacity (mg/ml)
0
0 0.05 0.10 0.15 0.20 0.20
Ionic strength (M) pH 4.75 pH 5.25 pH 4.25 250 200 150 100 50
Dynamic binding capacity (mg/ml
)
0
0 0.05 0.10 0.15 0.20
Ionic strength (M) pH 4.75 pH 5.25 pH 4.25 180 140 160 100 120 60 80 20 40
Binding capacity (mg/ml)
0
0 0.05 0.10 0.15
Ionic strength (M) pH 4.75 pH 5.25 pH 4.25 160 140 120 100 40 20 60 80 0
0 0.05 0.10 0.15 0.20
pH 4.75 pH 5.25 pH 4.25
Dynamic binding capacity (mg/ml)
Ionic strength (M)
B) A)
D) C)
Fig.15. Determination of loading conditions for α-chymotrypsin and conalbumin on Capto S. Binding capacities of α-chymotrypsin A) and conalbumin B) after 60 min incubation in PreDictor Capto S, 2 µl plates. Dynamic binding capacities at 10% breakthrough for α-chymotrypsin C) and conalbumin D). The residence time was 2 min and the column was a Tricorn 5/100 (CV 2 ml).
4.2 Effect of incubation time, pH, and ionic strength on the binding of
amyloglucosidase to Capto DEAE
Taking a time-dependent study all the way from plate data to predicted dynamic binding capacity (DBC) values in a column is not always necessary. As shown below, valuable qualitative information can be obtained from an incubation time study without predicting DBC. An
incubation time of 60 min is generally recommended for capacity studies. Shorter and longer incubation times provide more data on how optimal conditions change over time.
Experimental:.PreDictor.plate.
Plate: PreDictor Capto DEAE, 2 µl
Sample: 4 g/l amyloglycosidase in each equilibration buffer
Equilibration/loading
buffers: 30 mM buffer, Tris pH 8 and 9, or bis-Tris pH 6 and 7, and 12 levels of total ionic strengths between 0.02 and 0.5 M at each pH. Sodium chloride was used to obtain the desired ionic strengths
Steps:..
Equilibration 1–3: 200 µl equilibration buffer, 1 min incubation
Sample loading: 150 µl sample solution at three different incubation times; 2 min, 60 min, or 20 h.
Mixing was performed on an orbital shaker at 1100 rpm during all incubation steps. Liquids were removed by vacuum filtration at -300 mbar for 5 s during all steps. The filtrate fraction from the loading was collected in a UV-readable multiwell plate and absorbance at 280 nm was read. The absorbance was used to calculate protein concentration by applying a standard curve prepared using protein stock solutions. Binding capacities were calculated from the mass balance equation (Eq. 6).
Results.and.discussion.
Contour maps describing the effects of ionic strength, pH, and incubation time on capacity were generated directly from raw data (i.e., no modeling or fitting was involved). The contour maps show how optimal conditions for capacity vary with incubation time.
In this study, the pH optimum (pH 7) was the same for all incubation times, but the optimal ionic strength varied from 0.07 at 2 min, through 0.04 at 60 min, to 0.02 at 20 h (Fig 16). This is an important result from a process development perspective as the shift in optimal conditions observed can be expected as an effect of column residence time. The maps shown in Figure 16, generated from SigmaPlot™ v8.0 software (Systat Software Inc.), are characteristic for ion exchange situations where changes in ionic strength and pH have opposite effects on intraparticle mass transfer rates and on equilibrium capacity. The reduced equilibrium capacity caused by an increase in ionic strength is balanced by improved intraparticle mass transfer resulting in a binding capacity maximum at intermediate ionic strength. The equilibrium capacity effect dominates at longer incubation times, shifting the maximum to lower ionic strengths. This type of non-traditional ion exchange behavior (9, 10, 11) can also be seen for conalbumin in Figure 15. For further details of this study, see Reference 6.
pH pH
6.5 7.0 7.5 8.0 8.5 6.5 7.0 7.5 8.0 8.5 pH
6.5 7.0 7.5 8.0 8.5 6.5 7.0 7.5 8.0 8.5 0.14 0.12 0.10 0.80 0.06 0.04 0.02 Io ni c st re ng th (m M )
6.5 7.0 7.5 8.0 8.5 6.5 7.0 7.5 8.0 8.5
A) B) C)
0 mg/ml 50 mg/ml 100 mg/ml 150 mg/ml 200 mg/ml 250 mg/ml
Fig.16. Contour maps showing the effect of ionic strength and pH on binding capacity of Capto DEAE for amyloglucosidase
over A) 2 min, B) 60 min, and C) 20 h. PreDictor plates filled with 2 µl of chromatography medium per well were used for the experiment.
4.3 Optimization of the wash step for MabSelect SuRe
The possibility of reducing host cell protein (HCP) levels in the elution pool from a protein A chromatographic step by introducing an intermediate wash step was investigated. The effect of 17 different intermediate wash buffers (variations in pH, NaCl concentration, and n-propanol concentration), as well as the effect on MAb yield was evaluated. The study was performed both in PreDictor plates and by column chromatography to check the correlation between the results obtained with the two formats.
Experimental:.PreDictor.plate.
Plate: PreDictor MabSelect SuRe, 50 µl
Sample: MAb feed with a MAb concentration of 1.3 g/l
Equilibration buffer: 20 mM sodium phosphate, 150 mM NaCl, pH 7.4
Intermediate wash
buffers: 17 different buffers (variations in pH, NaCl and n-propanol)
Elution buffer: 20 mM sodium citrate, pH 3.6
Steps:..
Equilibration 1–3: 300 µl equilibration buffer, 1 min incubation
Sample loading1: To reach a capacity of 23 g/l as used in the chromatography step described later, multiple loadings were needed; 3 × 300 µl of MAb feed was loaded each time and incubated for 20 min
Wash 1 and 2: 200 µl equilibration buffer, 1 min incubation
Wash 3 and 4: 200 µl intermediate wash buffer, 1 min incubation
Wash 5 and 6: As Wash 1 and 2, 1 min incubation
Elution 1–3: 200 µl elution buffer. The medium was incubated with elution buffer for 2 min before drainage. The three consecutive eluates were collected into three different UV-readable plates for analysis.
Liquid was removed by centrifugation and incubation was performed on a shaker (1100 rpm) in all steps.
1 Multiple.loadings:.As discussed above, the underlying isotherm and phase ratio control the capacity achieved. In this
application, an incubation time of 20 min was enough for the capacity to approach the isotherm capacity. Because of the relatively low phase ratio (6 = 300/50) and the relatively low feed concentration of the MAb, only about 1/3 of the desired load was reached by loading once. This was overcome by loading three times to reach a capacity or load of 23 g/l (Fig 17A). In this particular experiment, it would have been better to use a 20 µl PreDictor plate. If such a plate was used, the phase ratio would have increased from 6 to 15 (300/20) and the desired load (capacity) would have been attained in only one load (Fig 17B). Other options to reach the desired load are to change the phase ratio by using a different liquid phase volume (Vliq), and/or using a different initial concentration, Co .
23
Binding capacity (solid phase),
q
Binding capacity (solid phase),
q
0 0.5 1.0 1.5 2.0
Conc. of the target protein (liquid phase), c Conc. of the target protein (liquid phase), c 23
0 0.5 1.0 1.5 2.0
A) B)
Fig.17. Schematic illustration of how to reach the desired load of 23 g/l. Multiple loadings on a 50 µl PreDictor plate A) or a
single load on a 20 µl plate B). Circles represent the initial starting point (blue) and final point (purple) for each incubation. MAb concentration (UV absorbance) and HCP concentration (ELISA) were analyzed in the eluates.
Experimental:.Column.chromatography.
Column: HiTrap MabSelect SuRe, 1 ml
The steps employed are described in detail here:
Step Column..
volume.(CV) Flow.(cm/h) Description
Equilibration 10 250 20 mM sodium phosphate, 150 mM NaCl, pH 7.4. Sample load 18 63 23 g/l medium (18 ml 1.3 g/l clarified MAb feed).
2.4 min residence time
Wash 6 250 20 mM sodium phosphate, 150 mM NaCl, pH 7.4
Intermediate wash 2 250 Intermediate wash buffer
Wash 2 250 20 mM sodium phosphate, 150 mM NaCl, pH 7.4
Elution - 100 Fractionation with watch function based on UV levels (fractionation started at UV = 500 mAU and stopped at UV = 400 mAU)
Regeneration 4 250 100 mM sodium citrate, pH 3.0
CIP 10 100 0.5 M NaOH, 15 min contact time
Re-equilibration 10 250 20 mM sodium phosphate, 150 mM NaCl, pH 7.4 MAb concentration (UV absorbance) and HCP concentration (ELISA) were analyzed in the collected eluate.
Results.and.discussion.
Compared with the reference run using a standard wash in a column, none of the intermediate washes improved the wash procedure with respect to HCP levels in the eluate fractions (Fig 18). Four of the intermediate wash buffers (expts. 1, 2, 10, and 11 in Fig 18) even proved detrimental in the column experiments as HCP levels higher than the reference were obtained. The plate experiments gave the same results except with wash buffer 2, where a detrimental effect was not observed. With respect to yield, some of the intermediate washes (expts. 2, 7, 14, and 16 in Fig 18) proved detrimental, while for others, yield was in the same range as the reference runs. Correlation between the yields obtained with the two methods was good.
3000 2000 1000 6000 7000 8000 5000 4000 0
1 2 3 4 5 6 7 8 9 10 11 12 13 14 15 16 17 Ref.
H C P in e lu at e (p pm )
Intermediate wash buffer
50 40 30 20 10 80 90 100 70 60 0
1 2 3 4 5 6 7 8 9 10 11 12 13 14 15 16 17 Ref.
M Ab y ie ld in e lu at e (% )
Intermediate wash buffer
Plate Column Plate Column
Fig.18. Effect of different wash buffers on the host cell protein (HCP) levels and monoclonal antibody yield in the elution pool
from MabSelect SuRe. Results from plate experiments using PreDictor MabSelect SuRe, 50 µl (red) are compared with column experiments using HiTrap MabSelect SuRe, 1 ml (blue).
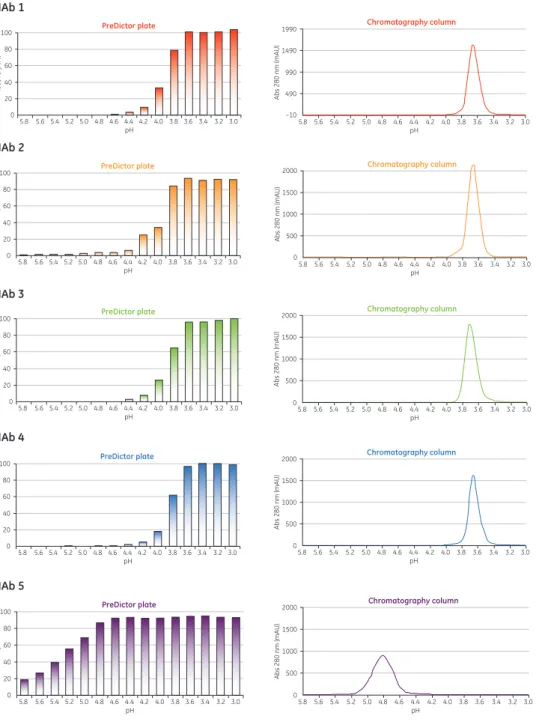
4.4 Screening elution pH on MabSelect SuRe
A PreDictor MabSelect SuRe 50 µl plate was used to screen elution pH for five monoclonal antibodies. A simulated pH gradient was set up in the plates and the yield at different pH was measured. Results obtained with PreDictor plates were compared with results obtained with pH gradient elution in a Tricorn 5/100 column packed with 2 ml of MabSelect SuRe.
Experimental:.PreDictor.plate.
Plate: PreDictor MabSelect SuRe, 50 µl
Equilibration buffer: 20 mM sodium phosphate, 150 M NaCl, pH 7.4
Final wash buffer: 20 mM sodium citrate, pH 6.0
Elution buffers: 20 mM sodium citrate, pH 5.8–3.0
Samples: 1.3 g/l of five different MAb’s, MAb no. 1, 3, 4, and 5 in equilbration buffer, MAb no. 2 in unpurified clarified NSO-cell supernatant
Steps:
Equilibration 1–3: 200 µl equilibration buffer, 1 min incubation
Sample loading: 300 µl MAb sample solution incubated for 20 min
Wash 1 and 2: 200 µl equilibration buffer, 1 min incubation
Wash 3: 200 µl final wash buffer, 1 min incubation
Elution 1–3: 200 µl of the different elution buffers, 1 min incubation
Liquid was removed by centrifugation and incubation was done on a shaker (1100 rpm) in all steps. The plate layout is shown in Figure 19. All fractions were collected in UV-readable plates and the concentration of MAb in the different fractions was determined from absorbance measurements at 280 nm.
5.8 5.6 5.4 5.2 5.0 4.8 4.6 4.4 4.4 4.2 4.0 3.8 3.6 3.4 3.2 3.0 Control/ No MAb
added MAb 1 MAb 2 MAb 3 MAb 4 MAb 5
5.8 5.6 5.4 5.2 5.0 4.8 4.6 4.4 4.4 4.2 4.0 3.8 3.6 3.4 3.2 3.0 5.8 5.6 5.4 5.2 5.0 4.8 4.6 4.4 4.4 4.2 4.0 3.8 3.6 3.4 3.2 3.0 5.8 5.6 5.4 5.2 5.0 4.8 4.6 4.4 4.4 4.2 4.0 3.8 3.6 3.4 3.2 3.0 5.8 5.6 5.4 5.2 5.0 4.8 4.6 4.4 4.4 4.2 4.0 3.8 3.6 3.4 3.2 3.0 5.8 5.6 5.4 5.2 5.0 4.8 4.6 4.4 4.4 4.2 4.0 3.8 3.6 3.4 3.2 3.0 pH
Fig.19. Plate design for the elution study using PreDictor MabSelect SuRe, 50 µl plate, a simulated pH gradient elution evaluation. Experimental:.Column.chromatography.
Column: 2 ml of MabSelect SuRe packed in Tricorn 5/100 column
Samples: 1.3 g/l of five different MAb’s, MAb nos. 1, 3, 4, and 5 in equilibration buffer, MAb no. 2 in unpurified clarified NSO-cell supernatant were loaded to 0.7 mg MAb/ml chromatography medium.
Equilibration/
loading buffer: 20 mM sodium phosphate, 150 mM NaCl, pH 7.4
Wash buffer 1: 20 mM sodium phosphate, 150 mM NaCl, pH 7.4
Wash buffer 2: 20 mM sodium citrate, pH 6.0
Elution buffer: A linear pH-gradient during 15 column volumes decreasing from pH 6 to 3 Absorbance at 280 nm was used for tracing elution.
Results.
Figure 20 shows the MAb recovery in the elution fractions from the PreDictor plates together with the corresponding chromatogram from the column experiment. Good correlation between the formats was obtained. Generic elution at pH 3.6 was shown with four of the five MAbs on both formats. The fifth MAb behaved differently. In the plates it started to elute as early as pH 5.8, although most of it eluted at pH 4.8. In the column, this MAb eluted in a broad peak at pH 4.8. For further details, see Reference 12.
100 80 60 40 20 0
5.8 5.6 5.4 5.2 5.0 4.8 4.6 4.4 4.2 4.0 3.8 3.6 3.4 3.2 3.0 pH
MAb 1
Recovery (%)
PreDictor plate
5.8 5.6 5.4 5.2 5.0 4.8 4.6 4.4 4.2 4.0 3.8 3.6 3.4 3.2 3.0 pH 1990 1490 990 490 –10
Abs 280 nm (mAU)
Chromatography column 100 80 60 40 20 0
5.8 5.6 5.4 5.2 5.0 4.8 4.6 4.4 4.2 4.0 3.8 3.6 3.4 3.2 3.0 pH
MAb 2
Recovery (%
)
PreDictor plate 2000
1500 1000 500 0
Abs 280 nm (mAU)
Chromatography column
5.8 5.6 5.4 5.2 5.0 4.8 4.6 4.4 4.2 4.0 3.8 3.6 3.4 3.2 3.0 pH 100 80 60 40 20 0
5.8 5.6 5.4 5.2 5.0 4.8 4.6 4.4 4.2 4.0 3.8 3.6 3.4 3.2 3.0 pH
MAb 3
Recovery (%)
PreDictor plate 2000
1500 1000 500 0
Abs 280 nm (mAU)
Chromatography column
5.8 5.6 5.4 5.2 5.0 4.8 4.6 4.4 4.2 4.0 3.8 3.6 3.4 3.2 3.0 pH 100 80 60 40 20 0
5.8 5.6 5.4 5.2 5.0 4.8 4.6 4.4 4.2 4.0 3.8 3.6 3.4 3.2 3.0 pH MAb 4 Recovery (% ) 2000 1500 1000 500 0
Abs 280 nm (mAU
)
PreDictor plate Chromatography column
5.8 5.6 5.4 5.2 5.0 4.8 4.6 4.4 4.2 4.0 3.8 3.6 3.4 3.2 3.0 pH 100 80 60 40 20 0
5.8 5.6 5.4 5.2 5.0 4.8 4.6 4.4 4.2 4.0 3.8 3.6 3.4 3.2 3.0 pH MAb 5 Recovery (% ) 2000 1500 1000 500 0
Abs 280 nm (mAU)
PreDictor plate Chromatography column
5.8 5.6 5.4 5.2 5.0 4.8 4.6 4.4 4.2 4.0 3.8 3.6 3.4 3.2 3.0 pH MAb 1 MAb 2 MAb 3 MAb 4 MAb 5
Fig.20. Comparison of elution patterns on MabSelect SuRe for PreDictor MabSelect SuRe, 50 µl relative to column chromatography
with 2 ml of the medium packed in a Tricorn 5/100 column. The bars in the histograms correspond to the cumulative relative amount of MAb recovered after elution at different pH for each MAb. The corresponding chromatograms are shown adjacent
Comments.
Note the low loads used in these experiments. In the column experiment, an analytical load (0.7 mg MAb/ml medium) was used. For simplicity, the same sample was used in the plate, which gave a load of 8 mg/ml medium. If load can affect the results, use the same load in the plates as in the column experiments. See Sections 2.6, 2.7, and 4.3 for discussion on choosing phase ratio and initial concentration in order to reach a desired load.
4.5 Rapid development of CIP protocols for affinity media
Commonly used protein-based affinity ligands such as protein A are very stable, which can allow several hundred monoclonal antibody purification cycles starting from mammalian cell culture. Critical to maximum media lifetime is the use of efficient and media-compatible cleaning-in-place (CIP) solutions. CIP protocols for MabSelect SuRe and MabSelect developed using PreDictor plates (13) are presented below. Note that even though CIP studies show good results, the plates should not be reused as repeated loading of protein can cause leakage.
Screening.cleaning.efficiency.
Fouling in a protein A column can only appear after several purification cycles. Therefore, artificial fouling of the medium in 96-well filter plates was performed in order to evaluate the cleaning efficiency of various CIP conditions in a high-throughput manner (Fig 21).
Medium
in well Equilibration1. Feed application2. Wash3. Fouling agent4. Wash5. Elution6. Equilibration7.
incubation incubation
Fig.21. Schematic description of artificial fouling of media. Media in all wells were mixed at every step and liquid was removed
by centrifugation between each step. Steps 1, 3, 5, and 7 show wash or equilibration with PBS, pH 7.4. Step 2 is E. coli lysate spiked with polyclonal human IgG (3 g/l) and added to MabSelect SuRe (PreDictor MabSelect SuRe, 50 µl medium/well). Incubation was 45 min. Step 4 shows the addition of fouling agent (2.9 M ammonium sulfate, 0.6 M phosphoric acid, pH 2.5). Incubation was overnight. Plates were covered with adhesive film to prevent evaporation. Step 6 shows sodium citrate, pH 3.0, which was applied to elute most of the bound protein.
Several potential CIP agents were evaluated for cleaning efficiency of the artificially fouled medium. The agents were added to the wells after step 7. Following a 15 min contact time, the cleaning solutions were removed and the wells washed several times with PBS and water. Medium samples were removed and boiled with SDS sample buffer for analysis by SDS-PAGE (Fig 22).
1. PBS (control) 2. 0.1 M NaOH
5. 0.1 M NaOH, 30% isopropanol 3. 0.2 M NaOH
4. 0.5 M NaOH
6. 0.1% commercial detergent 7. 0.1 M NaOH, 1 M NaCl
8. 0.1 M NaOH followed by 0.1 M citric acid 9. 0.1% commercial detergent followed by 0.1 M NaOH 10. Blank (control)
MabSelect SuRe, agarose-based protein A medium
1 2 3 4 5 6 7 8 9 10
Fig.22. Proteins remaining on the MabSelect SuRe medium after cleaning with different agents. SDS-PAGE (Deep Purple™
Screening.protein.A.media.stability.
Media stability was determined in a separate study by measuring functionality (i.e., IgG binding capacity) before and after exposure to cleaning chemicals.
Determination of IgG binding capacity
PreDictor 96-well filter plates: prefilled with MabSelect SuRe or MabSelect™ (6 µl medium/well) were used to determine IgG binding capacity. The binding capacity was determined by saturating the media with 200 µl of IgG at a concentration of 1.5 mg/ml. After incubating for 60 min on an orbital shaker (1100 rpm), unbound protein was collected and analyzed for IgG concentration. Binding buffer (PBS, pH 7.4) was used as wash and the bound protein was eluted with 0.1 M sodium citrate, pH 3.0. Static binding capacity was determined.
Effect of cleaning agents on chromatography media stability
PreDictor NaOH and n-propanol concentrations were varied between 0.01 and 1.09 M and 0% to 10%, respectively. The media were stored in the CIP solution for 18 h, which corresponds to 180 cycles with 30 min CIP/Sanitization-in-place (SIP) every fifth cycle. MODDE™ software (Umetrics, reference 14) was used for setting up the experiments and evaluating the results (Fig 23).
10 8 6 4 2 0
0.0 0.5 1.0
98
90 82 74 66 58 50
10 8 6 4 2 0
0.0 0.5 1.0
96 94 92 90 88 86
10 8 6 4 2 0
0.0 0.5 1.0
10 8 6 4 2 0
0.0 0.5 1.0
60 50 40 30 20 10 0 90 50 30 20 10 0 60 80 70 84 40
NaOH concentration (M)
n
-pr
opanol concentration (%)
MabSelect, 20°C MabSelect SuRe, 20°C
MabSelect, 40°C MabSelect SuRe, 40°C
70
Fig.23. Contour plots showing remaining IgG binding capacity (%) after exposure to CIP chemicals. PreDictor MabSelect SuRe
(alkali-stabilized protein A maintained IgG binding capacity at higher NaOH concentrations and elevated temperatures compared with PreDictor MabSelect (recombinant protein A).
Conclusions.
PreDictor 96-well filter plates filled with chromatography media enable parallel screening of CIP agents for cleaning efficiency and media compatibility studies. This approach allows a rapid design of suitable CIP protocols for different media and feed-stock combinations.
NaOH at concentrations from 0.1 to 0.5 M proved effective for cleaning agarose-based protein A media fouled with E. coli lysate.