Abstract—Polymer-solid adhesion belongs to a class of important industrial processes. We study the statistics of equally spaced pairs of receptors on a family of ordered flat microsubstrates whose adhesive centers form regular tessellations. We establish relationships between the symmetry of substrates and the probability density of the end-to-end polymer separation in terms of the so-called Manhattan distance. We also show how these functions change when the substrate is deformed.
Index Terms— distance distribution, polymer adhesion, micropatterned substrates.
I. INTRODUCTION
Adhesion of polymers to metal and ceramics surfaces is the subject of extensive theoretical and experimental studies. It is mainly due to such industrial applications as composite manufacturing, electronic packaging or production of demanding anti corrosive coatings. In this context the adherence using micropatterned nanosubstrates is an important engineering problem, with very diverse applications ranging from chemical processing to biological applications. Biopolymers play an important role in the exploration of complex-polymer-adhesion processes. Detailed knowledge of the attachment of biopolymers to different substrates is desirable to numerous biotechnologies, such as the fabrication of nanostructures for biomedical applications [1].
The polymer adhesion depends not only on chemical and physical factors. The structure of polymer-solid interfaces is modulated by the relative positions of substrate uptake centers and polymer sticker groups. Therefore, the geometric characteristics like surface topography and topology also come into the picture [2]. From the mathematical point of view a substrate receptor group can be represented by the nodes of an appropriate flat lattice. The geometrical properties of lattices still attract much attention, mainly due to progress in the fields of applied information theory, computer science, statistical physics, biology, and nanotechnology. It is interesting to note that the micropatterned substrates are built with the use of methods borrowed from the semiconductor industry [3,4]. Such methods generally employ the fabrication of highly ordered microscale structures [5,6]. A very recent and challenging advancement in this filed deals with protein-based programming of quantum nanostructures, as e.g. the
Manuscript received July 24, 2011. Zbigniew Domanski and Norbert Sczygiol are with the Czestochowa University of Technology, Dabrowskiego 69, PL-42201 Czestochowa, Poland. (corresponding author: Z..D; e-mail: [email protected]).
self-assembly of quantum dot complexes using nanocrystals capped with specific sequences of DNA [7].
The objective of this work is the theoretical analysis of the polymer adhesion in terms of polymer sticker groups and substrate receptor groups [8]. The problem we consider is the polymer chain trapped by the receptors placed within the nodes of an ordered lattice. In order to enhance the adhesion to the substrate our polymer is functionalized by addition of specified stickers to its ends [9]. In the proximity of the substrate’s surface the functionalized polymer feels an attractive, non-homogenous electrochemical potential generated by the receptors. In such circumstances the end points of the polymer do not move freely. They are forced to slide mainly between the nodes, and thus their trajectories resemble zigzag lines. We focus our analysis on the distribution of distances between the end points of the polymer trapped on the ordered surface depending on the surface’s symmetry. Because of the already mentioned zigzag-like-shaped trajectories we think that the Euclidean norm is not appropriate to measure the distance traveled by the sticker. Instead of the Euclidean norm the end-point-path lengths are measured in terms of the Manhattan distances.
II. THEORY AND METHODOLOGY
In this section, we present an approach we use to calculate, for a given finite substrate, the number of pairs of receptors that are separated by a prescribed distance.
A. Technological aspects
In the field of biotechnology micropatterned substrates serve as tools for the creation of novel biologically-inspired materials and for studying mechanisms of cell function [6,10-12]. The mechanical properties of the substrate to which polymers adhere mediate many aspects of polymer physicochemical function, as e.g. the DNA ability to take up different signaling molecules. Current efforts to understand the efficiency of adhesion are focused on the surface engineering aspects, whereas the influence of the substrate-receptor-group symmetry is less pronounced and sometimes ignored.
B. Substrate space geometry
Artificial substrate surface architectures employ the lattices which have edges and vertices formed by a regular tiling of a plane, so that all corners are equivalent. For instance in biomedicine, in the context of micropatterned substrates the so-called Archimedean lattices [13] are of special interest. This is because the patterns of extracellular matrix proteins of
Distributions of the End-to-End Distance of
Polymers Trapped onto Ordered Substrates
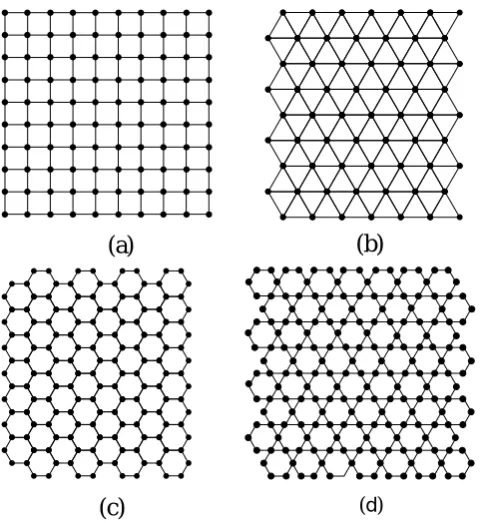
varying geometries modulate the organization of cells grown on the patterns. Three of the Archimedean lattices: triangular, square and hexagonal are drawn in a plane such a way that all faces are the same whereas the remaining 8 lattices need more than one type of a face. The former lattices belong to the regular tessellations of the plane and the latter ones are called semiregular lattices. Another important group of lattices contains dual lattices of the Archimedean ones. The given lattice G can be mapped onto its dual lattice DG in such a way that the center of every face of G is a vertex in DG, and two vertices in DG are adjacent only if the corresponding faces in G share an edge. The square lattice is self-dual, and the triangular and hexagonal lattices are mutual duals. The lattices are labeled according to the way they are drawn [13]. Starting from a given vertex, the consecutive faces are listed by the number of edges in the face, e.g. a square lattice is labeled as (4,4,4,4) or equivalently as (44). Consequently, the triangular and hexagonal lattices are (36) and (63), respectively. Other, frequently encountered lattice is (3,6,3,6) - called Kagomé lattice. In some ways these 4 lattices are representative to study polymer adhesion problems in two dimension. The regular lattices form pairs of mutually dual lattices and also share some local properties as e.g. the coordination number z being the number of edges with common vertex. One of the most interesting lattices in two dimension is the Kagomé lattice. Each its vertex touches a triangle, hexagon, triangle, and a hexagon. Moreover the vertices of this lattice correspond to the edges of the hexagonal lattice, which in turn is the dual of a triangular lattice. The Kagomélattice is also related to the square lattice, they have the same value, z=4, of the coordination number. The regular lattices and the Kagomé lattice are presented in Fig. 1.
Fig. 1. Two dimensional lattices used in this work. They are represented by tessellations with: (a) square, (b) triangular, (c) hexagonal, and (d) Kagomé symmetries. For all tessellations receptors are identified by the nodes. The edges form the shortest allowed paths between the pairs of receptors.
C. The Manhattan distance
Many questions lead to a problem of analysis of properties of random walk path and end-to-end distances distributions on regular networks [14,15]. Examples include, but are not limited to, material science or biology. For instance, in the field of computer science an important problem concerns the allocation of processors to parallel tasks in a grid of a large number of processors. This problem relays on the nontrivial correlation between the sum of the pair-wise distances between the processors allocated to a given task and the time required to complete the task [16].
The common question of the above mentioned problems is how many pairs of points separated by a given number q of steps can be found in a bounded region of a two-dimensional lattice. Such number q is referred to as the so-called Manhattan distance.
More specifically, because the distance should be measured in terms of process and its activities, therefore functional distance should take into account the symmetry of the underlying lattice. A distance measure that accounts for this symmetry can be constructed around the p−norm
(
)
1/1,..,
p p i
p =
∑
i= n xx . (1)
For p=2 we have the familiar Euclidean norm and for 1
p= we get the Manhattan norm also called the taxicab norm. Thus, for a square lattice, the Manhattan distance is defined as the sum of the horizontal and the vertical distances. Similarly, for a given lattice, we can define the Manhattan distance as the sum of the distances along directions parallel to the edges of the lattice.
This definition is equivalent to the definition of the distance between nodes in the graph that represents the lattice, i.e. the distance between two nodes u and v in a graph is the length of the shortest path from u to v.
D. Graph theory approach
Graphs are useful for representing networks. In this subsection, we briefly present some definitions and background on graph theory and method that we use to count the pairs of substrate’s nodes separated by a given value of the Manhattan distance. This question belongs to an ample class of the combinatorial properties of Archimedean lattices. It is efficient to study such properties by using tools provided by the graph theory. To do this we map an ordered micropatterned substrate onto finite, connected graph
(
,)
G V E whose vertices (nodes) vi=1,,n∈V represent receptors, n is the number of vertices in G. Two vertices are adjacent if they are connected by an edge in E. A walk is a sequence of vertices each of which is adjacent to the previous one. If all vertices are distinct the walk is called a path. The length of a path is the sum of the lengths of all component edges. Since our graph represents the Archimedean lattice then all its edges have the same length and, consequently, the path length is given by the number of visited edges.
An useful concept in the graph theory is the correspondence between graphs and so-called adjacency
(a)
(b)
matrices, sometimes called connectivity matrices. An adjacency matrix AG of G is the n n× matrix whose entries
( )
AG ij =1 if vi and vj are adjacent and zero otherwise. Adjacency matrix is very convenient to work with. For instance, let AGk =AG⋅ ⋅ AG be the k -times matrix product of AG, then( )
Gkij
A is the number of walks of the length k from vi to vj in G.
Our approach consists of two steps: (i) with the help of the family of matrices AkG, each pair of nodes is assigned the smallest value of k so that the corresponding entry of AkG is nonzero. (ii) for each value of k we count the number of pair of nodes related to this value. Since the graph is finite, this approach yields a partition of Manhattan distances.
III. RESULTS
We present the detailed calculations of distance distributions for three regular tessellations and for the Kagomélattice.
A. Square lattice
First we analyze the square lattice of receptors with the lattice constant a≡1. Without loss of generality, let us assume that the substrate has the shape of a square whose side contains L nodes. Thus, the maximum value of the end-to-end distance qmax =2(L−1)corresponds to two pairs of receptors located in the opposite corners of the substrate. On the other hand qmin =1 is related to the number of pairs of nodes connected by edges of the substrate. Each of the L rows and columns contain L−1 edges and this means that there are 2L L
(
−1)
such distances. Following the approach described in section II.D we obtain an expression that describes the number N L q(
,)
of distances q within the square-shaped substrate(
)
(
)
(
)
(
)
(
)
2
2 1
2 1 , ,
3 ,
1
2 1 2 , 2( 1).
3
Lq L q q q q L
N L q
L q L q L q L
− + − ≤
=
− − − < ≤ −
(1)
In Fig. (2) we show N L q
(
,)
for different values of L. Equation (1) can be written in the form of the probability distribution function of distance with the help of the normalization condition, namely(
)
(
)
(
)
2 2
2
, ,
1
P L q N L q
L L
=
− . (2)
[image:3.595.321.531.48.249.2]Probability distribution function (2) is useful for small substrates. When L grows significantly an appropriate description is based on the concept of probability density function. Probability density function can be introduced as follows.
Fig. 2. Distribution (1) of the receptor-receptor distance for the square lattice related to two values of substrate’s length L. The line are drawn using (1) and they are only visual guides.
Let a≡ → =1 a 1 /L , thus all distances are scaled by the factor 1 /L . Due to this scaling (2) is replaced by the probability distribution function for the discrete set of distances xq =q L/ in the unit square with the step 1 /L, i.e.
( )
(
)
(
)
(
) (
)
1/
3 2
3 2
2
3 1 /
6 1 / , 1,
2 2 / , 1 2 2 /
L q
q q q q q
q q q
P x
L L
x x x x L x
x x L x L
= ×
−
− + − ≤
− − − < ≤ −
(3)
Keeping only terms of the order 1 /L in (3) we approximate
( )
1/L qP x by g x
( )
q dxq, with dxq =1 /L. In the limit of L→ ∞ , g becomes the probability density function of Manhattan distance inside the unit square( )
(
)
(
)
3 3
2
4 1 , 1,
3 2
2 , 1 2.
3
x x x x
g x
x x
− + ≤
=
− < ≤
(4)
Function (4) is presented in Fig. (4).
B. Deformed square lattice
Fig. 3. Deformation of the square reduces the diagonals marked by dashed line.
Below we present formulas obtained for heavily distorted substrate, i.e. under shear stress generating an effective triangular symmetry among the node’s positions. The number of distances (1) takes the following form
(
)
(
)(
)
(
)
(
)
(
)
(
)
2
2 ,
1
3 1 , ,
6 1
2 1 2 , 2 1 .
6
N L q
q L q L q q q q L
L q L q L q L
=
− − + − ≤
− − − < ≤ −
(5)
The corresponding probability density function of distance (3) now is given by
( )
(
)(
)
(
)
3 3
1
2 1 3 , 1,
6 1
2 , 1 2.
6
x x x x x
g x
x x
− − + ≤
=
− < ≤
(6)
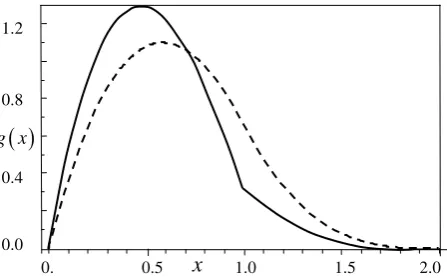
The probability density functions (3) and (6) are shown in Fig. 4.
Fig. 4. Probability density of distances (4) within the square-shaped substrate (dashed curve) compared to that one (6) for the same set of receptors but within the deformed substrate (solid curve).
C. Triangular lattice
Discussed above, highly deformed square-shaped substrate possesses triangular lattice of receptor locations. Here and in the following subsections we analyze the triangle-shaped substrates. Such shape is rather artificial. Nevertheless, it is worth analyzing it because the triangular, the hexagonal and the Kagomé lattices are built around the same set of nodes, see Fig. 5, and this will enable us to directly compare the results. Our approach applied to the graph represented in Fig. 5(a) yields the distance distribution in the form
(
)
3(
)(
)
, 1 , 1, 2 , 1.
2
N L q = q L−q L− +q q= L− (7)
Thus, the corresponding probability distribution of distances
(
,)
P L q and probability density g x
( )
are as follows(
)
(
)
(
)
(
)
2
12
, ,
1 2
P L q N L q
L L L
=
− + , (8)
( )
(
)
218 1
g x = x −x . (9)
[image:4.595.64.288.470.609.2]The lattice size L≥2 is shown in Fig. 5(c).
Fig. 5. Finite triangular lattice (a) viewed as an undirected graph. Subgraphs of this graph represent the hexagonal lattice (b) and the Kagomé lattice (c). In part (b) it is seen how the hexagonal lattice emerges from the triangular one. The lattice size L is shown in (c).
D. Hexagonal lattice
The hexagonal lattice, see Fig. 5(b), viewed as a graph, possess fewer nodes and edges than the graph of the underlying triangular lattice presented in Fig. 5(a). Thus, within the same support, all functions representing the hexagonal symmetry take smaller values than these related to the triangular symmetry. The functions appropriate to the hexagonal symmetry read
(
)
(
)
( ) ( )
3
, 2 4 3
8
1 1
3
4 , 1, , 1.
8 2
q
N L q Lq L q
q q q q L
= − + −
− −
+ + − = −
(10)
(
)
(
)(
)
(
2)
(
)
32
, , ,
2 6 4 8
P L q N L q
L L L L
=
− + + − (11)
( )
3(
)
21 8
g x = x −x (12)
0. 0.5 1.5 2.0
0.0 0.4 0.8 1.2
( )
g x
1.0
(a) (b)
(c)
L: 1 2
3
4 5
6 7
8 9
10
[image:4.595.311.549.638.773.2]The lattice size L≥4 is shown in Fig. 5(c).
E. Kagomé lattice
Arguments, similar to these stated in the case of the hexagonal symmetry, make the relevant functions defined as follows
(
)
(
)(
)(
)
(
) (
)
(
)
2
,
3
, 1,
4 3
5 2 2 , 2, , 2,
16 3
1 2 1 3 2 1 , 3, , 1.
8 N L q
L q
q L q L q q L
L q q L q q q L
=
=
− − − + = −
+ − + + − − = −
(13) and
(
)
(
)
(
2)
(
)
128
, , .
3 2 3 6 8
P L q N L q
L L L L
=
+ + − (14)
The lattice size L≥2 is shown in Fig. 5(c).
IV. SUMMARY
As micropatterned substrates play an increasing role in the understanding of basic cell biology, there is an increasing need to understand the interplay between substrate geometry and surface chemistry. In this paper we have studied a minimalist model of an earlier stage of a polymer adhesion to flat ordered substrate. In different context, some of the above mentioned results, concerning the square and the triangular symmetries, have been obtained elsewhere [17]. Our results could serve as an initial class of probability density functions of the end-to-end distance.
REFERENCES
[1] See, e.g. Intelligent Substrate Inc., “Micropatterned substrates: Highlights from the literature”, Available:
www.intelligentsubstrates.com/Applications/Highlights/Highlights.ht ml.
[2] A.J. Crosby, M. Hageman, and A. Duncan, “Controlling Polymer Adhesion with ‘Pancakes’”, Langmuir, 2005, vol. 21, pp. 11738-11743.
[3] I. Lee, H. Zheng, M.F. Rubner, and P.T. Hammond, “Controlled Cluster Size in Patterned Particle Arrays via Directed Adsorption on Confined Surfaces”, Advanced Materials, 2002, vol. 14, no. 8, pp. 572-577.
[4] H. Zheng, I. Lee, M.F. Rubner, and P.T. Hammond, “Two Component Particle Arrays on Patterned Polyelectrolyte Multilayer Template”, Advanced Materials, 2002, vol. 14, no. 8, pp. 569-572.
[5] A. Azioune, N. Capri, Q. Tseng, M. Théry, and M. Piel, “Protein Micropatterns: A Direct Protocol Using Deep UVs”, Methods in Cell Biology, 2010, vol. 97, pp. 133-146.
[6] H. Otsuka, “Nanofabrication of Nonfouling Surfaces for Micropatterning of Cell and Microtissue”, Molecules, 2010, vol. 15, pp. 5525-5546. Available: www.mdpi.com/1420-3049/15/8/5525/pdf. [7] G. Tikhomirov, S. Hoogland, P.E.Lee, A. Fisher, E.H. Sargent, and S.O. Kelly, “DNA-based programming of quantum dot valency, self-assembly and luminescence”, Nature Nanotechnology, 2011, advance online publication, doi:10.1038/nnano.2011.100.
[8] I. Lee, R.P. Wool, “Polymer Adhesion vs. Substrate Receptor Group”, Macromolecules, 2000, vol. 33, pp. 2680-2687.
[9] N. Rana, CH. Kossow, E.T. Eisenbraun, R.E. Greer, and A.E. Koloyeros, “Controlling Interfacial Adhesion of Self-Assembled Polypeptide Fibrils for Novel Nanoelectromechanical Systems (NEMS) Applications”, Micromachines, 2011, vol. 2, pp. 1-16. Available: www.mdpi.com/2072-666X/2/1/1/pdf.
[10] S. Raghavan, Ch. S. Chen, “Micropatterned Environments in Cell Biology”, Advanced Materials, 2004, Vol. 16, No. 15, pp. 1303-1313. [11] R. Amin, S. Hwang, and S. H. Park, “Nanobiotechnology: An
Interaction Between Nanontechnology and Biotechnology”, Nano, 2011, vol. 6, no. 2, pp. 101-111. DOI: 10.1142/S1793292011002548. [12] A. K. Pannier, B. C. Anderson, and L. D. Shea, “Substrate-mediate delivery from self-assembled monolayers: Effect of surface ionization, hydrophilicity, and patterning”, Acta Biomater., 2005, Vol. 1(5), pp. 511-522. DOI: 10.1016/j.actbio.2005.05.004.
[13] B. Grünbaum, G. Shepard, “Tilings and Patterns”, New York, W. H. Freeman, 1986.
[14] E. J. Janse van Rensburg, “Statistical mechanics of directed models of polymer in the square lattice”, Journal of Phys. A: Math. Gen., 2003, vol. 36(15), pp. R11-R61.
[15] C. M. Bender, M. A. Bender, E. D. Demaine, and S. P. Fekete, „What is the optimal shape of a city?“, Journal of Phys. A: Math. Gen., 2004, vol. 37(1), pp. 147-159.
[16] V. J. Leung, et. all, “Processor allocation on Cplant : Achieving general processor lacality using one-dimensional allocation strategies”, Proceedings of the 4th IEEE Int. Conference on Cluster Computing, Willey-Computer Society Press, Chicago, 2002, pp. 296-304. [17] Z. Domański, “Geometry-Induced Transport Properties of Two