Fabrication and Testing of E-Glass Fiber
Reinforced Composite for Different Fiber
Orientation
Aniruddh Pratap1, R. Rajashekar2 1P.G Student, Department of Mechanical engineering, U.V.C.E, Bengaluru, India 1 2
Assistant Professor, Department of Mechanical engineering, U.V.C.E, Bengaluru, India 2
Abstract: Fiber reinforced polymer (FRP) composites are being extensively used in structural and non-structural applications of Mechanical Engineering. The types of reinforcement, its geometry, volume fraction, orientation of fibers, etc. are some of the parameters that affect the properties of the FRP composites. In this work an attempt has been made to fabricate FRP composites to study the effect of orientation of E-glass fibers fabric in epoxy resin for maximum tensile, flexural and impact properties. Glass fiber reinforced polymer (GFRP) laminated plates were fabricated using vacuum bag moulding technique, while maintaining the fiber volume fraction approximately to 0.6. Four different types of laminated plates were fabricated with following fiber orientation: [0°/-45°/+30°/-30°/+45°/0°], [0°/0°/+30°/-30°/0°/0°], [0°/-45°/0°/0°/+45°/0°], and [0°]6 along with
fifth type which have no fibers in it. Specimens cut from the above plates are tested according to ASTM standards. The specimens with more number of fiber fabric layers orientated along the loading direction (0°) shows increase in tensile strength and absorption of impact energy. The specimens having 30° fiber fabric orientation showed better flexural strength compared to that of specimens without 30° fiber fabric orientation.
Keywords: Fiber orientation, Fiber volume fraction, GFRP, Tensile properties, Flexural properties, Impact properties.
I. INTRODUCTION
Composite material or composite is the combination of two or more materials of different chemical and physical properties on the microscopic or macroscopic scale to form a useful third material. It is the combination of two materials, reinforcement phase in the form of particles, fibers or sheets and matrix phase in the form of polymer, metal or ceramic. Matrix phase transfer stresses between fibers, protect fibers and provide barrier to environment.
Composite materials are been extensively used in many different area of application of engineering. This is due to enhanced properties of composite material when compared to the properties of individual component materials of composite. Metal matrix composite, ceramic matrix composite and polymer matrix composite are three main classifications of the composites.
Fiber reinforced polymer (FRP) composites are being extensively used in structural and non-structural applications of mechanical engineering. This is due to the fact that FRP composites are processing high strength to weight ratio, durability, stiffness, wear resistance, corrosion resistance, etc. The reinforcement material of FRP composite plays a very important role in detecting the properties of the composite. The type of reinforcement, its geometry, volume fraction, fiber, filler material, orientation of reinforcement, thickness of the specimens, etc. are some of the parameters that affect the properties of the FRP composite.
Many researches have been done on FRP composites. Mr. Mahesh Chandrashekhar Swamy et al. Investigated the flexural properties of E-glass fiber (Unidirectional, Bidirectional woven and 2D (0°-90°) type) epoxy composite with 2mm, 4mm and 6mm thickness experimentally. They found that, Flexural strength increases as thickness increases and the composite with unidirectional fiber reinforced showed more flexural strength compared to other types [4]. Mr. Sagar S Chavan et al. investigated the tensile and flexural properties of jute fiber reinforced epoxy composite with different fiber orientations as [90°/0°/90°]S, [+45°/0°/-45°]S and
[+60°/0°/-60°]S. They found that [90°/0°/90°]S and [+60°/0°/-60°]S type showed maximum tensile and flexural strength in longitudinal
direction respectively, with [+45°/0°/-45°]S type showed minimum tensile and flexural strength in transverse direction [5]. Mr.
with increase in percentage of graphene powder (1%, 3% and 5%) in laminate for bi-woven E-glass fiber cloth reinforced epoxy composite was investigated by Dr. R Jyothilakshmi et al. [8]. Mr. Keerthi Gowda B S et al. investigated the impact properties of treated and untreated Sisal fiber reinforced polyester composite with different fiber volume fraction (10%, 15%, 20%, 25% and 30%) and with different thickness (2mm, 3mm, 4mm, 5mm and 6mm). They found that impact strength increases with increase in thickness and fiber volume fraction. Untreated sisal fiber polyester composite showed highest compared to treated sisal fiber polyester composite [2]. S. Eksi et al. investigated the mechanical properties of Carbon, E-glass and Aramid fibers (unidirectional and woven type) reinforced epoxy composite. They found that the mechanical properties of 0°-oriented was better than the 90°-oriented unidirectional fiber reinforced composite [9]-[3] and woven aramid fiber reinforced composite showed better mechanical properties compared to the other woven fiber reinforced composite [3]. Patil Deogonda et al. investigated the mechanical properties
of GFRP with varying percentage (0%, 1%, 2% and 3%) of TiO2 and ZnS powder as filler material and with different thickness for
tensile, bending and impact test as 4mm, 6mm and 10mm respectively. The results from test showed that the Tensile, Bending and Impact strength increases with addition of filler material and ZnS filled composite shows significantly good results than TiO2 filled composites [1].
II. EXPERIMENTAL STUDIES A. Materials used
In this work unidirectional stitched E-glass fiber fabric cloth of 220 GSM and 0.2 mm thickness was used as the reinforcement material and Epoxy L-12 and Hardener K-6 in the ratio of (10:1) was used as the matrix material.
B. Specimen preparation
Vacuum bag moulding technique was employed to fabricate the composite laminate plates of 300mm × 300mm × 2mm. Fiber volume fraction was maintained approximately 0.6 while fabricating the composite material. Four laminates with six layers of E-glass fiber fabric with different stacking sequence as [0°/-45°/+30°/-30°/+45°/0°], [0°/0°/+30°/-30°/0°/0°], [0°/-45°/0°/0°/+45°/0°] and [0°]6 were prepared. Separately an epoxy resin plate was prepared without fibers in it.
[image:2.612.123.492.458.631.2]Three types of specimens/coupons were cut out from the each laminated plates, using Diamond cutter tool. Total twelve specimens were cut for each tensile test and bending test with dimensions, 250mm × 25mm according to ASTM D3039 and 130mm × 20mm according to ASTM D790 respectively. For Izod impact test sixteen specimens were cut with dimensions, 65mm × 12.5mm according to ASTM D256. Separately two tensile, two bending and three impact test specimens were cut out from the epoxy plate. Fig. 1 shows the tensile, bending and impact specimens used.
Fig. 1 Test specimens
C. Tensile test
Fig. 2 Drawing of Tensile test specimen Fig. 3 Tensile specimen with fixture
1) Formula Used: To find the mechanical properties of tensile test specimens following formulas are used:
a) Stress, = N/mm2
b) Strain, ɛ= mm/mm
c) Ultimate tensile strength, = N/mm2
d) Young’s Modulus, =
ɛ N/mm
2
(From the slope of the stress - strain graph)
e) Percentage of Elongation = × 100 %
Where,
‘P’ is the load applied across the specimen (N), ‘L’ is the original length of the specimen (mm),
‘A’ is the cross-section of the specimen (mm2), ‘Lf’ is the final length of the specimen (mm),
‘δ’ is the change in length (mm), ‘Pmax’is the maximum load before the specimen fractures (N).
D. Three point bending test
For three point bend test twelve specimens were used with varying fiber orientation and two with no fibers in it. The overall length of the bending specimen was maintained at 130 mm and width of 20 mm with thickness of 2 mm as show in Fig. 4. To determine the flexural strength the three points bending test was carried out on the Electronic Tensometer as show in Fig. 6. Bending test was conducted as per ASTM D790 norms with central loading rate of 5mm/min as shown in Fig. 5.
Fig. 4 Drawing of bending test specimen Fig. 5 Bending specimen with fixture
2) Formula Used: To find the mechanical properties of bending test specimens following formulas are used:
a) Flexural strength, = N/mm2
b) Flexural Modulus, = N/mm2
Where,
‘Pmax’is the maximum load before the specimen fractures (N), ‘d’ is the depth/thickness of the specimen (mm),
‘L’ is the span length (mm), ‘m’ is the slope of the load - deflection graph.
‘b’ is the width of the specimen (mm),
E. Izod impact test
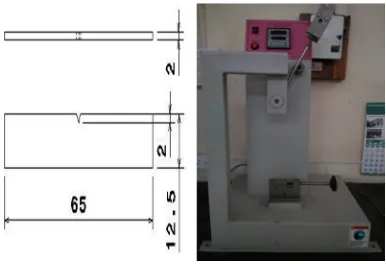
Izod impact test was used to test the impact strength of specimens which is commonly accepted. To determine the impact strength the Izod impact test was carried out. For impact test sixteen specimens were used with varying fiber orientation and three with no fibers in it, with dimensions of 65mm × 12.5 mm × 2mm as shown in Fig. 7.
Fig. 7 Drawing of bending test specimen Fig. 8 Digital Impact test machine
A V- groove (notch) of depth 2mm is provided on the specimens as shown in Fig. 7. Test was carried out on the digital impact testing machine as show in Fig. 8. Impact test was conducted as per ASTM D256 norms.
F. Formula Used
To find the mechanical properties of Izod impact test specimens following formulas are used:
a) Impact strength, = J/mm2
Where,
‘U’is the impact energy absorbed by the specimen before fracture (J) and ‘A’ is the cross-section area at the notch (mm2).
III. RESULTS AND DISCUSSION
[image:4.612.117.503.254.518.2]A. Tensile Test
[image:5.612.104.514.137.397.2]The tensile test was carried out on specimens as per ASTM D3039 standards and results are tabulated in TABLE I.
TABLE II
Tensile Test Results For Gfrp Specimens Specime n Type Specimen number Maximum Deformatio n (mm) Maximu m load (N) Ultimate Tensile strength (N/mm2)
Percentag e of elongation (%) Average Ultimate Tensile strength (N/mm2)
Average Young’s Modulus (GPa)
O TO1 5.592 1755.50 35.110 3.99 34.26 0.727
TO2 5.694 1670.90 33.420 4.06
A
TA1 11.753 8698.80 173.976 8.40
178.941 2.398
TA2 13.552 8923.70 178.474 9.68
TA3 11.074 9218.60 184.372 7.91
B
TB1 12.512 9963.90 199.278 8.68
223.861 2.492
TB2 9.997 10317.0 206.340 7.14
TB3 12.737 13298.3 265.966 9.10
C
TC1 14.333 11503.6 230.072 10.24
228.05 2.568
TC2 13.289 11700.4 234.008 9.49
TC3 12.992 11003.5 220.070 9.28
D
TD1 12.771 11101.5 222.030 9.12
237.263 2.707
TD2 13.798 11542.8 230.856 9.86
TD3 15.809 12945.2 258.904 11.29
It is clear from the test that the fracture of GFRP composite specimens was purely due to the fiber rupture, transverse crack and delamination of the fibers. Delamination of the fiber layers occurred due to poor inter-laminar resistant. The result shows that as the number of fiber fabric layers with 0° fiber orientation increases in the specimens the Ultimate tensile strength and Young’s modulus increases. The GFRP composite specimens with [0°]6 type can resists more tensile load compared to other types. Therefore the
specimens with [0°]6 type exhibited maximum Ultimate tensile strength and Young’s modulus. The average Young’s modulus of the
[image:5.612.69.550.489.710.2]fabricated composite are summarized in the bar graph for better comparison as shown in Fig. 10.
Fig. 9 Stress v/s Strain graph for tensile test specimens Fig. 10 Bar chart of Average Young’s modulus for tensile
test specimens 0 50 100 150 200 250
0 0.05 0.1 0.15
S tr e ss (N /m m 2) Strain (mm/mm) Stress v/s Strain graph
O
A
B
C
D O, 0.727
A, 2.398
B, 2.492 C, 2.568 D, 2.707
0 0.5 1 1.5 2 2.5 3 M o d u lu s o f E las ti ci ty ( G P a)
Stress v/s Strain graph has been plotted for different types of specimens as shown in Fig. 9. It was seen that GFRP composite specimens with fiber orientation as [0°]6 showed highest tensile strength and Young’s modulus as 237.263MPa and 2.707 GPa
respectively. The GFRP composite specimens with fiber orientation as [0°/-45°/+30°/-30°/+45°/0°] showed lowest tensile strength and Young’s modulus as 178.931MPa and 2.398GPa respectively.
B. Three Point Bending Test
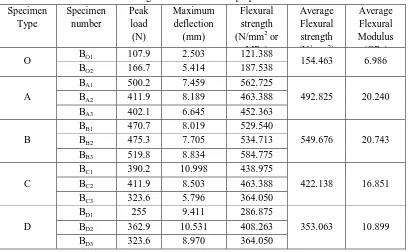
[image:6.612.104.512.199.451.2]The three point bending test was carried out on specimens as per ASTM D790 standards and results are tabulated in TABLE IIII.
TABLE II
Bending Test Results For Gfrp Specimens Specimen Type Specimen number Peak load (N) Maximum deflection (mm) Flexural strength (N/mm2 or
MPa)
Average Flexural strength (N/mm2)
Average Flexural Modulus (GPa)
O BO1 107.9 2.503 121.388 154.463 6.986
BO2 166.7 5.414 187.538
A
BA1 500.2 7.459 562.725
492.825 20.240
BA2 411.9 8.189 463.388
BA3 402.1 6.645 452.363
B
BB1 470.7 8.019 529.540
549.676 20.743
BB2 475.3 7.705 534.713
BB3 519.8 8.834 584.775
C
BC1 390.2 10.998 438.975
422.138 16.851
BC2 411.9 8.503 463.388
BC3 323.6 5.796 364.050
D
BD1 255 9.411 286.875
353.063 10.899
BD2 362.9 10.531 408.263
BD3 323.6 8.970 364.050
This data is often used to select materials for parts that will support loads without flexing. In bending the materials experiences both tensile and compression loading. The specimens with [0°/0°/+30°/-30°/0°/0°] type showed maximum Flexural strength and Flexural modulus. The specimens having 30° fiber fabric orientation showed better flexural strength compared to that of specimens without 30° fiber fabric orientation. This may be due to the fiber fabric layer of 30° orientation offer resistance to combined loading caused due to bending. Therefore GFRP composites specimens which contains 30°- oriented fibers can resists more bending load compared to other types. The average flexural modulus of the fabricated composite are summarized in the bar graph for better comparison as shown in Fig. 12.
Fig. 11 Load v/s Deflection graph for bending test specimens Fig. 12 Bar chart of Average Flexural modulus for bending
test specimens 0 100 200 300 400 500 600
0 5 10 15
Lo
ad
(N
)
Deflection (mm) Load V/S Deflection Graph
O A B C D O, 6.986
A, 20.24 B, 20.73 C, 16.85 D, 10.89 0 5 10 15 20 25 F le x u r al m o d u lu s (G P a)
[image:6.612.70.542.556.705.2]Load v/s Deflection graph has been plotted for different types of specimens as shown in Fig. 11. It was seen that GFRP composite specimens with fiber orientation as [0°/0°/+30°/-30°/0°/0°] showed highest flexural strength and flexural modulus as 549.676MPa and 20.743GPa respectively. The GFRP composite specimens with fiber orientation as [0°]6 showed lowest flexural strength and
flexural modulus as 353.063MPa and 10.899GPa respectively.
C. Izod Impact Test
[image:7.612.152.463.188.474.2]The Izod impact test was carried out on specimens as per ASTM D256 standards and results are tabulated in TABLE IVII.
TABLE III Impact Test Results For Gfrp Specimens
Specimen Type Specimen number Impact energy (J) Average Impact energy (J) Average Impact strength (J/ mm2)
O
IO1 2.00
2.0667 0.0984
IO2 2.00
IO3 2.20
A
IA1 4.00
4.7850 0.2279
IA2 4.00
IA3 4.00
IA4 7.14
B
IB1 7.47
7.6875 0.3661
IB2 7.17
IB3 8.14
IB4 7.97
C
IC1 8.01
8.3975 0.3999
IC2 8.47
IC3 8.27
IC4 8.84
D
ID1 10.17
10.4450 0.4974
ID2 10.00
ID3 10.57
ID4 11.04
Impact test is where in which rapid propagation of cracks without any excessive plastic deformation at a stress level below the yield stress of the material. From the Fig. 13 & 14, it can be seen as the number of fabric layers with 0o fiber orientation increases the impact energy and impact strength increases. This may be due to stretching and compressing of fiber fabric layers on the either side of the neutral plane during Izod impact test the 0° fibers which are along the pull direction resisted the load. Therefore specimens
with [0o]6 type absorbed maximum impact energy and have maximum impact strength. The GFRP composite specimens with [0°]6
[image:7.612.62.547.565.707.2]type can resists more impact load compared to other types.
Fig. 13 Bar chart of Average impact energy for Izod impact test specimens
Fig. 14 Bar chart of Average impact strength for Izod impact test specimens
O, 2.067 A, 4.785
B, 7.685 C, 8.395 D, 10.45 0 5 10 15 Im p ac t En e r gy (J)
Average Impact Energy
O, 0.098 A, 0.228
B, 0.366 C, 0.399 D, 0.497 0 0.2 0.4 0.6 Im p ac t S tr e n gth (J/ m m 2)
From the test, it was seen that the GFRP composite specimen with fiber orientation as [0°]6 showed highest absorbed impact energy
and impact strength as 10.445 Jand 0.4974 J/mm2 respectively. The GFRP composite specimen with fiber orientation as [0°/-45°/+30°/-30°/+45°/0°] showed lowest absorbed impact energy and impact strength as 4.785 Jand 0.2279 J/mm2 respectively.
IV. CONCLUSIONS
The following conclusions are drawn the results obtained by investigation of GFRP composite for Tensile, Flexural and Izod impact testing.
A. The specimens A, B, C and D with different fiber orientation and with 0.6 fiber volume fraction exhibited better mechanical properties than specimen O with no fibers.
B. The specimens with more number of fiber fabric layers orientated along the loading direction (0°) the tensile strength increased. Hence, the specimens with [0°]6 type exhibited maximum tensile strength and Young’s modulus. The specimens with
[0°/-45°/+30°/-30°/+45°/0°] type exhibited the least tensile strength and Young’s modulus among GFRP tensile specimens.
C. The specimens having 30° fiber fabric orientation showed better flexural strength compared to that of specimens without 30°
fiber fabric orientation. Hence, the specimens with [0°/0°/+30°/-30°/0°/0°] type exhibited maximum Flexural strength and Flexural modulus. The specimens with [0°]6 type exhibited the least Flexural strength and Flexural modulus among GFRP
bending specimens.
D. The Impact test shows that as the number of fiber fabric layers of 0° orientation increases the resistance to impact load
increases. Hence, the specimens with [0°]6 type exhibited the maximum impact strength and absorbed maximum energy. The
specimens with [0°/-45°/+30°/-30°/+45°/0°] type exhibited the least impact strength and absorbed minimum energy among GFRP impact specimens.
V. ACKNOWLEDGMENT
I would like to express my sincere thanks to my noble guide R. RAJASHEKAR, Assistant Professor, Department of Mechanical Engineering, University Visvesvaraya College of Engineering, for his inspiring guidance through thought provoking suggestions, constant encouragement and kind cooperation which enabled me to pass through successfully a good number of hurdles.
REFENCENCES
[1] Patil Deogonda, Vijaykumar N Chalwa, “Mechanical Property of Glass Fiber Reinforcement Epoxy Composites”, International Journal of Scientific Engineering and Research (IJSER), Volume 1 Issue 4 December 2013, e-ISSN: 2347‐3878.
[2] Keerthi Gowda B S, Velmurugan Ramachandran, “Prediction of Impact Strength properties of Sisal Polyester Composites”, National Conference – MTME’17, 2016-17, https://www.researchgate.net/publication/319059088.
[3] S. Eksi and K. Genel, “Comparison of Mechanical Properties of Unidirectional and Woven Carbon, Glass and Aramid Fiber Reinforced Epoxy Composites”, Special issue of the 3rd International Conference on Computational and Experimental Science and Engineering (ICCESEN 2016), Vol. 132 (2017).
[4] Mahesh Chandrashekhar Swamy, Parmeshwar Patil, Shivaji D. Chame, “Effect of Thickness and Fibre Orientation on Flexural Strength of GFRP Composites”, International Journal of Advancement in Engineering Technology, Management & Applied Science, Volume 3 Issue 1 April 2016, ISSN No: 2349-3224. [5] Mr. Sagar S. Chavan, “Experimental Study on Tensile Test and Three Point Bending Test of Jute Fibre Composite At Different Ply Orientations”, IJSART -
Volume 3 Issue 9 –SEPTEMBER 2017, ISSN [ONLINE]: 2395-1052.
[6] Mr. Santhosh Kumar. M, Dr. S. G. Gopala Krishna, Dr. Rajanna. S, “Study on Effect of Thickness and Fibre Orientation on a Tensile and Flexural Properties of a Hybrid Composite”, International Journal of Engineering Research and Applications ISSN: 2248-9622, Vol. 4, Issue 8( Version 6), August 2014, pp.56-66. [7] Infanta Mary Priya, B.K.Vinayagam, M.R.Stalin John, Sabarishwaran.M, “Mechanical Characterization of E-Glass Woven Fabric Composite: An Experimental
Study”, Journal of Chemical and Pharmaceutical Sciences, ISSN: 0974-2115, JCPS Volume 9 Issue 4 October - December 2016.
[8] Dr. R Jyothilakshmi, Dr. L Sunith Babu, Dr. BS Sridhar and HS Balasubramanya, “Mechanical Characterization and Analysis of GFRP Laminates with Graphene Reinforcement”, Research & Reviews: Journal of Engineering and Technology, e-ISSN: 2319-9873, RRJET Volume 6 Issue 4 December 2017. [9] “Mechanics of Composite materials”, second edition by Robert M. Jones, Taylor & Francis publications (2017).
[10] “Standard Test Method for Tensile Properties of Polymer Matrix Composite Materials”, ASTM: D3039/D3039M – 14.
[11] “Standard Test Methods for Flexural Properties of Unreinforced and Reinforced Plastics and Electrical Insulating Materials”, ASTM: D790 – 03. [12] “Standard Test Methods for Determining the Izod Pendulum Impact Resistance of Plastics”, ASTM: D256– 97.
[13] Nikhil V Nayak, “Composite Materials in Aerospace Applications”, International Journal of Scientific and Research Publications, Volume 4, Issue 9, September 2014, ISSN 2250-3153.
[14] Manjunath Shettar and Vithal Rao Chauhan, “Investigation on Mechanical Properties of E- Glass, Epoxy Resin With Asbestos Filled /Hybrid Composites”, Global Journal of Engineering Science and Research Management, February 2015, ISSN: 2349-4506.