A Study on the Attributes Sampling Plans in
MIL-STD-1916
M. H. C. Li, A.
Al-Refaie
and C. W. TsaoAbstract—The Department of Defense-USA adopted MIL-STD-1916 (Military Standard-1916) sampling plans instead of the traditional MIL-STD-105E (Military Standard-105E) sampling plans in 1996. MIL-STD-1916 emphasizes on an effective prevention-based strategy quality system. Its attributes sampling plans are based on “zero accept one reject” as criteria of judgment. In this paper, the lot sizes are regrouped from 11 groups into 18 new groups such that 100% inspection and sampling plan could be clearly separated. The results of this research provide guidance for both supplier and customer who use MIL-STD-1916.
Index Terms—Attribute Sampling Plan, MIL-STD-1916, MIL-STD-105E
I. INTRODUCTION
II. THE PROBABILITY OF ACCEPTANCE FOR FINITE
POPULATION
Suppose there are D defective items in a lot size, N. Then, the fraction nonconforming, p, is (D/N). Randomly select n
samples from this lot without replacement, the probability of x nonconforming items, P(x) is a hypergeometric distribution [6] as shown in (1)
.
( )
P x =
D N D x n x
N n C C C − −
,
0≤ ≤x min( , )D n
(1) Given the criteria of acceptance (n, c), if the number of nonconforming items, x, is less or equal to c, then the lot is accepted. Otherwise, it is rejected. The probability of acceptance, Pa, is shown in (2)
.
Since 1996, the Department of Defense-USA has adopted MIL-STD-1916 (Military Standard-1916) sampling plans [1-2] instead of the traditional MIL-STD-105E (Military Standard-105E) sampling plans [3]. MIL-STD-1916 is based on “zero accept one reject” as criteria of judgment. It emphasizes on the non-existence of nonconforming product. Also, the tables of MIL-STD-1916 are less than those of MIL-STD-105E. It makes the sampling plan much simple and user friendly. Also, ISO 16949 [4] adopts zero acceptance criteria for attribute sampling plan. However, there were seldom research papers investigating MIL-STD-1916 since it was published. Gillies [5] combined MIL-STD-1916 and ISO19114 into a methodological framework for the development of quality assurance procedures.
0
D N D c
x n x
a N x n C C P C − − =
=
∑
(2)If c is zero, the probability of acceptance, Pa, can be expressed as shown in (3) by replacing c with zero in (2).
0 ( )!(
( )!
D N D N D
n n
a N N
n n
C C C N D N n
P
C C N D n N
− − − −
= = =
− − )!
!
(3)
III. INVESTIGATION OF VERIFICATION LEVEL
A. SEPARATION OF 100% INSPECTION WITH SAMPLING PLAN
The purposes of this research are twofold. First, the lot sizes are regrouped such that 100% inspection is totally separated from sampling plan. Second, the probability of acceptance, Pa, is investigated while there is only one defective item in the lot. The results show that the lot size and verification level (VI) can be divided into 5 blocks.
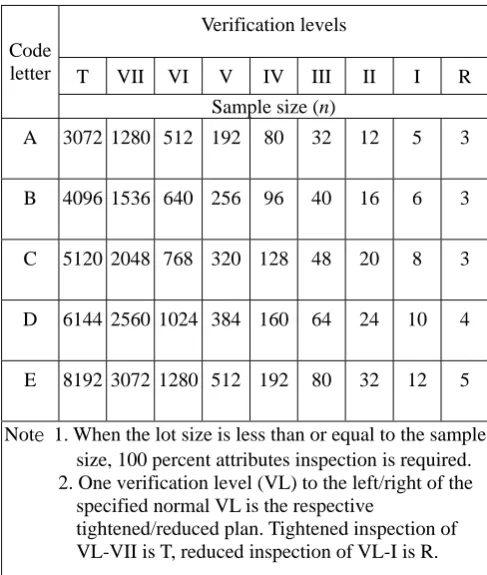
In MIL-STD-1916, the verification levels (VL) are specified in the contract or product specifications. The VL and code letters for entry into the sampling tables is shown in Table 1. The lot sizes are divided into 11 groups and there are 7 verification levels (I-VII). In section 5.2.2.1 of MIL-STD-1916, the attributes sampling plans for lots or batches are described in Table 2 for normal, tightened, and reduced inspection. There are 9 verification levels in Table 2. The 2 extra verification levels are tightened inspection, T, and reduced inspection, R.
Manuscript was submitted on 2010/12/2 and revised on 2011/01/13. This work was supported by the Department of Industrial Engineering and Systems Management in Feng Chia University and the National Science Council, Taiwan, under Grant No. NSC 99-2221-E-035-070-.
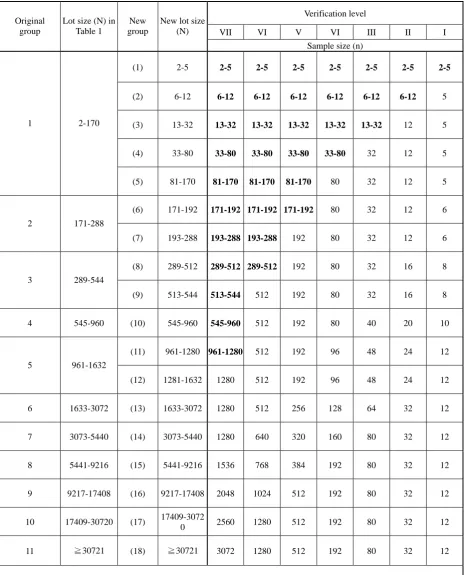
In order to match the sample size n for each lot size N
with each verification level (VL) directly, Table 1 and Table 2 are integrated together. Since there is neither tightened inspection nor reduced inspection in Table 1, only from verification level I to VII are combined together as shown in Table 3. From Table 3, it is shown that some sample size (Bold Case), n, are larger than lot size, N. It is not reasonable. Thus, for those sample size larger than lot size, M. H. C. Li is a professor in the Dept. of Industrial Engineering and
Systems Management in Feng Chia University, Taiwan. (corresponding
author e-mail: [email protected])
A. Al-Refaie is Chairman and Assistant Professor, Dept. of Industrial Engineering, Faculty of Engineering and Technology, University of Jordan, Amman, 11942, Jordan. (e-mail: [email protected])
the sample size should be adjusted to be equal to its lot size. Group 1 is regrouped into five new groups and illustrated as follow:
1.If the lot size N is within [2,5], then 100% inspection are needed for all VL.
2.If the lot size N is within [6,12], then 100% inspection are needed for VL=II-VII and sampling plan is needed for VL=I.
3.If the lot size N is within [13, 32], then 100% inspection are needed for VL=III-VII and sampling plan are needed for VL=I-II.
4.If the lot size N is within [33, 80], then 100% inspection are needed for VL=VI-VII and sampling plan are needed for VL=I-III.
5.If the lot size N is within [81, 170], then 100% inspection are needed for VL=V-VII and sampling plan are needed for VL=I-VI.
Thus, the original groups should be divided into more groups such that 100% inspection can be clearly separated from sampling plan for each VL. After careful examination, the lot sizes are divided into 18 new groups as shown in the third column of Table 4. The corresponding new 18 lot sizes are in the fourth column of Table 4. Now all the sample size are less than or equal to lot size. For the 18 new groups with 7 VL, there are 126 (=18×7) cases or cells. Among the 126 cells, 35 cells (Bold case) are 100% inspection and 91 cells are sampling plans. Thus, 100% inspection and sampling plan are totally separated.
B. THE RELATIONSHIP BETWEEN PROBABILITY OF
ACCEPTANCE AND PERCENT DEFECTIVE
For 100% inspection, the lot will be rejected, if there is one or more defective items in the lot. For sampling plan, there are (N+1) conditions for the finite population N. That is, D=0, 1, 2, …, N-1, N. Similarly, the percent defective p
also have (N+1) conditions. i. e. p=0, 1/N, 2/N, …, (N-1)/N, 1. If D is zero, then p is zero too, the probability of acceptance is one. If 0<D<(N-n), the probability of acceptance Pa is shown in (3). If D is larger than (N-n), then there will exist at least one defective item in the sample. Thus, the probability of acceptance is zero and the lot will be definitely rejected.
From Table 4, the smallest lot size of sampling plan is
N∈[6, 12] and its corresponding cell is (VL=I, n= 5). The value of Pa in this cell is computed according to (1). For example, if N is 6 and D is 1, then p is 1/6. The probability of acceptance, Pa, is 1/6. If N is 7 and D is 1, then p is 1/7. The probability of acceptance, Pa, is 6/21. If N is 7 and D is 2, then p is 2/7 and Pa is 1/21. For each combination of N and D, the value of p and Pacould be exactly computed. Similarly, for the other combination of lot size N and VL, the sample size can be found in Table 4. The values of p
and Pa can be exactly computed for each value of D.
C. THE VALUE OF Pa WHILE D IS ONE IN THE LOT
Since MIL-STD-1916 is zero based acceptances, the lot will be rejected, if there is a defective item in the sample. However, no defective item in the sample could not guarantee that there is no defective item in the population.
still has the possibility of acceptance. If D=1, the percent defective p is 1/N and the probability of acceptance Pa is shown in (4).
Pa
( ) !( ) ! ( 1) !( ) !
( ) ! ! ( 1 ) ! !
N D N n N N n
N D n N N n N
= − − = − −
− − − − (4)
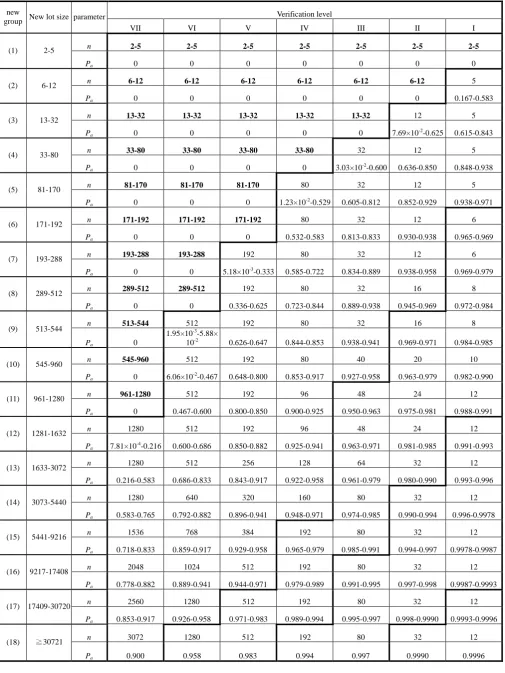
The range of Pa in each cell is shown in Table 5 and illustrated as follows.
1.There are 35 cells (Bold case) in which Pa =0 because of 100% inspection in these cells.
2.For the other 91 cells, sampling plans are executed. The minimum value of Pa is computed by sampling from the minimum value of N in this cell. The maximum value of Pa is computed by sampling from the maximum value of N in this cell. For example, in the cell of N∈[6, 12] and VL=I, n is 5.
1)If N is 6, then using (4), Pais 0.167. It is the smallest value in this cell.
2)If N is 12, then Pais 0.583, which is the largest value in this cell.
Thus, the value of Pa in this cell is within [0.167, 0.583]. By this way, the range of Pain each cell is computed. 3. In the18th group, the lot size N is equal to or larger than
30721. There is only one value of Pa. It means that the probability of acceptance will be equal to or larger than the value of Pa.
4. With the same lot size N, the larger the VL is, the smaller the value of Pa is. It is because the larger the VL is, the larger the sample size is. Eventually, the smaller the Pa is. 5. With the same VL, the larger the lot size is, the larger the
Pa is. It is because the larger the VL is, even if the larger the sample size is, still the smaller the value of p(=1/N) is. The effect of increase in sample size n could not offset the effect of decrease in percent defective p.
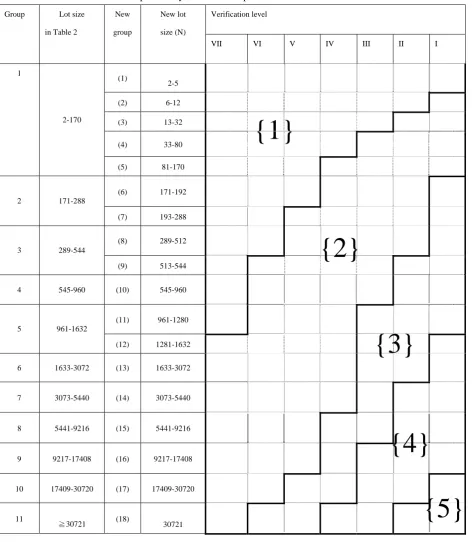
6. Finally, according to the value of Pain Table 5, the 126 cells can be divided into 5 blocks as shown in Table 6. Block {1} is 100% inspection and the others are sampling plan. There are 35 cells in Block {1} and Pa is zero in this Block. There are 53 cells in Block {2} and Pa is within [0, 0.95] in this Block. There are 53 cells in Block {2} and Pa is within [0, 0.95] in this Block. There are 22 cells in Block {3} and Pa is within [0.95, 0.99] in this Block. There are 13 cells in Block {4} and Pa is within [0.99, 0.999] in this Block. There are 3 cells in Block {5} and Pa is larger than 0.999 in this Block.
IV. CONCLUSION
Table 2: Attributes sampling plans Future research will investigate the acceptable quality
level and reject quality level of attribute sampling plan for MIL-STD-1916.
ACKNOWLEGEMENT
This research was supported in part by the National Science Council of the Republic of China, Grant No. NSC99-2221-E-035-070-.
REFERENCES
[1] MIL-STD-1916 (1996), Department of Defense Test Method Standard:
DOD Preferred Methods for Acceptance of Product.
[2] MIL-HDBK-1916 (1999), Department of Defense
Handbook: Companion Document to MIL-STD-1916.
[3] MIL-STD-105E (1989), Military Standard: Sampling Procedures and
Tables for Inspection by Attributes.
[4] ISO/TS 16949:2009, (2009), Quality management
systems-- Particular requirements for the application of ISO 9001:2008 for automotive production and relevant service part organizations, Geneva, Switzerland.
[5] Gillies, C.F. (2007), Geospatial Statistical Quality Management:
Integration of MIL-STD-1916 and ISO 19114:2003, 2007 ESRI User Conference Proceedings.
[6] Montgomery, D.C., (2009), Introduction to statistical quality control,
6th edition, John Wiley & sons, Inc.
Verification levels
T VII VI V IV III II I R
Code letter
Sample size (n)
A 3072 1280 512 192 80 32 12 5 3
B 4096 1536 640 256 96 40 16 6 3
C 5120 2048 768 320 128 48 20 8 3
D 6144 2560 1024 384 160 64 24 10 4
E 8192 3072 1280 512 192 80 32 12 5
Note 1. When the lot size is less than or equal to the sample size, 100 percent attributes inspection is required. 2. One verification level (VL) to the left/right of the
specified normal VL is the respective
[image:3.595.325.569.66.354.2]tightened/reduced plan. Tightened inspection of VL-VII is T, reduced inspection of VL-I is R.
Table 3: Convert Code letters into Sample size for each Lot size and VL Table 1: Code letters for entry into the sampling tables
Verification levels Original
group
Lot or production
interval size VII VI V IV III II I
1 2-170 A A A A A A A
2 171-288 A A A A A A B
3 289-544 A A A A A B C
4 545-960 A A A A B C D
5 961-1632 A A A B C D E
6 1633-3072 A A B C D E E
7 3073-5440 A B C D E E E
8 5441-9216 B C D E E E E
9 9217-17408 C D E E E E E
10 17409-30720 D E E E E E E
11 ≧30721 E E E E E E E
Verification levels
VII VI V IV III II I Original
group
Lot or
production
interval size
(N) Sample size (n)
1 2-170 1280 512 192 80 32 12 5
2 171-288 1280 512 192 80 32 12 6
3 289-544 1280 512 192 80 32 16 8
4 545-960 1280 512 192 80 40 20 10
5 961-1632 1280 512 192 96 48 24 12
6 1633-3072 1280 512 256 128 64 32 12
7 3073-5440 1280 640 320 160 80 32 12
8 5441-9216 1536 768 384 192 80 32 12
9 9217-17408 2048 1024 512 192 80 32 12
10 17409-30720 2560 1280 512 192 80 32 12
11 ≧30721 3072 1280 512 192 80 32 12
Table 4: Sample size for each New lot size and VL
Verification level
VII VI V VI III II I Original
group
Lot size (N) in Table 1
New group
New lot size (N)
Sample size (n)
(1) 2-5 2-5 2-5 2-5 2-5 2-5 2-5 2-5
(2) 6-12 6-12 6-12 6-12 6-12 6-12 6-12 5
(3) 13-32 13-32 13-32 13-32 13-32 13-32 12 5
(4) 33-80 33-80 33-80 33-80 33-80 32 12 5 1 2-170
(5) 81-170 81-170 81-170 81-170 80 32 12 5
(6) 171-192 171-192 171-192 171-192 80 32 12 6
2 171-288
(7) 193-288 193-288 193-288 192 80 32 12 6
(8) 289-512 289-512 289-512 192 80 32 16 8
3 289-544
(9) 513-544 513-544 512 192 80 32 16 8
4 545-960 (10) 545-960 545-960 512 192 80 40 20 10
(11) 961-1280 961-1280 512 192 96 48 24 12
5 961-1632
(12) 1281-1632 1280 512 192 96 48 24 12
6 1633-3072 (13) 1633-3072 1280 512 256 128 64 32 12
7 3073-5440 (14) 3073-5440 1280 640 320 160 80 32 12
8 5441-9216 (15) 5441-9216 1536 768 384 192 80 32 12
9 9217-17408 (16) 9217-17408 2048 1024 512 192 80 32 12
10 17409-30720 (17) 17409-3072
0 2560 1280 512 192 80 32 12
11 ≧30721 (18) ≧30721 3072 1280 512 192 80 32 12
Table 5: The value of Pafor D=1 in the lot N
Verification level new
group New lot size parameter
VII VI V IV III II I
n 2-5 2-5 2-5 2-5 2-5 2-5 2-5
(1) 2-5
Pa 0 0 0 0 0 0 0
n 6-12 6-12 6-12 6-12 6-12 6-12 5
(2) 6-12
Pa 0 0 0 0 0 0 0.167-0.583
n 13-32 13-32 13-32 13-32 13-32 12 5
(3) 13-32
Pa 0 0 0 0 0 7.69×10⁻²-0.625 0.615-0.843
n 33-80 33-80 33-80 33-80 32 12 5
(4) 33-80
Pa 0 0 0 0 3.03×10⁻²-0.600 0.636-0.850 0.848-0.938
n 81-170 81-170 81-170 80 32 12 5
(5) 81-170
Pa 0 0 0 1.23×10⁻²-0.529 0.605-0.812 0.852-0.929 0.938-0.971
n 171-192 171-192 171-192 80 32 12 6
(6) 171-192
Pa 0 0 0 0.532-0.583 0.813-0.833 0.930-0.938 0.965-0.969
n 193-288 193-288 192 80 32 12 6
(7) 193-288
Pa 0 0 5.18×10⁻³-0.333 0.585-0.722 0.834-0.889 0.938-0.958 0.969-0.979
n 289-512 289-512 192 80 32 16 8
(8) 289-512
Pa 0 0 0.336-0.625 0.723-0.844 0.889-0.938 0.945-0.969 0.972-0.984
n 513-544 512 192 80 32 16 8
(9) 513-544
Pa 0
1.95×10⁻³-5.88×
10-2 0.626-0.647 0.844-0.853 0.938-0.941 0.969-0.971 0.984-0.985
n 545-960 512 192 80 40 20 10
(10) 545-960
Pa 0 6.06×10⁻²-0.467 0.648-0.800 0.853-0.917 0.927-0.958 0.963-0.979 0.982-0.990
n 961-1280 512 192 96 48 24 12
(11) 961-1280
Pa 0 0.467-0.600 0.800-0.850 0.900-0.925 0.950-0.963 0.975-0.981 0.988-0.991
n 1280 512 192 96 48 24 12
(12) 1281-1632
Pa 7.81×10⁻⁴-0.216 0.600-0.686 0.850-0.882 0.925-0.941 0.963-0.971 0.981-0.985 0.991-0.993
n 1280 512 256 128 64 32 12
(13) 1633-3072
Pa 0.216-0.583 0.686-0.833 0.843-0.917 0.922-0.958 0.961-0.979 0.980-0.990 0.993-0.996
n 1280 640 320 160 80 32 12
(14) 3073-5440
Pa 0.583-0.765 0.792-0.882 0.896-0.941 0.948-0.971 0.974-0.985 0.990-0.994 0.996-0.9978
n 1536 768 384 192 80 32 12
(15) 5441-9216
Pa 0.718-0.833 0.859-0.917 0.929-0.958 0.965-0.979 0.985-0.991 0.994-0.997 0.9978-0.9987
n 2048 1024 512 192 80 32 12
(16) 9217-17408
Pa 0.778-0.882 0.889-0.941 0.944-0.971 0.979-0.989 0.991-0.995 0.997-0.998 0.9987-0.9993
n 2560 1280 512 192 80 32 12
(17) 17409-30720
Pa 0.853-0.917 0.926-0.958 0.971-0.983 0.989-0.994 0.995-0.997 0.998-0.9990 0.9993-0.9996
n 3072 1280 512 192 80 32 12
(18) ≧30721
Table 6: The probability blocks of acceptance when D is one in the lot
{1}
Verification levelGroup Lot size
in Table 2
New
group
New lot
size (N)
VII VI V IV III II I
(1)
2-5
(2) 6-12
(3) 13-32
(4) 33-80 1
2-170
(5) 81-170
(6) 171-192 2 171-288
(7) 193-288
(8) 289-512 3 289-544
(9) 513-544
4 545-960 (10) 545-960
(11) 961-1280 5 961-1632
(12) 1281-1632
{2}
6 1633-3072 (13) 1633-3072
7 3073-5440 (14) 3073-5440
8 5441-9216 (15) 5441-9216
9 9217-17408 (16) 9217-17408
{3}
10 17409-30720 (17) 17409-30720
11
≧30721 (18) 30721