Original Article
Dynamic alteration of CD4
+and CD4
-effector/memory
T-cell levels in an asthmatic mouse model
Yanchun Li1, Fan Li2, Xiuhua Yu1, Li Liu1
1First Hospital of Jilin University, Changchun, China; 2Changchun Institute of Applied Chemistry, Chinese Academy
of Science, Changchun, China
Received April 24, 2019; Accepted July 4, 2019; Epub August 15, 2019; Published August 30, 2019
Abstract: Objective: The aim of the current study was to investigate the timing of CD4+ and CD4- effector memory T-cell (TEM) expression levels during an antigen challenge in an asthmatic mouse model. Methods: A total of 51 mice were sensitized with ovalbumin (OVA), then challenged with OVA for 7 consecutive days (asthma group).Another 6 mice were sensitized and challenged with phosphate-buffered saline (PBS) (control group). Spleen and lung cells
were harvested, at various time points, up to 30 days after the final challenge. Percentages of CD4+ and CD4- TEM cells (CD3+CD4+/CD4-CD44HighCD62Lneg), out of the total CD4+ and CD4- T-cell populations, were determined by flow cytometry. Results: Percentages of CD4+ and CD4- TEM cells were higher in OVA-challenged mice than in control
mice at 48 hours after the final OVA challenge. In the asthma group, percentages of CD4+ TEM cells in the lungs increased rapidly during the OVA challenge. Levels were continuously elevated after the challenge ended, reaching
a peak (55.69 ± 2.18%) at day 6 after the final challenge. Levels then declined, gradually, to 20.04 ± 4.39% at day 30 after the final challenge. Percentages of CD4- TEM cells in the lungs also increased, gradually, during the
OVA challenge period. However, levels peaked (61.97 ± 3.22%) earlier at 2 days after the final challenge. They then decreased more rapidly to less than 20% at 2 weeks after the final challenge. Conclusion: CD4+ and CD4- TEM cells exhibited different expression patterns during and after the OVA challenge.
Keywords: Bronchial asthma, immunologic memory, flow cytometry, animal model, T-cell
Introduction
Asthma, one of the most prevalent chronic dis-eases worldwide, is characterized by chronic airway inflammation. This results in recurrent attacks of coughing and wheezing, as well as chest tightness and variable airflow obstruc -tion. Over time, the airflow obstruction may become irreversible due to airway remodeling [1]. There are many mechanisms involved in the pathogenesis of asthma, including heredity, respiratory infections, neuro-regulation, and immunological mechanisms. For many years, asthma has been considered a T helper (Th) 2 cell-mediated disorder. However, in recent years, other cell types, such as regulatory T (Treg) cells, Th1 cells, and Th17 cells, have been found to be involved in the pathogenesis of asthma [2, 3]. Effector memory T-cells (TEM) play a particularly important role. Airway inflam -mation in asthma has been associated with activated T-cells, as well as cytokines secreted after bronchial allergen challenge [4]. Some
marker. Mouse TEM cells were further classi-fied as CD62L+ central memory T (TCM) cells and CD62L- TEM cells [16, 17]. Dynamic altera-tion levels of CD4+ and CD4- TEM cells (defined as CD4+/-CD3+CD44HighCD62L- T cells) were in- vestigated in detail. Understanding the devel-opment of TEM cells in the pathogenesis of asthma may help to elucidate the mechanisms of asthma, providing theoretical evidence and guidance for new therapeutic strategies.
Methods
Asthmatic mouse model
Female BALB/c mice, aged 6-8 weeks and weighing 18-22 g, were obtained from the Center of Laboratory Animals, School of Basic Medical Sciences, Jilin University. They were maintained in a pathogen-free facility with con-stant humidity and temperature levels. They were exposed to a 12-hour light/dark cycle and given free access to food and water. Inducing bronchial asthma, 57 mice were randomized into either the asthma (n = 51) group or normal control (n = 6) group. Mice in the asthma group were sensitized by intraperitoneal injections with 10 µg of ovalbumin (OVA, grade V, Sigma-Aldrich, St. Louis, MO, USA) and 2 mg of alumi-num hydroxide (Pierce Biotechnology, Rockford, IL, USA) in 100 µL of phosphate-buffered saline (PBS) on days 0, 7, and 14. Daily challenges with aerosolized 2% OVA for 1 hour began one week after the last sensitization. They contin-ued for a total of 7 consecutive days. PBS was used to replace OVA in the normal control group. Levels of IgE, Interleukin-4, and Inter- feron-γ were detected by ELISA. Eosinophil and neutrophil counts in bronchoalveolar lavage fluid and hematoxylin and eosin staining of lung tissues were used to establish the asthmatic mouse model. Every several (2-5) days, begin-ning the day before the first challenge to 30 days after the last challenge, three mice in the asthma group, at each time point, were sacri-ficed. Spleens and lung cells were isolated for flow cytometry. At 48 hours after the last chal -lenge, six mice in the asthma group and six
ELISA
Serum IgE, IL-4, and IFN-γ were detected by ELISA using specific kits, according to manu-facturer instructions. Briefly, 50 ul assay dilu -ent was added into each well of a 96-well dish containing testing cells. Next, 50 ul standard, reference, or sample was added to the well and mixed gently for 1 minute. It was then covered with an adhesive strip. The dish was incubated at room temperature for 2 hours after covering with an adhesive strip. It was washed 5 times, added with 100 ul conjugate, sealed with a new adhesive strip, and incubated at room tempera-ture for 2 hours. After washing another 5 tim- es, each well was added with 100 ul substrate solution, incubated at room temperature for 30 minutes avoiding light, and added with 100 ul Termination fluid. Optical density values were detected at 450 nm with a spectrometric read-er within 30 minutes.
Fluorescence-activated cell sorting (FACS) analysis
Preparing the spleen cells, mouse spleens we- re cut into small pieces. They were mashed by two ground glass plates, filtered twice through a 200-mesh strainer, and washed twice with PBS solution. Obtained cells were resuspended in RPMI 1640 culture medium (Hyclone, Oma- ha, NE, USA), counted, and adjusted to a con-centration of 5 × 10⁶/mL.
Preparing the lung cells, the mice were anes-thetized. The right atrium of each heart was punctured with a needle. Hemoperfusion was performed with PBS until the lungs turned white. The right lung was then harvested and single cells were prepared according to the same process used for the isolation of spleen cells.
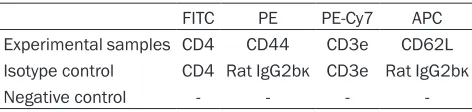
[image:2.612.91.327.83.139.2]Regarding flow cytometric analysis, 100 μL of the cell suspension (5 × 10⁵ cells) was mixed with fluorophore-conjugated antibodies, as shown in Table 1. For the other tests, cells were labeled with FITC-conjugated anti-mou- se CD4, PE-Cy7-conjugated anti-mouse CD3e,
Table 1. Antibodies for flow cytometric analysis
FITC PE PE-Cy7 APC
Experimental samples CD4 CD44 CD3e CD62L Isotype control CD4 Rat IgG2bκ CD3e Rat IgG2bκ
Negative control - - -
-mice in the normal control group were sacrificed. Their spleens and lung cells were isolated.
PE-conjugated anti-mouse CD44, and APC-conjugated anti-mouse CD62L. Controls cells were labeled with FITC-conjugated anti-mouse CD4, PE-Cy7-conjugated anti-mouse CD3e, PE- conjugated rat IgG2bκ, and APC-conjugated rat IgG2bκ. Negative controls contained cells with -out antibodies. All antibodies were from BD Pharmingen (San Jose, CA, USA). Diluted BD FACS Lysing Solution (BD Pharmingen, 1 mL) was mixed with the test cells and the corre-sponding antibodies for 5-10 min. The cell mix-tures were then centrifuged, washed with PBS, resuspended in PBS (cells from one lung were suspended in 300 µL), and sorted on a BD FACSCalibur flow cytometer (BD Pharmingen). Finally, the cells were sorted for CD3 and CD4 expression, then resorted for CD44 and CD- 62L expression. Percentages of CD3+CD4+- CD44HighCD62L- TEM cells and CD3+CD4 -CD44HighCD62L- TEM cells, of the total amount of CD3+CD4- T-cells, were calculated.
Statistical analysis
Data from the asthma group and normal con-trol group were compared using unpaired Stu- dent’s t-tests. P < 0.05 indicates statistical sig-nificance. Data are presented as mean ± stan -dard error of the mean.
Results
Establishment of the asthmatic mouse model
The established asthmatic mouse model was verified by multiple tests. Mice in the asthma group exhibited scratching of the head and
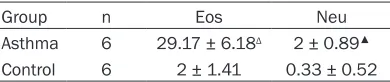
nose, as well as sneezing, on the second day after OVA inhalation. This was followed by weak shortness of breath, abdominal muscle twitch-ing, weight loss, coat color loss, and luster deterioration. Mice in the normal group did not show any of the above symptoms. Serum levels of IgE and IL-4 in the asthma group were signifi -cantly higher than those in the normal group (P < 0.01). Serum levels of IFN-γ in the asthma group were significantly lower than those in the normal group (P < 0.01; Table 2). In addition, eosinophil and neutrophil counts in the bron-choalveolar lavage fluid in the asthma group were significantly higher than those in the nor -mal group (P < 0.01; Table 3).
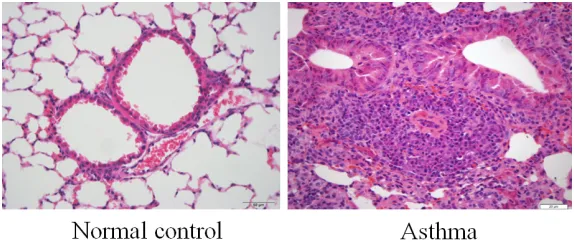
Lung tissue samples of the normal group sh- owed that the bronchial epithelium was intact. There was no infiltration of inflammatory cells. However, samples from the asthma group pre-sented inflammatory cell infiltration of the bron -chial mucosa and submucosa on the bron-chial wall and its adjacent vessels, including lym- phocytes, eosinophils, and neutrophils. These were accompanied by goblet cell hyperplasia, smooth muscle thickening, lumen constriction, and adjacent small artery wall thickening and constriction (Figure 1). These alterations veri-fied the establishment of an asthmatic mouse model.
Percentages of CD4+ TEM cells and CD4- TEM
cells in the OVA-challenged mice
Numbers of CD4+ and CD4- T-cells (CD3+), as well as TEM cells (CD44HighCD62L-) (Figure 2), were evaluated by flow cytometry at 48 hours after the OVA challenge. Percentages of TEM cells are shown in Tables 4 and 5. Percentages of CD4+ TEM cells, of the total CD4+ T-cells (55.69 ± 2.18%), in the asthma group were sig-nificantly higher than those in the normal con -trol group (11.32 ± 1.72%) in the lungs (P < 0.0001). The distribution of the percentages of CD4- TEM cells in the lungs showed a similar pattern (61.97 ± 3.22% vs. 12.24 ± 2.18%) (P < 0.0001). Present data indicates that pulmo-nary CD4+ and CD4- TEM cells may play impor-tant roles in asthma. Notably, the percentage of CD4- TEM cells was obviously higher than that of CD4+ TEM cells in the asthma group (P < 0.05). However, the number of CD4- TEM cells rapidly declined (Figure 4). These alterations suggest that CD4- TEM cells are likely involved in the onset of asthma.
Table 2. Levels of serum interleukin (IL)-4, inter-feron (IFN)-γ, and IgE in each group
Group n IL-4 (pg/mL) IFN-γ (pg/mL) IgE (µg/mL) Asthma 6 47.95 ± 5.03Δ 2.15 ± 1.02▲ 115.4 ± 7.09Δ Control 6 13.19 ± 1.52 6.81 ± 1.94 11.29 ± 1.31 Note: Δ: compared with normal control group, P < 0.0001; ▲:
[image:3.612.92.287.202.243.2]compared with normal control group, P < 0.001.
Table 3. Counts of eosinophil and neutrophil in BALF of each group
Group n Eos Neu
Asthma 6 29.17 ± 6.18Δ 2 ± 0.89▲
Control 6 2 ± 1.41 0.33 ± 0.52
Eos: eosinophils; Neu: neutrophils; Δ: compared with
normal control group, P < 0.0001; ▲: compared with
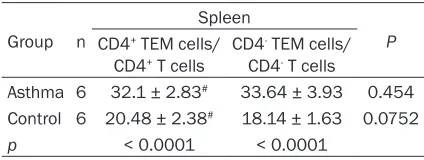
In mice spleens, the percentage of CD4+ TEM cells, of the total CD4+ T cells (32.1 ± 2.83%), was significantly higher than that in the normal control group (20.48 ± 2.38%) (P < 0.0001). Similarly, the percentage of CD4- TEM cells, of the total CD4- T cells, in the asthma group was much higher than that of the control group (33.64 ± 3.93% vs. 18.14 ± 1.63%; P < 0.0001;
Table 5). Results suggest that spleen CD4+ and CD4- TEM cells are implicated in the pathogen-esis of asthma. However, there were no differ-ences between the percentages of CD4+ TEM cells and CD4- TEM cells in the asthma group in the spleens (Table 5).
Interestingly, the percentage of TEM cells in the lungs, whether they were CD4+ or CD4- TEM cells, was much lower than that in the spleens. However, after sensitization and aerosol chal-lenge with 2% OVA by inhalation, percentages of TEM cells in the lungs, whether they were CD4+ or CD4- TEM cells, were dramatically in- creased. They were significantly higher than levels in the spleens (Tables 4 and 5). These findings may help explain the different roles of TEM cells in different organs, including the lungs and spleen.
Alterations of TEM cell percentages over time in OVA-challenged mice
Percentages of CD4+ and CD4- TEM cells in the spleen and lung cells in the asthma group were monitored on the day before the initial OVA challenge to 30 days after the final challenge. Percentages of CD4+ TEM cells, of the total CD4+ T cells, were 17.34 ± 0.22% and 20.63 ± 0.99% in the lungs and spleens, respectively, before the initial challenge. The percentage of CD4+ TEM cells in the lungs increased to 36.68 ± 6.10% on day 4 after the initial challenge.
was in accord with that in the lungs. However, the overall increased value was relatively lower and happened slightly later than that in the lungs. The percentage of CD4+ TEM cells in the spleens reached a peak (45.16 ± 3.40%) at day 7 after the final OVA challenge, then de-creased gradually to 25.01 ± 1.20% at day 16 after the final challenge. Levels remained at 25-30% through day 30 (Figure 3).
The baseline percentage of CD4- TEM cells in the lungs and spleens was 26.99% and 22.12 ± 3.77%, respectively, before the initial chal-lenge. The ratio in the lungs gradually elevated and reached a plateau of 51.13 ± 1.54% on day 4 after the initial challenge. Levels increased again after the final challenge, reaching a peak (61.97 ± 3.22%) on day 2 after the final chal -lenge. Levels then decreased rapidly to less than 20% within 2 weeks after the final chal -lenge (Figure 4). In contrast, CD4- TEM cell per-centages in the spleens remained around the baseline level of approximately 20% during the OVA challenge, then increased rapidly to 33.64 ± 3.93% after the final challenge. Levels re-mained constant between 18-30% for 2 weeks, then returned to the baseline level by day 30 (Figure 4). The alternating pattern of CD4- TEM cells in the spleens, during and after the OVA challenge, was quite different from that in the lungs. It was also quite different from the CD4+ TEM cell alternating pattern.
Discussion
[image:4.612.89.376.71.193.2]Flow cytometry has been widely applied for detection of cellular types, quantitatively and qualitatively, according to specific cellular mar-kers. In the context of asthma, flow cytometry has been widely accepted for identification of TEM cells (CD44hiCD62Llo) and TCM cells Figure 1. Hematoxylin and eosin staining of lung tissues in indicated groups
(400 × magnification).
This number remained around 40-45% for several days, then elevated again after the final OVA challenge. It reached a peak (55.69 ± 2.18%) at day 2 after the final challenge, th-en remained over 50% for 7 days after peaking. Afterward, the ratio declined, gradually, to 20.04 ± 4.39% at day 30 after the final OVA challenge (Figure 3).
(CD44hiCD62Lhi) in mice lungs [18, 19], central memory (CD45RA-CCR7+) CD8+ T-cells, and ef- fector memory (CD45RA+/-CCR7-) CD8+ T-cells from human peripheral blood [20]. Therefore, in the current study, flow cytometry was app-lied, identifying both CD4+ and CD4- TEM cell levels.
[image:5.612.87.527.74.547.2]Antigens play an important role in the produc-tion of memory T-cells and activaproduc-tion of naive CD4+ T-cells to produce lymphokines. These are needed for proliferation and generation of lymphoblast-derived effector cells, as well as the production of memory cells [21]. TEM cells have the characteristics of effector cells. They Figure 2. Identification of TEM cells by flow cytometry. Spleen and lung cells were harvested at 48 hours after the fi
-nal OVA challenge (asthma group) or PBS administration (control group) and detected by flow cytometry. CD3+CD4 +/-CD44HighCD62L- TEM cells were identified using FITC-conjugated anti-mouse CD4, PE-Cy7-conjugated anti-mouse CD3e, PE-conjugated anti-mouse CD44, and APC-conjugated anti-mouse CD62L. For isotype controls,
rapidly produce microbicidal lymphokines dur-ing secondary immune responses. In contrast, TCM cells proliferate to produce new effector cells. They recreate themselves during secon- dary immune responses [21]. The current ex- amination of the development of TEM cells in OVA-sensitized and OVA-challenged mice dem-onstrated that percentages of CD4+ and CD4 -TEM cells were much higher in the spleens and lungs of OVA-sensitized mice, compared with those in normal control mice. These findings are consistent with the results of Mojtabavi et al. They identified allergen-specific memory Th2 cells in both the lungs and spleens in an OVA-induced asthmatic mouse model [5]. Gi- ven the important roles of antigens in the pro-duction of TEM cells, it is not surprising that mice exposed to OVA developed more TEM cells than control mice. In the control mice without OVA challenge, ratios of CD4+ and CD4- TEM cells were higher in the spleens than in the lungs. In contrast, in OVA-challenged mice, the ratio was higher in the lungs than in the sple- ens. Current findings suggest that TEM cells accumulate in the local attacked organ rather than in the lymphatic system, even though sen-sitization is systematic. Circulation patterns of memory T-cells may account for these results. TEM cells can circulate between lymphoid tis-sues and nonlymphoid tistis-sues during steady-state conditions. However, they are largely ex-
cluded from lymph nodes. Indeed, most TEM cells locate to nonlymphoid sites. TCM cells, in contrast, mainly circulate in lymphoid tissues (lymph nodes, spleen, and bone marrow) and the blood [22]. In addition, TEM cells detected in this study may include tissue-resident mem-ory cells, a recently identified subset of memo -ry cells that express low levels of CCR7 and CD62L, as with TEM cells. However, these tis-sue-resident memory cells have high levels of local nonlymphoid tissue-homing molecules, such as CD103 and CD69. These cells reside in the peripheral nonlymphoid tissues long after the initial immune response [23]. During the observation of quantitative TEM cells, over ti- me, in the asthma group, it was found that CD4+ TEM cells peaked at day 2 after the final OVA challenge. They were maintained at a high level until day 9 after the final OVA challenge. Moreover, levels were still slightly higher than the baseline level at day 30 after the final chal -lenge. In a study of OVA-sensitized mice, Th2 memory cells were reported to be able to exist in the lungs for more than 400 days. This allows the mice to recover from acute diseases and recover after re-exposure to aerosolized OVA over 400 days [5]. These cells have been shown to contribute to generation, persistence, and progression of asthma [5, 24]. Present findings revealed dynamic and quantitative fluctuations of CD4+ TEM cells during the generation, pro-gression, and remission of an immune response in asthmatic mice.
[image:6.612.91.300.96.175.2]In addition, CD4- TEM cells may participate in the pathogenesis of asthma, but with a differ-ent pattern. The percdiffer-entage of CD4- TEM cells reached a peak on day 2 after the final ch-allenge. However, levels declined rapidly and completely the following two weeks. These re- sults suggest that CD4+ TEM cells and CD4 -TEM cells may play different roles in asthma. They also suggest that pathophysiological ch- anges in the lungs of OVA-challenged mice are more likely to be mediated by CD4+ TEM cells, as they remain at high levels in the lungs for a longer time than CD4- TEM cells. The finding that CD8+ T-cells act as important helpers for CD4+ T-cells during asthma [25] may explain these results, to some extent. T lymphocytes include two main subsets, CD4+ T-cells and CD8+ T-cells. Thus, the majority of the CD4 -T-cells, in the current study, was CD8+ T-cells. The high number of CD4- TEM (presumably
Table 4. Percentages of TEM cells at 48 hours after the final OVA challenge in the lungs
Group n
Lung
P CD4+ TEM cells/
CD4+ T cells
CD4- TEM cells/ CD4- T cells
Asthma 6 55.69 ± 2.18Δ 61.97 ± 3.22 0.003 Control 6 11.32 ± 1.72# 12.24 ± 2.18 0.434
p < 0.0001 < 0.0001
Note: #P > 0.05 compared with CD4- TEM cells/CD4- T-cells; ΔP < 0.05 compared with CD4- TEM cells/CD4- T-cells.
Table 5. Percentages of TEM cells at 48 hours after the final OVA challenge in the spleens
Group n
Spleen
P CD4+ TEM cells/
CD4+ T cells CD4
- TEM cells/ CD4- T cells
Asthma 6 32.1 ± 2.83# 33.64 ± 3.93 0.454 Control 6 20.48 ± 2.38# 18.14 ± 1.63 0.0752
p < 0.0001 < 0.0001
[image:6.612.89.301.239.319.2]CD8+) cells observed during the onset phase of asthma in this study may act as helpers for the relatively low number of CD4+ T-cells. In later phases of the disease, as the number of CD4+ TEM cells increases, the need for helper cells would be expected to decrease, perhaps ex- plaining the rapid decrease of CD4- cells after the onset phase of asthma.
In summary, present results suggest that both CD4+ and CD4- TEM cells participate in the pathogenesis of asthma in a mouse model. However, their roles were shown to be different because of different dynamic alteration pat-terns during and after the OVA challenge. Fur- ther exploration is warranted, examining the mechanisms in which these lymphocyte sub-types affect asthma development.
Acknowledgements
This work was supported by the National Natural Science Foundation of China (Grant no. 81100014 and 51503201). Content was
[1] Yukselen A and Kendirli SG. Role of immuno-therapy in the treatment of allergic asthma. World J Clin Cases 2014; 2: 859-865.
[2] Agache I, Akdis C, Jutel M and Virchow JC. Un-tangling asthma phenotypes and endotypes. Allergy 2012; 67: 835-846.
[3] Jutel M and Akdis CA. T-cell subset regulation in atopy. Curr Allergy Asthma Rep 2011; 11: 139-145.
[4] Lara-Marquez ML, Moan MJ, Cartwright S, List-man J, Israel E, Perkins DL, Christiani DC and Finn PW. Atopic asthma: differential activation phenotypes among memory T helper cells. Clin Exp Allergy 2001; 31: 1232-1241.
[5] Mojtabavi N, Dekan G, Stingl G and Epstein MM. Long-lived Th2 memory in experimental allergic asthma. J Immunol 2002; 169: 4788-4796.
[6] Ayasoufi K, Yu H, Fan R, Wang X, Williams J
and Valujskikh A. Pretransplant antithymocyte
globulin has increased efficacy in controlling
donor-reactive memory T cells in mice. Am J Transplant 2013; 13: 589-599.
[image:7.612.90.376.72.178.2][7] Fukunaga A, Ishikawa T, Kishihata M, Shindo T, Hori T and Uchiyama T. Altered homeostasis of Figure 3. Alteration of percentages of CD4+ TEM cells of the total CD4+ T-cells
during and after the OVA challenge. Spleen (red) and lung (black) cells were harvested from three mice at the indicated times, up to 30 days after the
final challenge. Percentages of CD4+ TEM cells (CD3+CD4+CD44HighCD62L-), of the total CD4+ cells, were determined using flow cytometry.
Figure 4. Alteration of percentages of CD4- TEM cells of the total CD4- T-cells during and after the OVA challenge. Spleen (red) and lung (black) cells were harvested from three mice at the indicated times, up to 30 days after the
final challenge. Percentages of CD4- TEM cells (CD3+CD4-CD44HighCD62L-), of the total CD4- T-cells, were determined using flow cytometry.
presented at the 2013 and 2014 American Association of Immunologists (AAI) Annual Meetings on Immunology in Honolulu, HI, USA, and Pitts- burgh, PA, USA, respectively.
Disclosure of conflict of inter
-est
None.
Abbreviations
FACS, fluorescence-activated cell sorting; OVA, ovalbumin; PBS, phosphate-buffered sa- line; TCM cells, central me- mory T-cells; TEM cells, effe- ctor memory T-cells; Th, T helper; Treg cells, regulatory T-cells.
Address correspondence to: Li Liu, The First Hospital of Jilin University, No.71, Xinmin Street, Changchun, Jilin, China. Tel: +86-15804301885; E-mail: liuli0205 @163.com
[image:7.612.90.378.261.368.2]CD4(+) memory T cells in allogeneic hemato-poietic sTEM cell transplant recipients: chronic graft-versus-host disease enhances T cell dif-ferentiation and exhausts central memory T cell pool. Biol Blood Marrow Transplant 2007; 13: 1176-1184.
[8] Wakatsuki K, Sho M, Yamato I, Takayama T, Matsumoto S, Tanaka T, Migita K, Ito M, Hotta K and Nakajima Y. Clinical impact of
tumor-in-filtrating CD45RO (+) memory T cells on hu -man gastric cancer. Oncol Rep 2013; 29: 1756-1762.
[9] Sui Y, Gagnon S, Dzutsev A, Zhu Q, Yu H, Hogg A, Wang Y, Xia Z, Belyakov IM, Venzon D, Klin-man D, Strober W, Kelsall B, Franchini G and Berzofsky JA. TLR agonists and/or IL-15 adju-vanted mucosal SIV vaccine reduced gut CD4(+) memory T cell loss in SIVmac251-chal-lenged rhesus macaques. Vaccine 2011; 30: 59-68.
[10] Chirkova TV, Naykhin AN, Petukhova GD, Kore-nkov DA, Donina SA, Mironov AN and Rudenko LG. Memory T-cell immune response in healthy young adults vaccinated with live attenuated
influenza A (H5N2) vaccine. Clin Vaccine Im -munol 2011; 18: 1710-1718.
[11] Bottcher JP, Schanz O, Wohlleber D, Abdullah Z, Debey-Pascher S, Staratschek-Jox A, Hochst B, Hegenbarth S, Grell J, Limmer A, Atreya I, Neurath MF, Busch DH, Schmitt E, van Endert P, Kolanus W, Kurts C, Schultze JL, Diehl L and Knolle PA. Liver-primed memory T cells
gener-ated under noninflammatory conditions pro -vide anti-infectious immunity. Cell Rep 2013; 3: 779-795.
[12] Cherukuri A, Patton K, Gasser RA Jr, Zuo F, Woo J, Esser MT and Tang RS. Adults 65 years old and older have reduced numbers of functional memory T cells to respiratory syncytial virus fu-sion protein. Clin Vaccine Immunol 2013; 20: 239-247.
[13] Lindestam Arlehamn CS, Gerasimova A, Mele F, Henderson R, Swann J, Greenbaum JA, Kim Y, Sidney J, James EA, Taplitz R, McKinney DM, Kwok WW, Grey H, Sallusto F, Peters B and Sette A. Memory T cells in latent Mycobacteri-um tuberculosis infection are directed against three antigenic islands and largely contained in a CXCR3+CCR6+ Th1 subset. PLoS Pathog 2013; 9: e1003130.
[14] Corrigan CJ, Wang W, Meng Q, Fang C, Wu H, Reay V, Lv Z, Fan Y, An Y, Wang YH, Liu YJ, Lee TH and Ying S. T-helper cell type 2 (Th2) mem-ory T cell-potentiating cytokine IL-25 has the potential to promote angiogenesis in asthma. Proc Natl Acad Sci U S A 2011; 108: 1579-1584.
[15] Robinson DS, Bentley AM, Hartnell A, Kay AB and Durham SR. Activated memory T helper
cells in bronchoalveolar lavage fluid from pa -tients with atopic asthma: relation to asthma symptoms, lung function, and bronchial re-sponsiveness. Thorax 1993; 48: 26-32. [16] Myou S, Leff AR, Myo S, Boetticher E, Tong J,
Meliton AY, Liu J, Munoz NM and Zhu X.
Block-ade of inflammation and airway hyperrespon -siveness in immune-sensitized mice by domi-nant-negative phosphoinositide 3-kinase-TAT. J Exp Med 2003; 198: 1573-1582.
[17] Wherry EJ and Ahmed R. Memory CD8 T-cell differentiation during viral infection. J Virol 2004; 78: 5535-5545.
[18] Mackenzie KJ, Nowakowska DJ, Leech MD, McFarlane AJ, Wilson C, Fitch PM, O’Connor RA, Howie SE, Schwarze J and Anderton SM. Effector and central memory T helper 2 cells respond differently to peptide immunotherapy. Proc Natl Acad Sci U S A 2014; 111: E784-793.
[19] Pastva AM, Mukherjee S, Giamberardino C, Hsia B, Lo B, Sempowski GD and Wright JR. Lung effector memory and activated CD4+ T cells display enhanced proliferation in
surfac-tant protein A-deficient mice during allergen-mediated inflammation. J Immunol 2011; 186:
2842-2849.
[20] Lee N, You S, Shin MS, Lee WW, Kang KS, Kim SH, Kim WU, Homer RJ, Kang MJ, Montgomery RR, Dela Cruz CS, Shaw AC, Lee PJ, Chupp GL, Hwang D and Kang I. IL-6 receptor alpha
de-fines effector memory CD8+ T cells producing
Th2 cytokines and expanding in asthma. Am J Respir Crit Care Med 2014; 190: 1383-1394. [21] Taylor JJ and Jenkins MK. CD4+ memory T cell
survival. Curr Opin Immunol 2011; 23: 319-323.
[22] Zhang Q and Lakkis FG. Memory T cell Migra-tion. Front Immunol 2015; 6: 504.
[23] Masopust D, Choo D, Vezys V, Wherry EJ, Du-raiswamy J, Akondy R, Wang J, Casey KA, Bar-ber DL, Kawamura KS, Fraser KA, Webby RJ, Brinkmann V, Butcher EC, Newell KA and Ahmed R. Dynamic T cell migration program provides resident memory within intestinal epi-thelium. J Exp Med 2010; 207: 553-564. [24] Epstein MM. Targeting memory Th2 cells for
the treatment of allergic asthma. Pharmacol Ther 2006; 109: 107-136.