Abstract— Diverse techniques have been developed with a focus on dimension reduction, especially in Artificial Neural Network (ANN). This focus becomes a very important factor because the training process can become very complex and demand a lot of hardware resources. Based on the same focus, this research proposes a new algorithm to enable us to reduce the number of variables to handle ANN. A new procedure to extract important characteristics from the data is applied based on non-parametric characteristics. The data in this research was obtained from a wind power machine through accelerometer sensors and processed using LPC/Cepstrum Coefficients procedure. The complete detail of the implementation and results are explained. As a final result, the amount of data to process has been reduced. The number of variables for the Artificial Neural Network are reduced to only six variables. A successful result in the implementation of the algorithm was obtained with a very low percentage of missed classification error.
Index Terms— Dimension reduction, Artificial Neural Networks (ANN), pattern recognition, LPC/Cepstrum Coefficients, failure diagnostic.
I. INTRODUCTION
hese days the importance to implement more efficient pattern recognition techniques is taking a critical importance in various fields as face recognition, voice recognition, image recognition, and signal recognition overall. Most of the times this implementation requires to analyze a big volume of data whence consume a lot of resources; thus, it is important to reduce the number of data to be analyzed without loss of information.
With that purpose, many research projects have been proven with excellent results; however, given the big challenges in the data information process, especially referent to signal analysis and diagnosis systems, it is necessary to improve the
Manuscript received January 08, 2013; revised January 23, 2013. This research was supported by Basic Science Research Program through the National Research Foundation of Korea(NRF) funded by the Ministry of Education, Science and Technology(2012032927).
M. M. Chamay is with Department of Industrial and Management Engineering, Kyung Hee University, Gyeonggi-do, 446-701, South Korea (e-mail: [email protected]).
Y. Kim is with Department of Industrial and Management Engineering, Kyung Hee University, Gyeonggi-do, 446-701, South Korea. (corresponding author to provide phone: +82-31-201-2901; e-mail: [email protected]).
S. Oh is with Department of Industrial and Management Engineering, Kyung Hee University, Gyeonggi-do, 446-701, South Korea, (e-mail: [email protected]).
methodologies on purpose to detect complex failures in the early status. To do so, it is necessary to remove data with less useful information; hence, this necessity is our research goal. This research was developed using very accurate techniques related with the data extraction features joined with statistical techniques and also Artificial Neural Networks (ANN). The total combinations of these techniques enliven the research.
Diverse techniques for pattern recognition using ANN have been developed using several kind of training methods. Among these techniques, this research employs update in the neural parameters as weight and bias values using Levenberg-Marquard optimization as training ANN algorithm.
In terms of the Dimension reduction as the main goal of this paper, various techniques had been implement as Hierarchical nonlinear PCA, Additive Auto-Associative Models and Neural Networks, and nonlinear dimensionality reduction techniques on the purpose to reduce the ANN complexity[1]. Many of those studies are based on the extraction of statistical features from the data, and in several cases, it is necessary to assume the normal behavior of the data; however, in signal processing, it is not possible to always assume the normal distribution of the data. Based on that condition, this research is based on firstly in non-parametric data characteristics extraction. After many experiments, six characteristics were selected based on the importance of information that can be represented through these characteristics and their simplicity. Gini coefficients, a measure of statistical dispersion, was employed as a parametric measure in the dimension reduction procedure. Based on this coefficients and median, maximum and minimum values of the data reduced the volume of information to process and the number of variables to use in the ANN. These characteristics were analyzed and determined through a very careful procedure; the complete detail of this procedure is described below. The second important point in this research is the methodology utilized to choose the samples and the size of the samples taken from the data.
The training data used in the research was obtained using LPC/Cepstrum Coefficients procedure. Cepstrum is suitable for detecting periodic effects in the logarithmic spectrum, like families of harmonics, sidebands or echoes [2].
Several studies have been realized based on LPC/Cepstrum coefficients and it has been proven that it is possible to apply LPC technique and Cepstrum analysis to diagnose the status of the system in different fields.
Development of Dimension Reduction
Algorithm in Diagnostic System with Artificial
Neural Network
Monica M. Chamay, Se-do Oh, and Young-Jin Kim
The full description about the methodology and the research results are explained in the content of this paper, focusing especially on the reduction and optimization of the extracted data features at the end to provide the required diagnosis. In the respective order, the article is structured as follows: First a briefly description referent of the methodologies that were used in our research. This section is followed by a detailed description of the experiment, the research methods and procedures used in the study. The results and advantages are discussed. Finally, implications, limitations, and directions for future research are offered.
II. METHODS AND TECHNIQUES DESCRIPTION A. Back propagation Artificial Neural Networks and Pattern Recognition
Artificial Neural Networks (ANN) are widely known these days and used in many fields as signal processing, pattern recognition, medicine, and business. Basically, an ANN simulates the behavior of the biological ANN, given they have been developed as generalizations of mathematical models of Neural Biology [3]. In the last years, the use of those techniques had been increasing given the multiple benefits that are possible to reach and the simplicity of implementation.
In the case of supervised training ANNs algorithms, back propagation algorithm using Minimun Gradient Reached training method was used in this research.
Referent to pattern recognition, ANN have become a powerful tool to identify the different patterns in different type of fields and environments as signal detection [4] [5]; in diagnostics field, it is also possible to identify the different system statuses according specific circumstances as in [6] [7] where back propagation ANNs are used. In our research, back-propagation networks are used to classify the system failures of wind power machine taken in account previous work research related with it [8]. Multilayer Perceptron is used as a neural classifier, the number of input neurons is given by number features and the number of output neurons is defined by the number of classes [9].
B. LPC/Cepstrum Coefficients
LPC is based on the linear model of speech production. It is one of the most powerful speech analysis techniques, and one of the most useful methods for encoding good quality speech at a low bit rate and provides extremely accurate estimates of speech parameters. Among the speech recognition approaches, the family based on Linear Predictive Coefficient and Cepstrum (LPC/Cepstrum) is prominent for its performances and its relative simplicity. LPC/Cepstrum models a time evolving signal as an ordered set of coefficients representing the signal spectral envelope. Various studies have been realized based on LPC/Cepstrum coefficients and it has been proven that it is possible to apply LPC technique and Cepstrum analysis to diagnose the status of the system in different fields. Some examples of its applications to power Cepstrum are in: seismic data process [10], fault detection [11, 13], speaker identification [12], software repositories to identify files with very similar
size histories [14], EOG feature parameters extraction based on LPC model, (EOG- effective eye movement recording method) [15], and finally, the use of LPC and accelerometer sensor data in automatic characterization and detection of behavioral Patterns [16]. These examples show us how LPC/Cepstrum can be a very powerful and effective tool in diagnostics. Using LPC, it is possible to extract an exact pattern based on the principal characteristics of data. The power spectrum in the logarithmic scale shows many more peaks compared to the linear scale, where only the main harmonics dominate. The Cepstrum shows the harmonics with their periods in small amplitudes better than the frequency analysis.
In the case of periodic signals y(t), the power Cepstrum is defined as the inverse Fourier transform of the logarithm of the power spectrum of the signal y(t) in eq. 1,
d e P i t
log ( )
2 1 } ) {logP( ) (
Cyy -1 (1)
Where -1
represents the inverse Fourier Transform of the term in brackets (likewise -1
would represent a forward Fourier Transform). The independent variable , has the dimensions of time (it is similar to the time delay variable of the auto-correlation function) and it is referred to in the literature as ‘quefrency’. The logarithm of the transfer function is written as below,) ( ) ( C H(z) ln 1
n n nz C z Cz (2)
where z is the usual z-transform variable. The desired relationship between cn’s and an’s is given by [17].`
c1a1
n-1 1
k k
n (1-k/n)a
c cn k an 1np
n-1 1
k k
n (1-k/n)a
c cn k np (3)
Sometimes, the power Cepstrum is defined as the square of the modulus of the forward Fourier Transform of the logarithm of the power spectrum of a signal, instead of the inverse Fourier Transform.
C. Dimension Reduction extracting Non Parametric features
reduction.
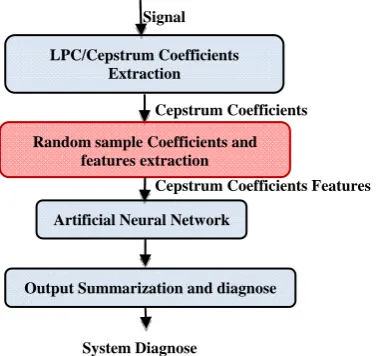
[image:3.595.320.556.54.161.2]To implement dimension reduction, it was necessary to determine the manner to reduce the data dimensions, and also to obtain an accurate diagnostic. To successfully reach a dimension reduction, this research proposes a new dimension reduction algorithm. Fig 1 visualizes the general procedure involved in the implementation of this algorithm. The implementation of each phase of the procedure will be explained in the sections below, with an emphasis in features extraction because this step is the core of the dimension reduction algorithm.
Fig 1 Diagnostic Algorithm
The feature extraction was fulfilled through the extraction of non-parametric characteristics of the data.
III. EXPERIMENT RESULTS AND DISCUSSIONS A. Experiment environment
In this research, data from wind power machine was obtained. The data was basically gained through 5 different statuses of the system, four failure status and normal status. A certain number of samples were collected on purpose to be used in training process and validation process respectively. The respective illustration referent to each system failures is in Table I.
The data was obtained using four accelerometer sensors located as in the Fig 2.
Fig 2 Wind Power Machine diagram
In the Table II and Table III the explanation about the sensor positions and the diagram parts is shown.
At the starting point with the purpose to train the ANN, data samples for each system status were selected and also another data samples for the validation phase.
B. LPC/Cepstrum coefficients Extraction
The gained data from the sensors was stored in text files and passed through processes on purpose to gain the respective system diagnosis. The algorithm implementation was fulfilled through two phases: the training phase and the validation phase. In the implementation, Matlab program was used as a develop tool. The LPC/Cepstrum Coefficients extraction is conformed for the steps shown in the Fig 3. The data samples were selected from the wind power machine. For each sample data, we extracted several coefficients. The number of coefficients is inversely proportional to the window size. In general the samples previously selected were passed through LPC/Cepstrum process and these coefficients were obtained. Fig 4 illustrates this procedure.
As a result of this step, we obtained a set of data Cepstrum Coefficients corresponding to the signal that we are analyzing. This information will be the source for the next step in the implementation of the dimension reduction algorithm.
TABLEIII SENSORS POSITION
Element Description
S1 The top of the blade bearing
S2 The top of the slow axis, the central bearing S3 Reducer low speed shaft bearing side S4 Reducer high speed shaft bearing side
TABLEII
WIND POWER MACHINE ELEMENTS
Element Description
A Hub
B Main Bearing
C Main Shaft
D Gearbox
E Brake
F Generator Shaft
G Generator
H Bed Plate
Signal
Cepstrum Coefficients
Cepstrum Coefficients Features LPC/Cepstrum Coefficients
Extraction
Random sample Coefficients and features extraction
Artificial Neural Network
Output Summarization and diagnose
System Diagnose
G
H D B
F
S2 A
C
E
S1
S3
S4
TABLEI
FAILURE EXPERIMENT SYSTEM
Failure Description Quantity of experiments
N Normal State 150
F1 High-speed axis misalignment
150
F2 Blade shaft bearing damage
150
F3 Blade bearings, inner bearing damage
150
F4 The inner bearing damage
[image:3.595.90.279.201.379.2] [image:3.595.58.284.580.707.2]Fig 3 Cepstrum Coefficients Extraction Procedure
Fig 4 Cepstrum Coefficients General Procedure
C. Random Sample Coefficients and feature extraction Even though the Cepstrum coefficients extraction gave us advantage to extract very important data features, however it is not possible to distinguish easily the status of the system and the number of variables to handle is lengthy to perform in ANNs. The complexity of Cepstrum Coefficients does not allow us to train any ANNs, the misclassification error was around 45% and also the training time was very long and a memory resource problem was faced. To overcome these difficulties, the implementation of a special feature extraction characteristics procedure was applied.
[image:4.595.48.276.174.298.2]This procedure is the most important contribution of this research. In the Fig 5 the steps of the procedure are shown and the explanation about each one of the steps is below.
Fig 5 Features Extraction Procedure
Determine the Random Sample Size
It is called Random because Cepstrum coefficients are randomly chosen, the median of the sample is calculated, and based on the calculation, sample size of the data is determined. In the research, 20 random samples of data sample were extracted. The Fig 6 shows an example about this procedure. RS means random sample.
Fig 6 Random samples Coefficients Extraction Procedure
Features Extraction
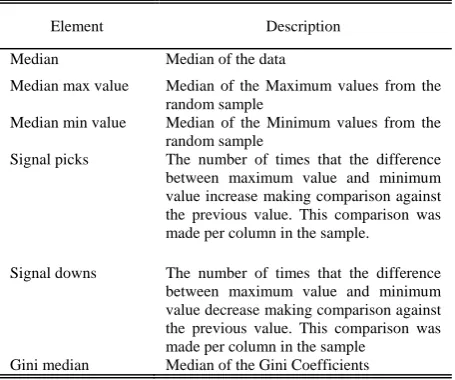
The basic idea is, after extracting various random samples from each group of Cepstrum coefficients, extract six features on the purpose to use these to train the ANN. The Table IV shows the explanation. Focused in the needs to extract the most significant characteristics, in this research six features were selected based on their importance. The data is analyzed through these six features taking into account several factors.
Median
In many cases the signal has outlier or very small values in it and these values can deviate the true value of the Mean; to overcome this problem in this research the median is used as a non-parametric characteristic of the data. It can give us a very certain measurement of the values in the data. The median of the sorted sequence (p0, . . . p2K-1) is defined as
the arithmetic mean of the two middle values [22] (4) )/2 p (p ) p . . . , p , p , . . . . ,
median(p 0 k-1 k 2k-1 k-1 k (4) Median Max Value and Median Min Value
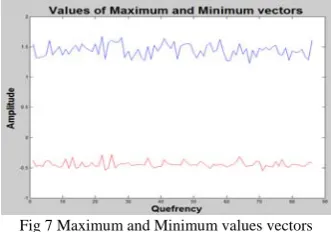
[image:4.595.57.281.504.676.2]Maximum and minimum values are also extracted from the data set. Even if some data sets have the same median in an interval, is possible to have different behavior of the data. For that reason maximum and minimum values were extracted. On the purpose to discover the maximum and minimum values, two different vectors were extracted, one with the maximum values and the other one with the minimum values in the data set. The median of each one of these vectors is used as one of characteristics in this research. In Fig 7 an example of the maximum and minimum vector values is shown.
Fig 7 Maximum and Minimum values vectors
Signal Picks and Downs
Another important characteristic is the number of times the signal increase or decrease. This information corresponds to the picks and downs of the signal extracted for each random sample.
Fault 1 Fault 2 Fault 3 Fault 4 Normal
LPC/Cepstrum Coefficients Extraction Cepstrum Coefficients
Signal Pre-emphasis filter Normalization
Hamming Window FFT
Logarithm
IFFT
Cepstrum Coefficients
Determine random sample size
Matrix of Random Samples Features
Median Gini Median
How many times the value increase
How many times the value decrease
Each one of the random sample
Median of the maximun values
Features extraction per random sample
Median of the minimun values
RS4 RS5
RS7 RS2 RS3
RS1
[image:4.595.347.513.595.711.2]Ginni Median
Moreover in a set of data is necessary to measure the dispersion of the data because that can also give us unique information about the data behavior. As a non-parametric measure of the data dispersion the Gini coefficient is calculated [23]. Gini is a measure of dispersion within a group of values [24]. Once gained, the median of them is obtained and used as a characteristic in this research. Artificial Neural Network Training
Using the features extracted in the previous procedure, the ANN was trained successful on the purpose to diagnose the system status. In the implementation, a back propagation ANN was trained using Minimum Gradient Reached algorithm. The Network has 10 hidden layers. In the Fig 8, it is possible to visualize the training graphic. The best validation performance is 5.565e-13 at epoch 29. The training Ratio was 0.7, and the Validation Ratio 0.3.
[image:5.595.37.265.200.390.2]
Fig 8 Validation Performance ANN
Output Summarization and diagnose
In the previous steps a set of samples were collected, characteristics were extracted and passed through the ANN. For each sample, it was possible to obtain a diagnostic. In this last step, the results are summarized, and depending on this result, it is possible to diagnose the system status according to what is the highest result diagnostic obtained from the samples.
IV. DISCUSSION AND FUTURE WORKS
Given the importance of the dimension reduction in the field of ANNs and its usefulness in pattern recognition field, specially focused in diagnosis field, this dimension reduction algorithm is developed.
A. Summary of results
A new algorithm is developed based on two important elements: Gini coefficients and the extractions of very significant signal characteristics. Through this procedure, it was possible to train an ANN. In the process to determine which characteristics could be useful to train the ANN, other characteristics were extracted; however, through a procedure of characteristics selection, a final set of them was obtained. These characteristics were selected based on the results that we gained in the ANN training phase. Finally, after the training process, it was possible to summarize the results and diagnose the system status. This procedure made us able to reduce the amount of data and the number of variables to handle until only six variables and achieve a very low percent of misclassification error. B. General Implications
Our research reached a very significant dimension reduction result. The proposed characteristics were extracted; consequently, the training of ANN became faster and once it was trained, it is possible to acquire accurate results. This algorithm provides strong support for dimension reduction in wind power machine and signal analysis field related to fault diagnostic.
REFERENCES
[1] A. Gorban, B. Kegl, DD. Wunsch and A. Zinovyev, Principal Manifolds for Data Visualization and Dimension Reduction. Springer, Berlin Heidelberg New York, (2008), 22-29,48-49.
[2] R. Isermann, Fault-diagnosis systems: an introduction from fault detection to fault tolerance, Springer, Germany (2006) 128-129. [3] G. O. Young, “Synthetic structure of industrial plastics (Book style
with paper title and editor),” in Plastics, 2nd ed. vol. 3, J. Peters, Ed. New York: McGraw-Hill, 1964, pp. 15–64.
[4] L. Fausett, Fundamentals of Neural Networks. Prentice-Hall, 1994, pp. 3.
[5] A. Abedy, Signal detection in passive wireless sensor networks based on back-propagation neural networks. IET Wireless Sensor Systems, IEEE, 2011.
[6] J. Jiang, J. Zang, G. Yang, D. Zhang and L. Zhang, Application of back propagation Neural network in the classification of high resolution remote sensing image, Geoinformatics, 2010 18th
International Conference, 2010.
[7] H.B. Zheng, R.J. Liao, S. Grzybowsky and L. J. Yang, Fault diagnosis of power transformers using multi-class least square support vector machines classifiers with particle swarm optimization, IEEE IET Electric Power Applications, 2010.
[8] P. Lall, Decorrelated feuature space and Neural nets based framework for failure modes clustering in Electronics subjected to mechanical shock. IEEE Transactions on Reliability, 2012.
[9] X. An, D. Jian and S. Li, Application of Back Propagation Neural Network to Fault Diagnosis of Direct-Drive Wind Turbine. World Non-Grid-Connected Wind Power and Energy Conference (WNWEC). 2010.
[10] I. Alvarez, G. Cortes, A. de la Torre, C. Benitez, L. Garcia, P. Lesage, R. Arambula, M. Gonzalez, Improving Feature Extraction in the automatic classification of seismic events. Application to Colima and Arenal volcanoes, Proc. of Geoscience an Remote Sensing Symposium, 2009 IEEE international, volume 4, (2009) IV-526-IV529.
[11] S. Ai, H. Li, Application of Order Cepstrum and Neural Network to Gear Fault Detection, IMACS multiconference on Computational Engineering in Systems Applications (CESA), Beijing China (2006) 1823-1824.
[12] K. Gopalan, T.R. Anderson and E.J. Cupples, A comparison of speaker identification results using features based on Cepstrum and TABLEIV
SAMPLE FEATURE CHARACTERISTICS
Element Description
Median Median of the data
Median max value Median of the Maximum values from the random sample
Median min value Median of the Minimum values from the random sample
Signal picks The number of times that the difference between maximum value and minimum value increase making comparison against the previous value. This comparison was made per column in the sample.
Signal downs The number of times that the difference between maximum value and minimum value decrease making comparison against the previous value. This comparison was made per column in the sample
Fourier-Bessel expansion. Proc. of Journal speech and audio Processing, Volume 7, USA (1999) 289-294.
[13] P. Jun, Y. Guo-Hua, W. Xuan, T. Jing, Y. Yong-gang. Gear fault detection with Wigner-Viller distribution based Cepstrum approach,
Proc. of Computer Engineering and Technology (ICCET), 2010 2nd
International Conference, IEEE, (2010) V1-500-V1-502.
[14] G. Antoniol, V. F. Rollo, G. Ventury. Linear predictive coding and Cepstrum coefficients for mining time variant information from software repositories, Proc. ofJornal Paper ACM Sigsoft software Engineering Notes, Vol. 30, no. 4, Missouri, USA (2005) 1-5. [15] Z. Lv, X. Wu, M. Li, A Research on EOG Feature Parameters
Extraction Based on Linear Predictive Coding Model, International Conference IEEE, Bioinformatics and Biomedical Engineering, USA (2009) 1-4.
[16] C. Min and A. H. Tewfik, Automatic Characterization and detection of Behavioral Patterns Using Linear Predictive Coding of Accelerometer Sensor Data, Proc. of32nd Annual International Conference of the
IEEE EMBS, Buenos Aires, Argentina (2010) 220-223.
[17] B. S. Atal, Automatic Recognition of Speakers from Their Voices,
Proc. of IEEE, (1976) vol. 64, 460-475.
[18] G.A. Licciardi, Pixel unmixing in Hiperspectral data by means of Neural Networks. IEEE Transactions on Geoscience and remote sensing. 2011.
[19] K. Suzuki, Massive-Training Artificial Neural Network Coupled with Laplacian-Eingenfunction-Based Dimensionality Reduction for Computer-Aided Detection of Polyps in CT Colonography. IEEE Transactions on Medical Imaging, 2010.
[20] Y. Huang, D. Xu and F Nie, Semi-Supervised Dimension Reduction using Trace Ratio Criterion. IEEE transactions on Neural Networks and Learning Systems. 2012.
[21] F. J. Theis, M. Kawanabe and K Muller, Uniqueness of Non-Gausianity-Based dimension Reduction, IEEE Transactions on signal processing, 2011.
[22] W. Burger and M. Burger, Digital Image Processing and Algorithmic Introduction using Java, (2008), 177.
[23] G. Gastineau and M. Kritzman. Dictionary of Financial Risk management, Wiley (1992),153.
[24] J. Han and M. Kamber. Data Mining: Concepts and Techniques.