An Energy-Aware Workload Dispatching
Simulator for Heterogeneous Clusters
Miau-Ru Dai, Cheng-Jen Tang, and Chi-Cheng Chuang,
Abstract—This paper presents an energy-aware workload dispatching simulator for heterogeneous clusters. Most clusters in a data center are composed of different kind of machines. Among these machines, the front-end nodes distribute incoming requests to the back-end workers. The main concern in such system traditionally focuses on computation performance, but energy consumption has emerged as an equally important issue recently. This work designs a workload dispatching simulator that is capable of identifying the energy usage of a heteroge-neous cluster. The main target of the proposed simulator is to find out how a workload dispatching algorithm affects the energy consumption. The simulator consists of a configurable traffic generator, a workload dispatcher, and a set of server nodes. The traffic generator randomly produces workloads that are constrained by the average job number, and the average job size. The workload dispatcher assigns jobs according to some popular workload dispatching algorithms. Each server node can report its ID, idle power consumption, maximum power consumption, and computing capability. A set of records collected from a real heterogeneous cluster is examined using this simulator. The goal of this work is to develop a simulator that assists data center managers to estimate the availability, service quality, and energy consumption of their heterogeneous computation resources.
Index Terms—Heterogeneous Clusters, Workload Dispatch-ing, Energy-Aware Simulation.
I. INTRODUCTION
A
Cluster hosting Web applications contains many dif-ferent types of hardware devices over the course of its construction. Sever nodes in such cluster have different energy consumption patterns and computation capabilities. The workload of an Internet data center is highly dynamic [1], [2], [3]. It is necessary to have a sophisticated workload distributor to assign jobs at any given time to maintain the required service quality. Such distributors dynamically dis-patch user requests upon their arrival. In a highly fluctuated environment, the dispatching policy becomes a key issue for the overall performance of a cluster.Managing energy cost is crucial for Internet service providers to make profit. Prior studies [4], [5] often use energy usage minimization as the optimal solutions. Such approaches work well for the flat rate electricity tariffs. However, recent emergency of Smart Grid and the promotion of time-based electricity pricing [6] complicate the situation. A time-based electricity pricing scheme, such as Time-Of-Use (TOU) rate, has a higher rate during peak periods, and
Manuscript accepted January 18, 2013; Camera Ready submitted January 27, 2013.
M.-R. Dai is a Ph.D. candidate in the Graduate Institute of Com-munication Engineering at Tatung University, Taipei, 104 Taiwan e-mail: [email protected].
C.-J. Tang is with the Department of Electrical Engineering, Tatung University, Taipei, 104 Taiwan e-mail: [email protected].
C.-C. Chuang is with Smart Network System Institute, Institute for Information Industry, Taipei, 105 Taiwan e-mail: [email protected]
a lower rate during off-peak periods. Minimizing energy usage does not always translate into the lowest energy cost when a time-based tariff is adopted. A profit-driven service provider requires an energy-aware tool to implement suitable power management. A simulator is necessary for the highly dynamic Internet environment.
This paper presents an energy-aware workload dispatching simulator that assists data center administrators capturing the probable energy usage profiles with various dispatching algorithms and workload patterns. The simulator imitates the behavior of real-world workload dispatching to a het-erogeneous cluster. A model is built to represent the key characteristics of a heterogeneous cluster. A set of emulated workloads based on real-world traffic traces is used to test this simulator. The result shows that the simulator produces a power usage profile that is very similar to the real-world data.
II. RELATEDWORK
There are many energy-aware workload dispatching al-gorithms for cluster-based web servers. Few attempts are pursued to examine these algorithms. The proposed simulator helps to fill this void. This section briefs some energy-aware workload dispatching algorithms.
Pinheiro et al.[7] propose an energy-conscious switch-ing technique that adjusts on-power capacity at the coarse granularity of cluster-based server systems. This technique enables an economic framework for dynamic server resource allocation that allows informed trade-offs of service quality during shortages. Their system dynamically turns cluster nodes on when it is needed for handling heavy workloads, and off when the workload is lighter. Their approach is one of the first studies that explore the energy related issues on cluster-based systems. However, their algorithm assumes the targeted cluster comprised of homogeneous machines. In a homogeneous cluster, using round-robin to dispatch workload is a rational choice, since each machine has the same capability for solving problems, and the same power consumption profile.
A Web server that is implemented based on their model achieves 42% energy savings on a small cluster.
Chen et al.[3] find that the major cause of energy inef-ficiency in data centers is the idle power. A server node consumes over 50% of the peak power even running at only 10% of CPU utilization. They propose a dynamic server provisioning technique. Their approach automatically provisions resources in data centers by taking energy savings and application performance into account. This technique employs ON/OFF control strategies aiming at energy saving with desired performance levels. In their approach, each node is limited with the maximum login rate and the maximum number of connections. Their work uses load-balancing as the workload dispatching algorithm.
Abbasi et al.[9]propose a two-tier management mecha-nism for Internet data centers. They assume that computing power aware server provisioning may not always be effective or sufficient with modern servers because of the cooling-computing power trade-off. Their reason is that consolidat-ing the workload on fewer servers tends to decrease the computing power (since modern servers are not energy-proportional), but the consolidated servers may create hot spots that typically demand greater cooling power. In some cases, the cooling power increase may outweigh the com-puting power decrease. The occurrence ofcooling-computing power trade-off depends on many factors such as regional climate type, number and type of server nodes, size of data center, etc.
Until recently, it remains a difficult problem to manage power for heterogeneous clusters [10]. The current energy management for heterogeneous clusters is either node addi-tion/removal(or ON/OFF control) or workload dispatching. For ON/OFF control, an energy management mechanism needs to decide not only how many but also which server nodes should be turned on. This approach is also needs to have the information of workload and server characteristics. For energy-efficient workload dispatching, existing studies usually consider homogeneous clusters only. Identifying the optimal workload dispatching for a heterogeneous cluster remains a task for further exploring [10].
III. MODELINGHETEROGENEOUSCLUSTERS
Most data centers use commercially off-the-shelf products as server machines. It is very common that recently pur-chased servers co-work with some older and workable ones in a cluster. Therefore, heterogeneity is inevitable in such environment.
A heterogeneous cluster is regarded as a collection of server nodes where the number of their types is greater than or equals to two. This work assumes each server node is capable of point-to-point communicating with the workload dispatcher. The workload dispatcher in a cluster is the front-end node to Internet. In the simulation environment, as shown in Fig. 1, Internet messages are simulated using a traffic generator.
A. Traffic Generator
[image:2.595.320.533.89.320.2]The targeted simulator employs a traffic generator to simulate work requests from users. The algorithm of traffic generating is shown in Fig. 2.
Fig. 1. Model of a Heterogeneous Cluster
1: Traffic Generator (R){
1≥R≥0;
Generate a job queueQto make the targeted cluster with utilization rate R.}
2: empty Q
3: N ←RAN D(0, Nmax){ N is the size ofQ.
Nmax is the maximally possible queue size.
RAN Dis a uniformly distributed random number gen-erator that generates a random values the two given arguments.}
4: fori= 1 toN do
5: x←RAN D(0, Xmax){ xis a random number.
Xmax is a predefined value representing the
maxi-mally possible value ofx.}
6: if Xx
max ≤R then
7: J ←RAN D(0, Jmax){
J is a random real number representing the com-puting capability required by a job.
Jmax is a predefined value representing the
maxi-mally possible computing capability of a job.}
8: push J into Q
9: end if 10: end for 11: return Q
This traffic generator requires an input value R repre-senting the expected server utilization rate. R is the server utilization rate when the workloads are randomly dispatched to the back-end worker nodes. A job queueQis produced by this traffic generator. Each job is represented as the required computing capabilityfor finishing this job. Theunity of the computing capability is defined as thecomputing capability required for the reference server node to finish a job in a unit processing time, e.g. one second.
The size N of the job queue Q is randomly generated using a uniformly distributed random number generatorRu. N is ranging from 0 to the maximally possible queue size
Nmax. For each job slot in Q, the following procedure is
executed to determine whether to push a job assignment into
Qor not.
1) A random numberxis generated usingRu.
2) xis ranging from0to a predefined valueXmax, where Xmax>0.
3) Whether(Xx
max ≤R)is checked.
4) If the result istrue, a job assignment is performed as the follows.
5) A randomly generated job J is ranging from0 to the maximumly possiblecomputing capability Jmax.
6) J is pushed intoQ.
Suppose the sum of the computing capability of each server node is S. Nmax and Jmax are constrained by the
Eq. (1). That is, the product of the expected values ofN and
J shall not be greater than the maximally possiblecomputing capability.
S≥E(N)×E(J) (1) B. Workload Dispatcher
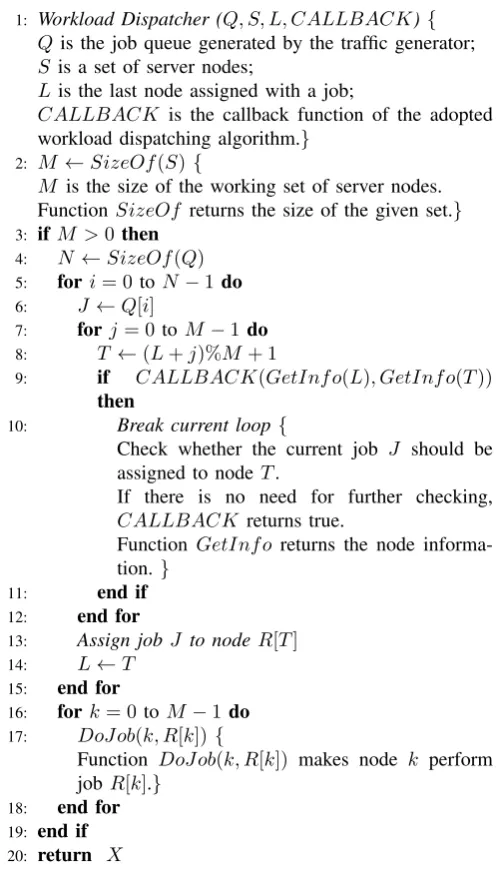
The workload dispatcher retrieves a job from the job queueQ, and assigns it to a node according to the adopted algorithm. The pseudo code of the workload dispatcher is shown in Fig. 3.
This workload dispatcher takes 4 arguments that are the job queue Q, the server node set S, the last enabled node
L, and the callback function CALLBACK of the selected workload dispatching algorithm. The job queue Q is gen-erated by the traffic generator, as described in the previous section. The server node arrayRcontains all the active nodes in the simulated cluster. This array is initialized and defined by the simulator.Lrepresents the server node that is assigned with a job by this workload dispatcher. L is initialized with 0, if there is no prior assignment. Using the callback function makes the workload dispatching algorithm can be dynamically invoked. This work implements 12 dispatch-ing algorithms includdispatch-ing Round-Robin(RR), Random(RND), Least Utilization First (or Load Balanced)(LUF), Least Power First(LPF), Least Delay First(LDF), Least Pending Tasks First(LPTF), Least Power-to-Utilization First(LPUF), Least Power-to-Task First (or Least Power-to-Throughput First)(LP2TF), Least Time-to-Task First(LTTF), Least Delay-to-Task First(LDTF), Least Utilization-Delay-to-Task First(LUTF), and Least Pending-Task-to-Task First(LP3TF). GetInf o() returns the following information of the given node:
1) Identity of the node 2) Consumed energy
1: Workload Dispatcher (Q, S, L, CALLBACK){
Qis the job queue generated by the traffic generator;
S is a set of server nodes;
L is the last node assigned with a job;
CALLBACK is the callback function of the adopted workload dispatching algorithm.}
2: M ←SizeOf(S){
M is the size of the working set of server nodes. Function SizeOf returns the size of the given set.}
3: if M >0then
4: N ←SizeOf(Q)
5: fori= 0 toN−1do
6: J ←Q[i]
7: forj= 0 toM −1 do
8: T ←(L+j)%M+ 1
9: if CALLBACK(GetInf o(L), GetInf o(T)) then
10: Break current loop{
Check whether the current job J should be assigned to nodeT.
If there is no need for further checking,
CALLBACK returns true.
Function GetInf o returns the node informa-tion.}
11: end if
12: end for
13: Assign jobJ to node R[T]
14: L←T
15: end for
16: fork= 0 toM−1 do
17: DoJ ob(k, R[k]){
Function DoJ ob(k, R[k]) makes node k perform jobR[k].}
[image:3.595.302.551.48.485.2]18: end for 19: end if 20: return X
Fig. 3. Pseudo Code of Workload Dispatcher
3) CPU utilization
4) Power to CPU utilization ratio 5) Number of pending tasks 6) Average latency
7) Consumed computing power 8) Number of finished tasks
CALLBACK examines this information to find out a suitable candidate to process an incoming job.
C. Server Node
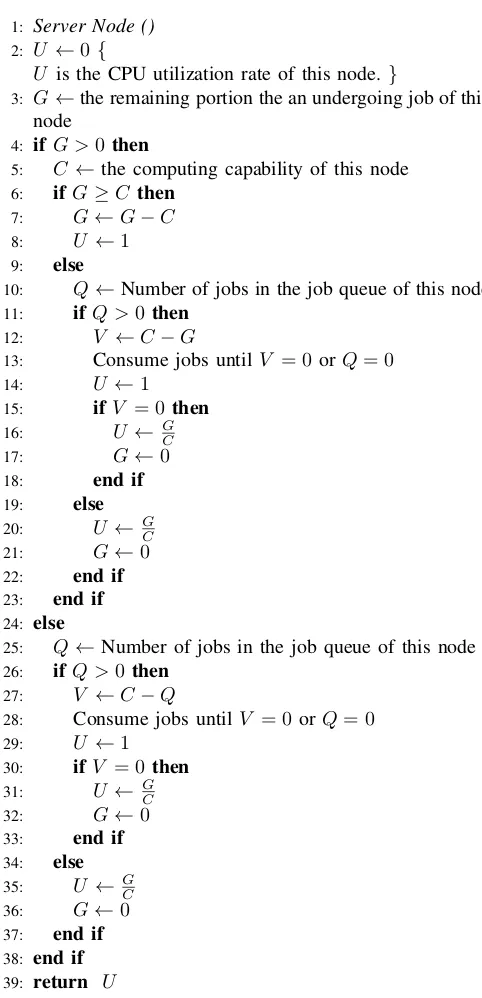
In a server computer, CPU utilization is often consid-ered as the major indicator of power consumption. Other components in a server computer are driven by instructions issued by the CPUs. Vasan et al. [11] find that a linear model for power consumption based on CPU utilization works effectively across a variety of servers. Based on their findings, this work assumes the power consumption model of a sever node as:
1: Server Node ()
2: U ←0{
U is the CPU utilization rate of this node.}
3: G←the remaining portion the an undergoing job of this node
4: ifG >0then
5: C← the computing capability of this node
6: ifG≥C then
7: G←G−C
8: U ←1
9: else
10: Q←Number of jobs in the job queue of this node
11: if Q >0then
12: V ←C−G
13: Consume jobs until V = 0 orQ= 0
14: U ←1
15: if V = 0then
16: U ← GC
17: G←0
18: end if
19: else
20: U ← G
C
21: G←0
22: end if
23: end if
24: else
25: Q←Number of jobs in the job queue of this node
26: ifQ >0then
27: V ←C−Q
28: Consume jobs until V = 0 orQ= 0
29: U ←1
30: if V = 0 then
31: U ← GC
32: G←0
33: end if 34: else
35: U ← G
C
36: G←0
37: end if
38: end if
[image:4.595.47.288.44.543.2]39: return U
Fig. 4. Process of a Server Node
In Eq. (2),P(t)is the power consumption of a server node at time t. Pidle is the power consumption of a node when
its CPU utilization is 0%. Pdynamic represents the power
dynamic range, which is the difference between the power consumption at utilization rate0%and at 100%.U(t)is the CPU utilization rate of a server node at timet. With Eq. (2), the energy consumption of the server node during a period
t0 tot1 can be easily obtained byR
t1 t0 P(t)dt.
The role of a server node is to process the assigned jobs. Each server node has its own job queue. The workload dispatcher assigns a job to the job queue of the selected node as described in Fig.3. The process of a server node is illustrated in Fig. 4.
D. Computing Capability of a Server Node
In a heterogeneous cluster, some nodes have greater com-puting capability than others. To make the comparison and
1: Computing Capability ()
2: N um←Number of child processes to be forked.
3: Count←Number of loops to be processed.
4: P erf ←0
5: Start←Start time.
6: fori= 0 toN um−1 do
7: Fork a child process.
8: end for
9: if This is the parent processthen
10: foreach child processdo
11: Wait until the child process is ended.
12: end for
13: End←End time.
14: P erf ←End−Start 15: else
16: V ar←0
17: fori= 0 toCount−1 do
18: V ar←some calculations.
19: end for
20: Exit this child process.
21: end if
22: return P erf
Fig. 5. A Simple Multiprogramming Performance Tester
calculation intuitive, this work defines the term reference server node. Areference server nodeis the server node with theunity, which is1.0,computing capability. A server node of any type can be assigned as areference server node, even this node is not managed by the simulated cluster. Suppose a server node has the computing capability of2, this node can finish a job twice as quick as thereference server node. To calculate thecomputing capability, this study uses a similar process employed byLinux Benchmarksystem for obtaining BogoMIPS. The process is described in Fig. 5.
IV. REAL-WORLDDATA
This study uses the data recorded from a heterogeneous cluster to test the target simulator. This cluster consists of 40 computers that are 4 IBM X3200 M3 servers featuring one 2.53 GHz quad-core 8 threads Intel Xeon X3440 processor and 2 GB memory per server, 4 IBM X3550 M3 servers featuring two 2.40 GHz quad-core 8 threads Intel Xeon E5620 processor and 12 GB memory per server, 2 Tatung TSS 2520 Servers featuring two 2.40 GHz Xeon processors and 4GB memory per server, and 30 power-saving computers (ACER Veriton N260). Each power-saving computer runs with a dual-core 1.66GHz Intel ATOM N280 processor and 1 GB memory. All server nodes use Linux 2.6 as their operation system. Apache 2.2 and MySQL 5 are installed on each server node.
[image:4.595.306.515.48.318.2]Fig. 6. Power Consumption vs. CPU Utilization
TABLE I
POWERCONSUMPTIONCHARACTERISTICS OFSERVERNODES
P(t) =Pidle+Pdynamic∗U(t)
Node Type Idle Power Dynamic Range Computing Pidle Pdynamic Capability
IBM X3200 M3 63.723 W 10.47 W 12.61
IBM X3550 M3 93.867 W 88.035 W 31.62
Tatung TSS 2520 194.94 W 182.68 W 2.02
Acer Veriton N260 20.81 W 4.41 W 1.0
A. Power Consumption Patterns of Servers
In order to get the power consumption patterns based on the CPU utilization, this study uses sar (a Linux tool) to record the CPU activity. The interval parameter to sar is set to60 seconds. One machine of each type runssaras a daemon process to record its CPU utilization over the courses of this data gathering. Each of the machines that run sar
also connects to a Mastech 9803R Bench Digital Multimeter (DMM) for recording its power usage. Each DMM reports 4 records per minute to an external computer through an RS-232cable.
This study associates and synchronizes the recorded CPU utilization and the power usage information to get the cor-relation between CPU utilization and power consumption of each machine. This relationships of the measured machines are shown in Figure 6. The result validates the assumption given in Eq. (2). The performance tester is also executed on each test machine. The power consumption patterns and their computing capability of all types of nodes are shown in Table I. In this study, the ACER Veriton N260 is defined as thereference server node, which has the theunitycomputing capability.
B. Power consumption data of different periods
The collected data sets cover three periods.
1) Idle Period: The first period is during the winter break when the servers are almost always idle. This period is from time unit 1 to 2400.
2) Busy Period: The second period is the preparation period for the new semester when all the servers are busy at installing and upgrading the required software packages, serving requests from students, updating accounts and performing maintenance activities by staffs, and assisting teachers for preparing their course materials. During the second period, the servers usually have the highest utilization rate of a semester. This period is from time unit 2401 to 3840.
Fig. 7. Power Consumption of the Test Cluster
TABLE II
RMSEANDNRMSEOF THIS SIMULATION
Idle Busy Normal Overall
Period Period Period
vmax 2514.4 W 2535.8 W 2529.6 W 2535.8 W
vmin 1655.7 W 1656.1 W 1655.8 W 1655.7 W
RMSE 9.38 W 15.89 W 11.23 W 11.88 W
NRMSE 1.09% 1.83% 1.28% 1.35%
3) Normal Period: During the third period, the servers support the regular computation and web host services. This period is from time unit 3841 to 6802.
Fig. 7 shows the recorded power consumption data. The workload dispatching algorithm used in the test cluster is Round-Robin.
A simulation is conducted using the server utilization data gathered from the test cluster. This series of server utilization rates is fed into the simulator as the input to the traffic generator. The simulation result is shown in Fig. 8. To measure the differences between values obtained by the simulator and the values actually recorded, this study uses the root-mean-square error (RMSE) and normalized root-mean-square error (NRMSE). RMSE is defined as:
RM SE(ˆθ) =
q
E((ˆθ−θ)2), where θˆ is the simulated value, and θ is the recorded value. NRMSE is defined as:
N RM SE = v RM SE
max−vmin, where vmax and vmin are the
maximum value and the minimum value in the recorded data, respectively. RMSE and NRMSE of this simulation are shown in Table II.
V. CONCLUSION
The overall NRMSE is under 2%. Simulating the busy period produces the highest NRMSE, which has the RMSE of 15.89 W. The differences are mainly introduced by the following factors:
[image:5.595.305.543.53.154.2]1) Power consumption of the infrastructure. The power lines and supporting infrastructure consume some en-ergy that is not modeled in this simulator.
[image:5.595.306.547.665.765.2]2) Efficiency of the power supply unit (PSU). PSUs are known to have different efficiency at different load level. However, this is not considered in the proposed design.
3) Granularity of the computing capability modeling. This study uses simple coarse-granularity profiling to model the computing capability of different types of server nodes. This approach may affect the accuracy of the simulation.
Although there is difference between the real data and the simulation result, this study considers that the proposed de-sign is good enough for empirical practice for the following reasons:
1) Users only need to gather the the relationship between CPU utilization rates and the corresponding power consumption to build the power profile for each type of server node. This can be easy conducted by using a DMM and a software package, such assar.
2) Profiling computing capability used in this study is easy and intuitive. The validation conducted in the pre-vious section proves this approach is accurate enough to profile the power consumption pattern of the targeted cluster.
Such simple design enables data center managers to use inexpensive tools and simple programming to construct a workload dispatching simulator for estimating the energy usage of their heterogeneous clusters. With such simulator, some applications can be easily provoked, such as: estimating the energy cost with time-based tariffs, impacts of applying different workload dispatching schemes, changes in service quality when some server nodes are replaced or removed, etc. These applications eventually improve the energy effi-ciency and energy cost management for data centers adopted heterogeneous clusters.
REFERENCES
[1] K. Chandra and A. Eckberg, “Traffic characteristics of on-line ser-vices,” inComputers and Communications, 1997. Proceedings., Sec-ond IEEE Symposium on, jul 1997, pp. 17 –21.
[2] M. Arlitt and T. Jin, “A workload characterization study of the 1998 world cup web site,”Network, IEEE, vol. 14, no. 3, pp. 30 –37, may/jun 2000.
[3] G. Chen, W. He, J. Liu, S. Nath, L. Rigas, L. Xiao, and F. Zhao, “Energy-aware server provisioning and load dispatching for connection-intensive internet services,” inProceedings of the 5th USENIX Symposium on Networked Systems Design and Implementa-tion, vol. 8. USENIX Association, 2008, pp. 337–350.
[4] L. Parolini, N. Tolia, B. Sinopoli, and B. H. Krogh, “A cyber-physical systems approach to energy management in data centers,” in Proceedings of the 1st ACM/IEEE International Conference on Cyber-Physical Systems, ser. ICCPS ’10. New York, NY, USA: ACM, 2010, pp. 168–177.
[5] A. Beloglazov, R. Buyya, Y. Lee, and A. Zomaya, “A taxonomy and survey of energy-efficient data centers and cloud computing systems,” Advances in Computers, vol. 82, pp. 47–111, 2011.
[6] Federal Energy Regulatory Commission, “Assessment of demand response and advanced metering,” FERC Staff Report, Federal Energy Regulatory Commission, Washington DC, Tech. Rep., 2006. [7] E. Pinheiro, R. Bianchini, E. Carrera, and T. Heath, “Load balancing
and unbalancing for power and performance in cluster-based systems,” inWorkshop on compilers and operating systems for low power, vol. 180, 2001, pp. 182–195.
[8] T. Heath, B. Diniz, E. V. Carrera, W. Meira, Jr., and R. Bianchini, “Energy conservation in heterogeneous server clusters,” inProceedings of the tenth ACM SIGPLAN symposium on Principles and practice of parallel programming, ser. PPoPP ’05. New York, NY, USA: ACM, 2005, pp. 186–195. [Online]. Available: http://doi.acm.org/10.1145/1065944.1065969
[9] Z. Abbasi, G. Varsamopoulos, and S. K. S. Gupta, “Tacoma: Server and workload management in internet data centers considering cooling-computing power trade-off and energy proportionality,”ACM Trans. Archit. Code Optim., vol. 9, no. 2, pp. 11:1–11:37, Jun. 2012. [Online]. Available: http://doi.acm.org/10.1145/2207222.2207227 [10] L. Wang and Y. Lu, “An efficient threshold-based power management
mechanism for heterogeneous soft real-time clusters,”Industrial In-formatics, IEEE Transactions on, vol. 6, no. 3, pp. 352 –364, aug. 2010.